4th of July Climate History for Chicago, IL
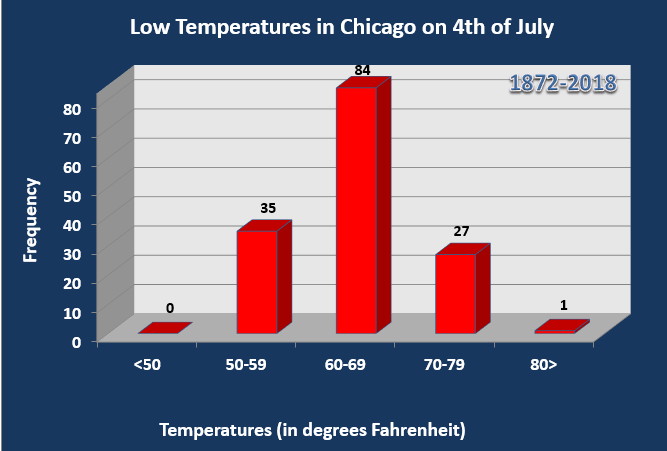
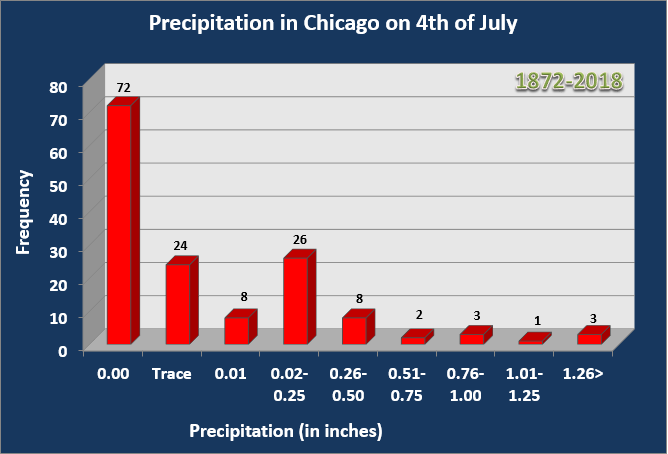
The following statistics comprises 148 years of data. Data collection began at the University of Chicago, then at Midway, and currently at O'Hare which is now the official station for Chicago.
To see the daily climate data for Chicago for 4th of July from 1872-Present, click here.
|

|
| WARMEST HIGHS |
COLDEST HIGHS |
| 102 in 2012 * |
62 in 1920 |
| 98 in 1949 |
63 in 1909 * |
| 96 in 1990 * |
64 in 1967 * |
| 95 in 1921 * |
65 in 1890 |
| 94 in 2003 * |
66 in 1997 * |
| 93 in 2018 * |
67 in 1961 |
| 92 in 1955 |
68 in 1972 * |
| 91 in 2019 * |
69 in 1956 * |
| 90 in 2002 * |
70 in 1872 |
| 89 in 2011 * |
71 in 1970 * |
*Denotes a tie in previous year(s)
|
|

|
| WARMEST LOWS |
COLDEST LOWS |
| 80 in 1921 |
50 in 1972 |
| 79 in 2012 * |
51 in 1996 |
| 78 in 1911 * |
52 in 2008 * |
| 77 in 1990 * |
53 in 1967 |
| 76 in 2018 |
55 in 1942 * |
| 75 in 1993 * |
56 in 2013 * |
| 74 in 1994 * |
57 in 1992 * |
| 73 in 2003 * |
58 in 2014 * |
| 72 in 1955 |
59 in 2015* |
| 71 in 1975 * |
60 in 1986* |
*Denotes a tie in previous year(s)
|
|

|
| WETTEST |
| 1.72" in 1995 |
| 1.60" in 1883 |
| 1.38" in 1873 |
| 1.02" in 1888 |
| 0.91" in 1942 |
| 0.90" in 1958 |
| 0.85" in 1899 |
| 0.74" in 1973 |
| 0.60" in 1915 |
| 0.48" in 1880 |
*Denotes a tie in previous year(s)
|
4th of July Climate History for Rockford, IL
The following statistics comprises 114 years of data. Data collection for Rockford was at the Greater Rockford Airport. Data is missing from 1920 and 1946.
To see the daily climate data for Rockford for 4th of July from 1905-Present, click here.
|

|
| WARMEST HIGHS |
COLDEST HIGHS |
| 102 in 2012 |
62 in 1967 |
| 101 in 1911 |
66 in 1961 * |
| 100 in 1921 |
68 in 1972 |
| 96 in 1949 |
69 in 1997 * |
| 95 in 1990 * |
70 in 2009 * |
| 94 in 1977 * |
73 in 1920 * |
| 93 in 2002 * |
74 in 1998 * |
| 92 in 1999 * |
75 in 1956 * |
| 91 in 2003 * |
76 in 1932 |
| 90 in 2018 * |
77 in 2005 * |
*Denotes a tie in previous year(s)
|
|

|
| WARMEST LOWS |
COLDEST LOWS |
| 77 in 1977 |
46 in 1967 * |
| 76 in 1999 |
48 in 1940 * |
| 75 in 2012 |
49 in 1941 * |
| 73 in 2018 * |
50 in 1972 * |
| 72 in 1955 * |
51 in 2008 * |
| 71 in 1966 * |
52 in 2014 * |
| 70 in 2003 * |
53 in 1916 * |
| 69 in 2004 * |
54 in 1907 |
| 68 in 2002 * |
55 in 1997 * |
| 67 in 2010* |
56 in 2013 * |
*Denotes a tie in previous year(s)
|
|

|
| WETTEST |
| 1.36" in 1973 |
| 1.25" in 1935 |
| 1.05" in 1925 |
| 0.93" in 1995 |
| 0.89" in 1994 |
| 0.68" in 1985 |
| 0.55" in 1932 |
| 0.49" in 1907 |
| 0.43" in 1961 |
| 0.40" in 1942 |
*Denotes a tie in previous year(s)
|