Fast Facts | Snowfall Totals | Meteorology | Late Season Snow | Other Stories
Fast Facts
- Heavy snowfall rates of 1-2 inches per hour were frequently seen across much of northern Illinois and far northwest Indiana during Monday morning, March 23rd.
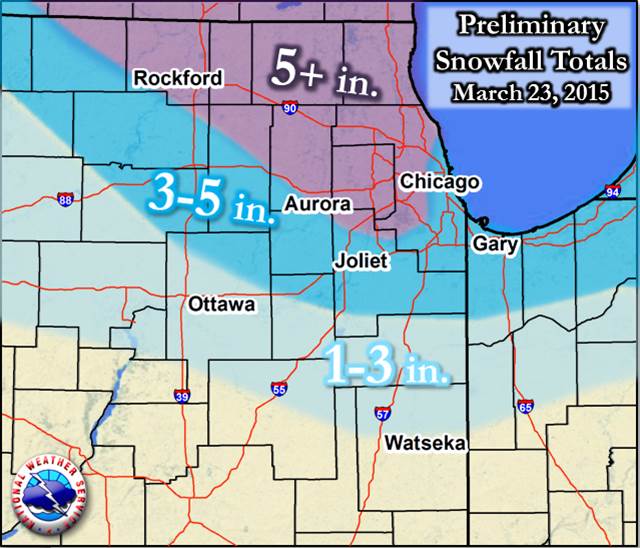
- Chicago finished with 5.8" of snow and Rockford with 5.1".
- The snow during March 23rd for both Chicago and Rockford was the highest daily snowfall amount after the spring equinox since 1982.
- For Chicago, this brought the seasonal total up to 50.1". This now makes 6 of the past 8 winters with snowfall totals in excess of 50" for Chicago. This comes after only one such winter during the 25 year stretch from 1982-2007.
Snowfall Totals
|
Preliminary Snowfall Map
|
|
|
Meteorology
Some of the key meteorological takeaways of this event:
- The timing of this event was key to impacts, in that it came during the morning commute time, including in the Rockford and Chicago metro areas.
- Snowfall rates of 1-2" per hour were common during Monday morning and spread across a larger area than is typically seen with a Pacific/Clipper-hybrid system. Normally such rates with these systems archetypes are in focused bands.
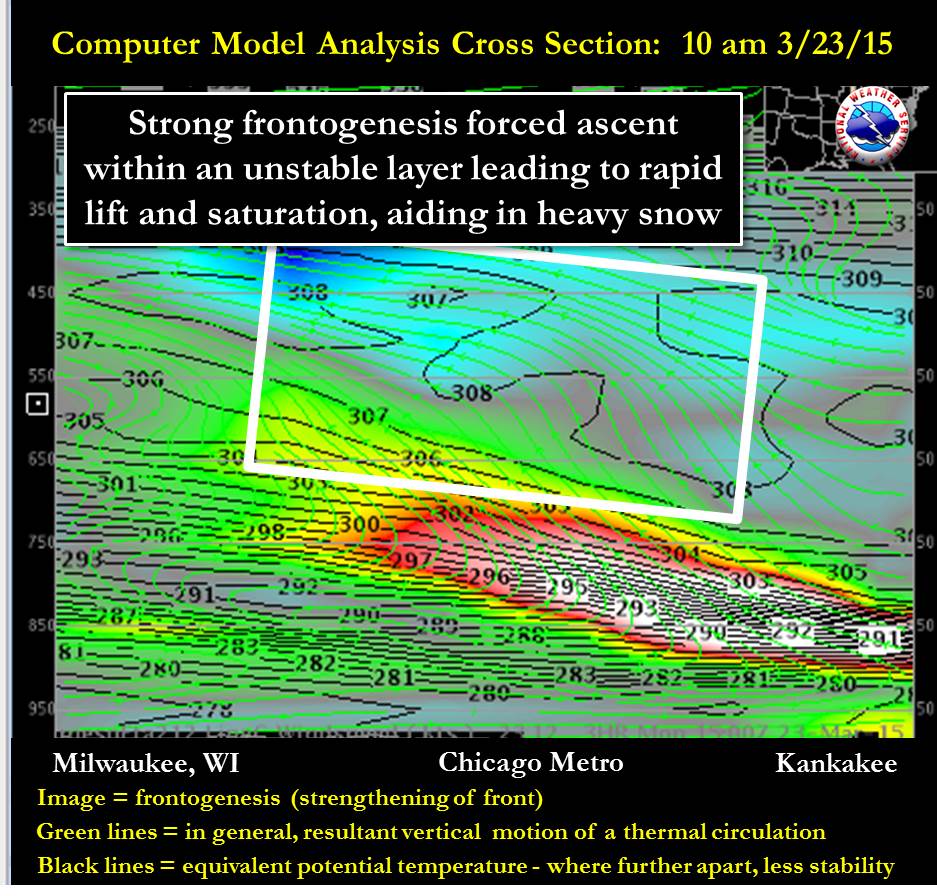
- High moisture (3-4 g/kg) was steered into the precipitation forcing region of this system. In other words, ample moisture was ingested and the forcing for lift was strong enough to wipe out the dry low-level air mass ahead of the snow.
- The thermal profile aloft was unstable enough to warrant some thundersnow to the northwest of the area. Even though thundersnow did not occur in our area, the thermal profile aloft was quite unstable per observation and analysis and thus resulted in stronger areas of rising air and quicker precipitation development and increased rates.
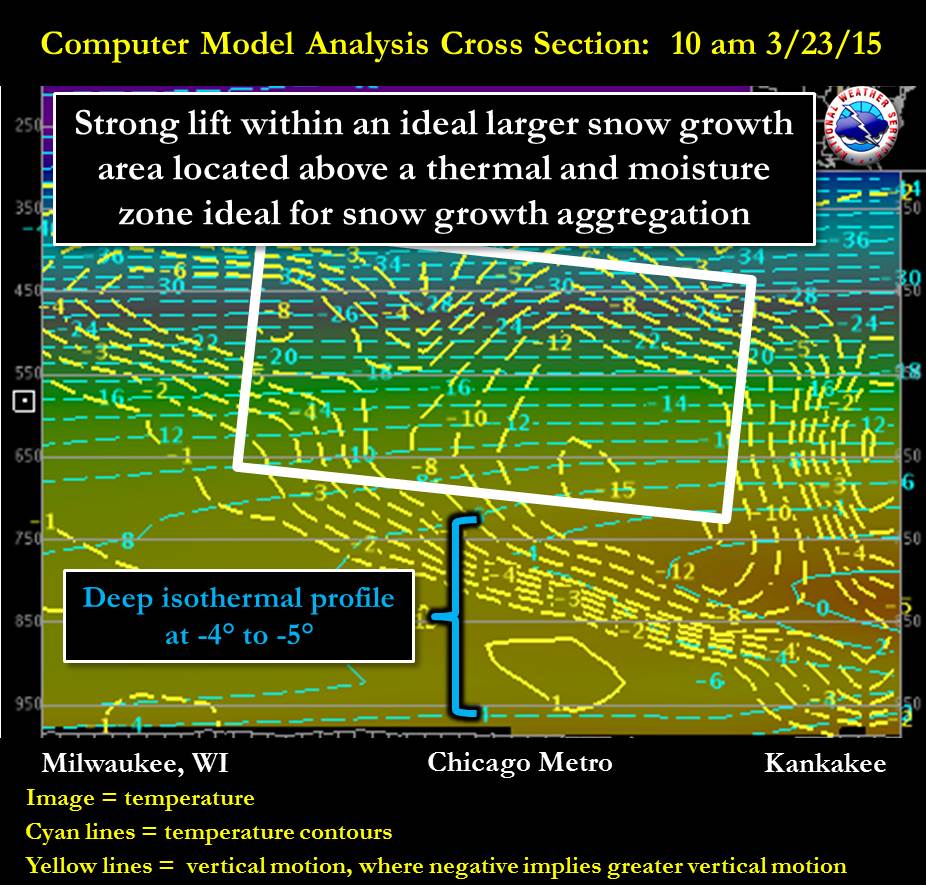
- Typically with early or late season events where the atmosphere is milder than during the heart of winter, snow-to-liquid ratios can be quite low...or in other words, the "efficiency" of the atmosphere to produce snowfall from the same amount of liquid diminishes. While low ratios were indeed observed, the vertical temperature and moisture profiles ended up being ideal for snow aggregation, where flakes "clump" together as they fall, leading to larger flakes reaching the surface producing quicker and larger accumulations.
|
Water Vapor Satellite Loop on 3/23/15: 2 am - 12 pm
|
|
|
|
This satellite loop shows the pronounced upper level wave and its areas of rapid saturation in advance, where the heaviest of snow was being observed under.
|
|
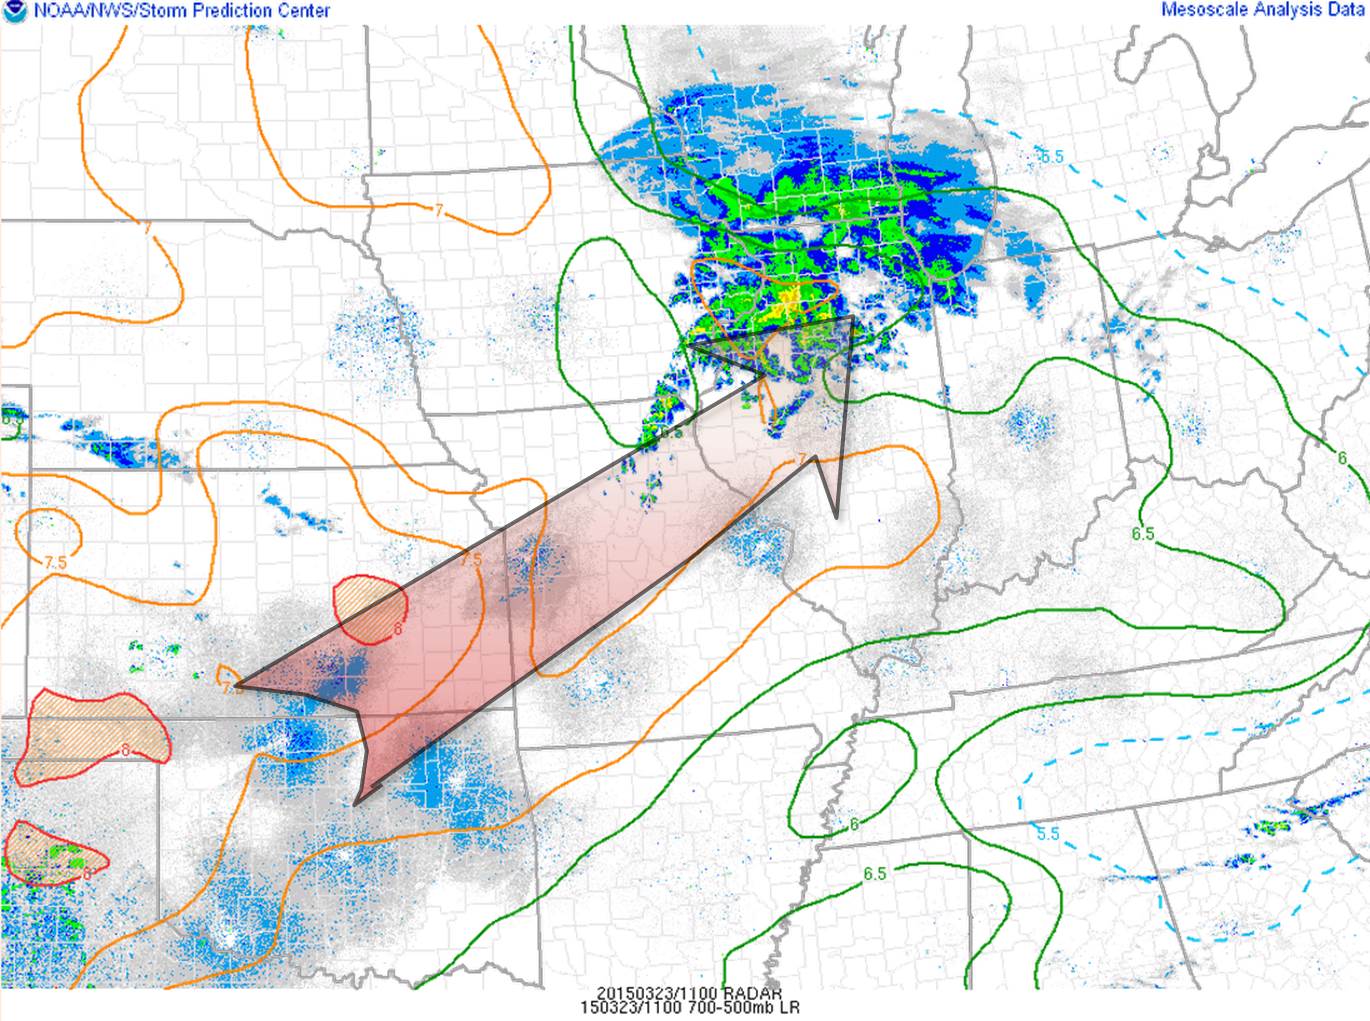
Elevated Lapse Rates (Instability) on 3/23/15: 7 a.m.
|
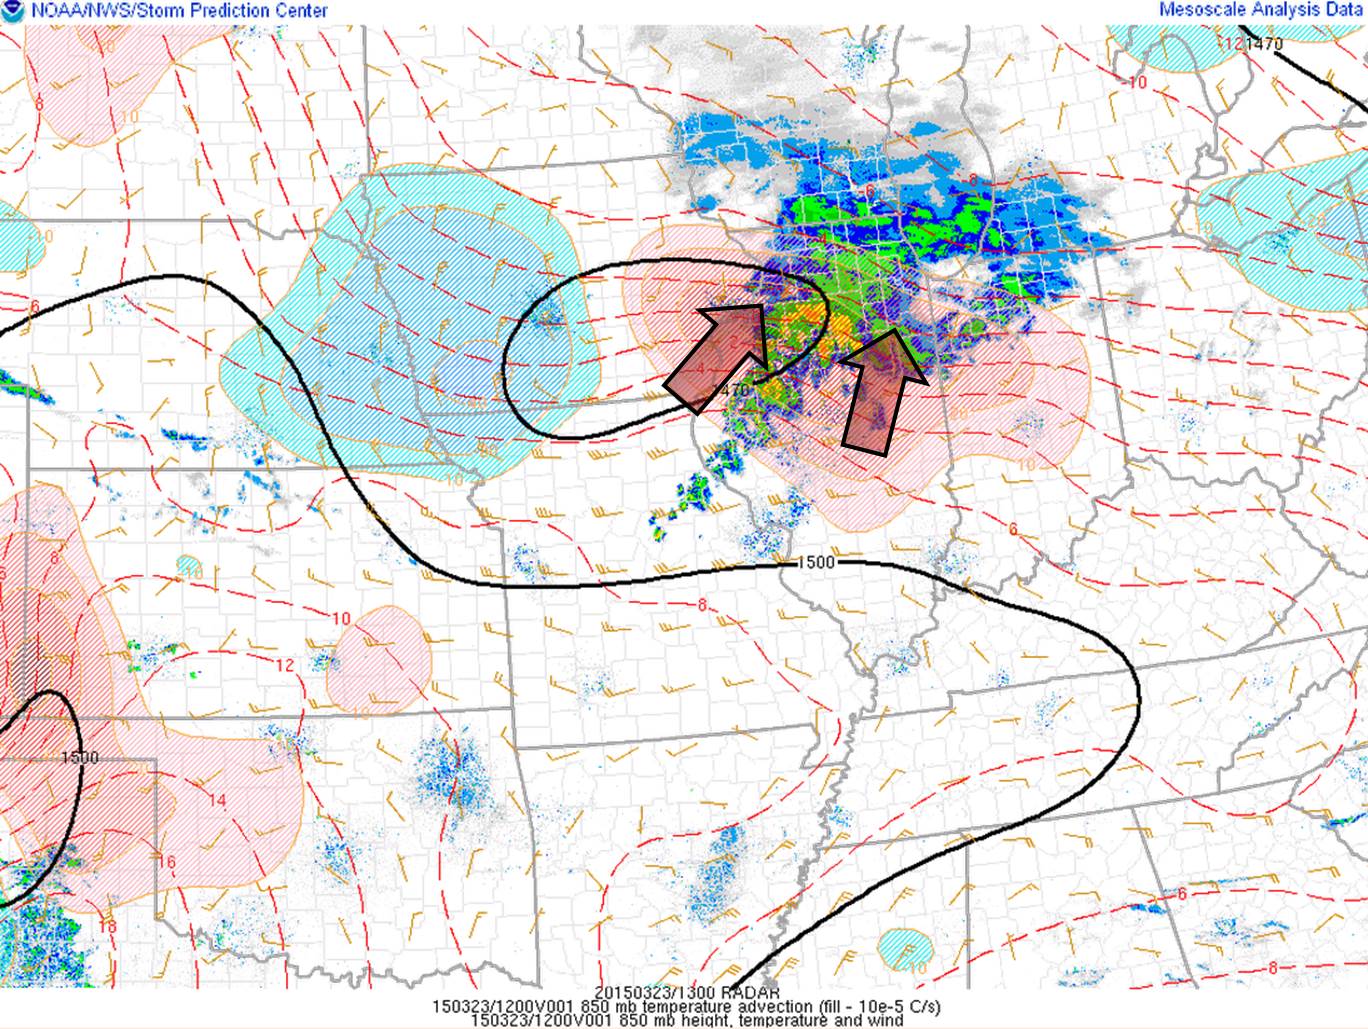
850mb Warm Advection (Milder Air Advancing and Lifting) on 3/23/15: 10 a.m.
|
|
|
|
|
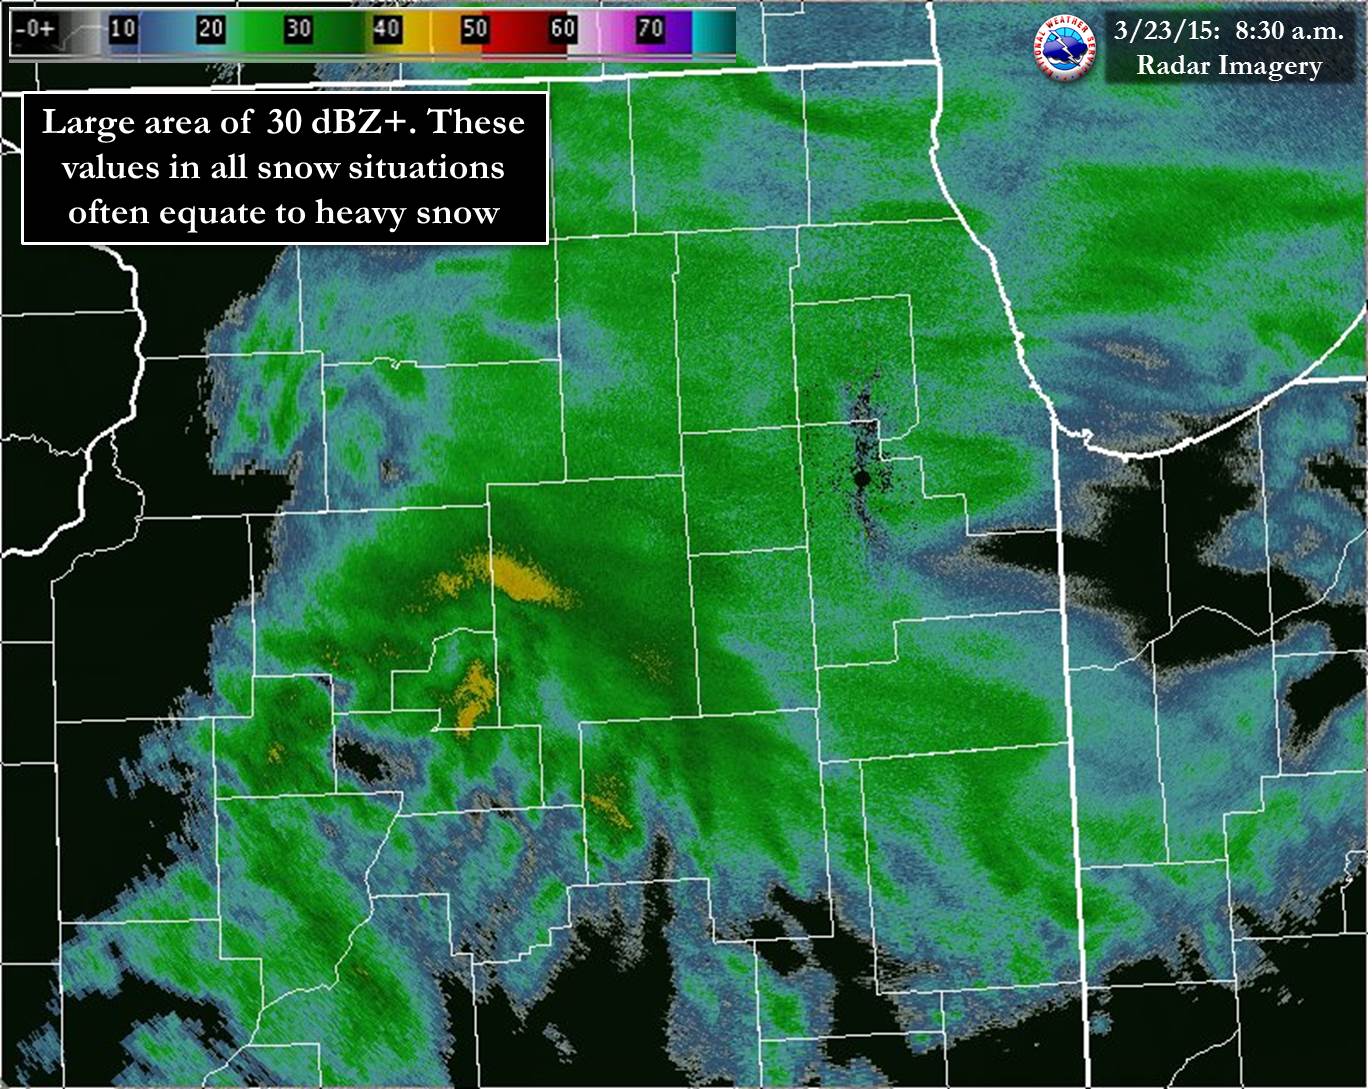
NWS Chicago 0.5° Radar Image from 3/23/15: 8:30 a.m.
|
|
|
Late Season Snow Climatology
PUBLIC INFORMATION STATEMENT
NATIONAL WEATHER SERVICE CHICAGO IL
242 PM CDT MON MAR 23 2015

...LARGEST CALENDAR DAY SNOW AFTER THE SPRING EQUINOX SINCE 1982...

BOTH ROCKFORD AND CHICAGO OHARE AIRPORTS TODAY...MARCH 23RD...
RECEIVED OVER FIVE INCHES OF SNOW. THIS WAS THEIR HIGHEST CALENDAR
DAY SNOW AFTER MARCH 21ST SINCE 1982. PLEASE SEE THE FOLLOWING
TABLES TO SEE WHERE THE SNOW RANKED WHEN COMPARED TO ALL OTHER POST
SPRING EQUINOX SNOWFALLS OF FIVE INCHES OR MORE:

...CHICAGO...

RANK   VALUE   DATE
1      13.6    MARCH 25 1930
2      9.4     APRIL 5 1982
-      9.4     APRIL 2 1975
4      9.0     APRIL 6 1938
5      8.9     MARCH 26 1970
6      8.2     APRIL 1 1970
7      7.8     MARCH 30 1926
8      7.7     MARCH 29 1954
9      7.1     MARCH 29 1964
10     6.6     MARCH 26 1934
11     6.5     MARCH 29 1972
12     6.4     APRIL 4 1920
13     5.6     MARCH 23 2015
-      5.6     MARCH 26 1930
15     5.4     MARCH 25 1970
-      5.4     MARCH 23 1965
-      5.4     APRIL 16 1961
18     5.3     MARCH 28 1894

THE TOTAL SNOWFALL FOR THIS MOST RECENT EVENT WAS 5.8
INCHES WITH 0.2 OF THAT HAVING FELL ON MARCH 22ND AND THUS NOT
INCLUDED IN THE TABLE ABOVE.


...ROCKFORD...

RANK   VALUE   DATE
1      13.5    MARCH 31 1926
2      12.0    MARCH 23 1897
3      10.4    MARCH 29 1972
4      7.0     APRIL 18 1912
5      6.3     APRIL 5 1982
6      6.0     APRIL 6 1938
-      6.0     MARCH 25 1933
8      5.1     MARCH 23 2015
9      5.0     MARCH 29 1954
-      5.0     MARCH 25 1933

$$

JEE
Other Stories