|
|
Overview
|
|
 |
Tornadoes
The first 4 tornadoes out of the 22 that occurred in the NWS Chicago forecast area during this event were scattered across portions of northern Illinois. The remaining 18 tornadoes occurred in a narrow corridor of the Kankakee River Valley.
|
|
| Tornado |
Start Time (CDT) |
End Time (CDT) |
Path Length (miles) |
Path Width (yards) |
EF Rating |
Maximum Wind Speed |
|---|---|---|---|---|---|---|
| Earlville | 9:16 PM | 9:17 PM | 1.5 | 50 | EF-1 | 110 mph |
| Newark | 9:38 PM | 9:39 PM | 1.2 | 50 | EF-1 | 100 mph |
| Morris | 9:44 PM | 9:46 PM | 2.2 | 50 | EF-0 | 85 mph |
| Plainfield-Romeoville | 9:55 PM | 9:58 PM | 3.1 | 75 | EF-1 | 95 mph |
1.) Earlville Tornado
|
(click on image to enlarge) |
|
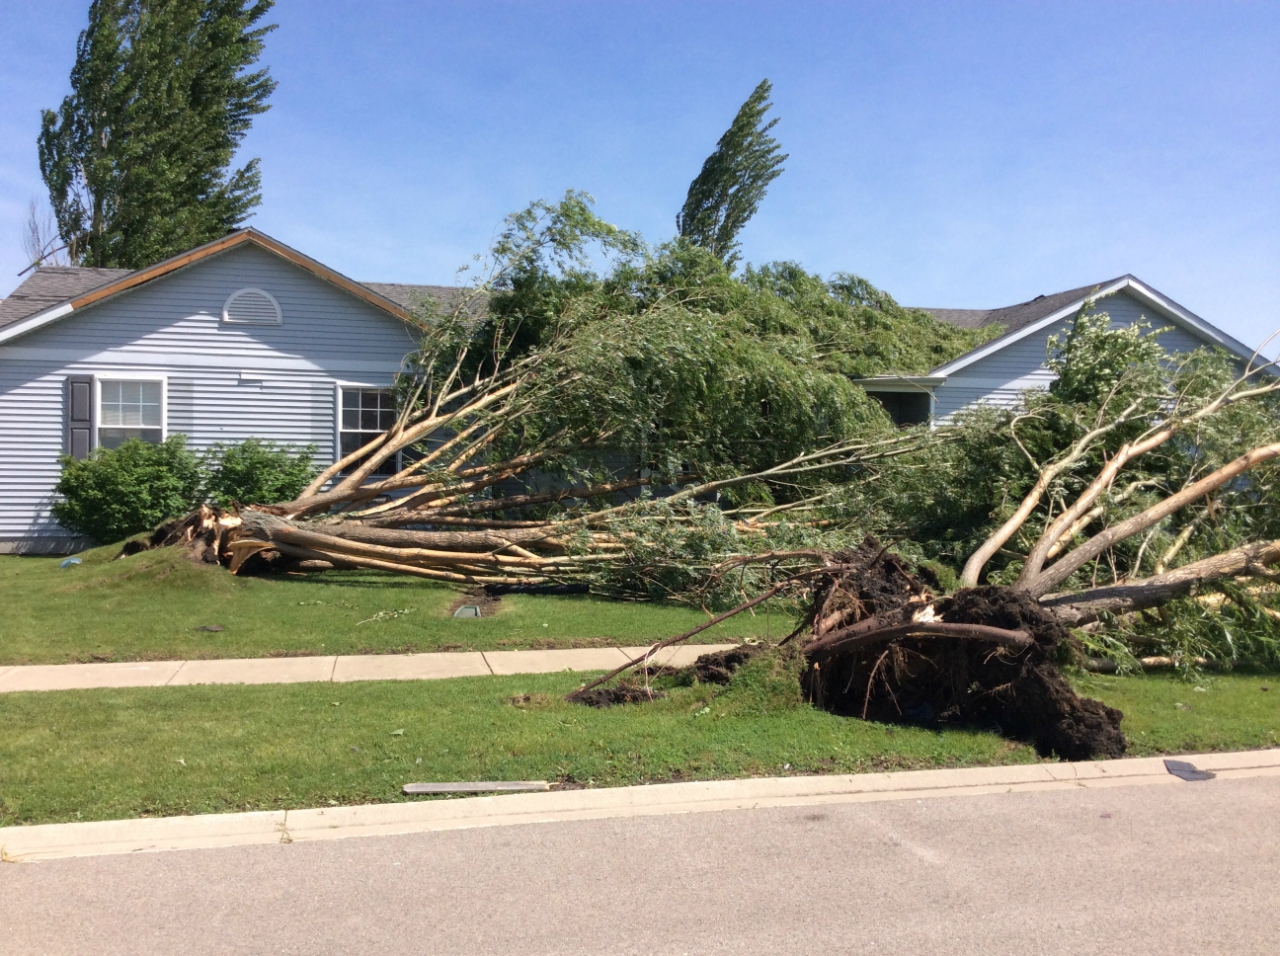
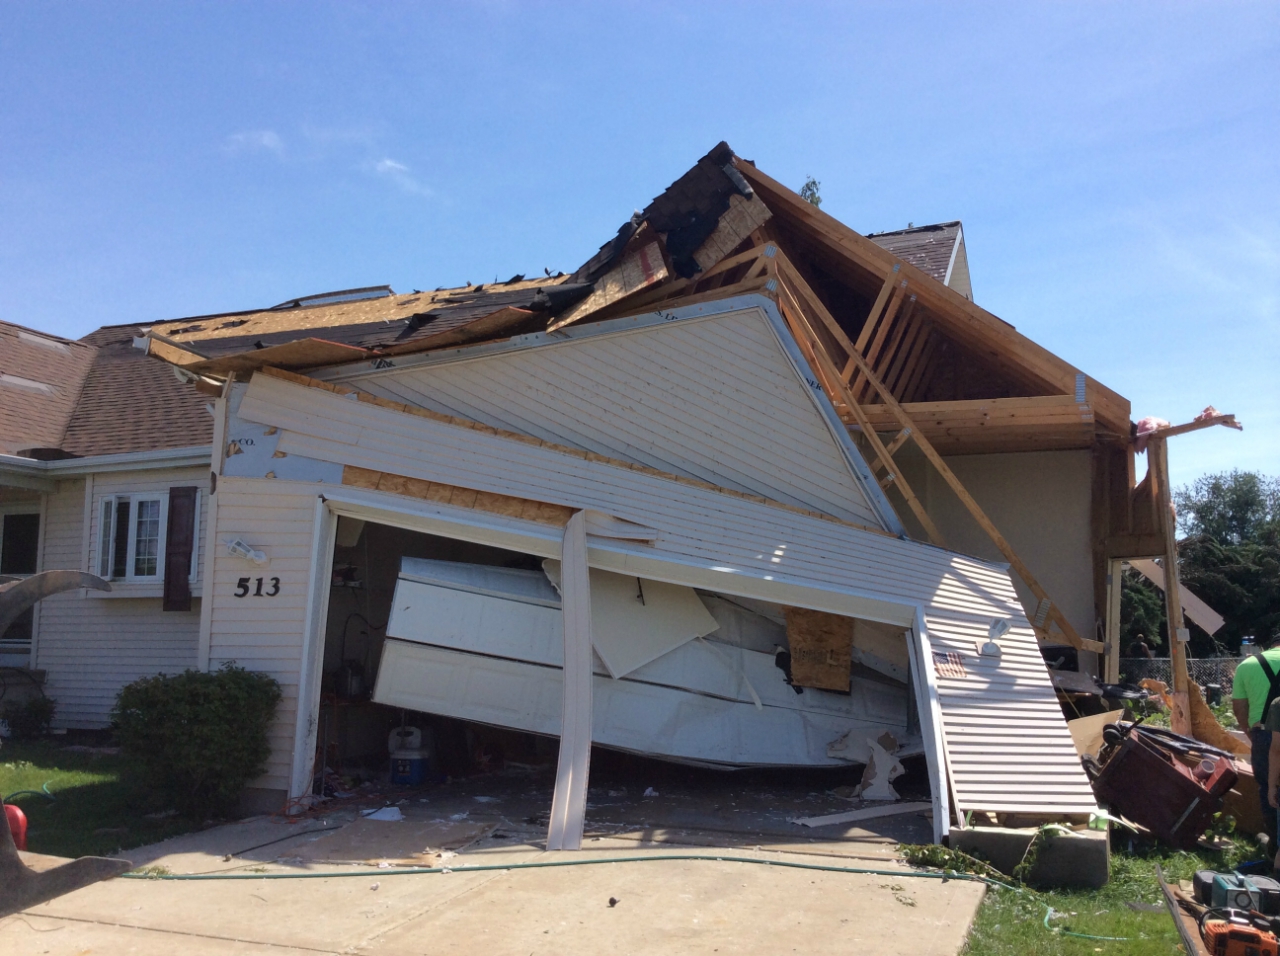
Summary: An aerial survey from local media showed clear convergent swirling and scarring near Earlville. A short lived tornado touched down embedded within a larger area of straight-line wind damage. Numerous trees were blown down with damage to roofs and a garage blown out on the south and southwest portions of town. Maximum winds were estimated to 110 mph. |
2.) Newark Area Tornado
|
(click on image to enlarge) |
|
Summary: Concentrated damage was found at two farmsteads, including the destruction of an outbuilding and large trees snapped at their bases. Maximum winds were estimated to 100 mph. |
3.) Morris Area Tornado
|
(click on image to enlarge) |
|
Summary: An NWS storm survey team determined via an aerial survey that a tornado touched down over mainly fields north of Morris. Maximum winds were estimated to 85 mph. |
4.) Plainfield-Romeoville Tornado
|
(click on image to enlarge) |
|
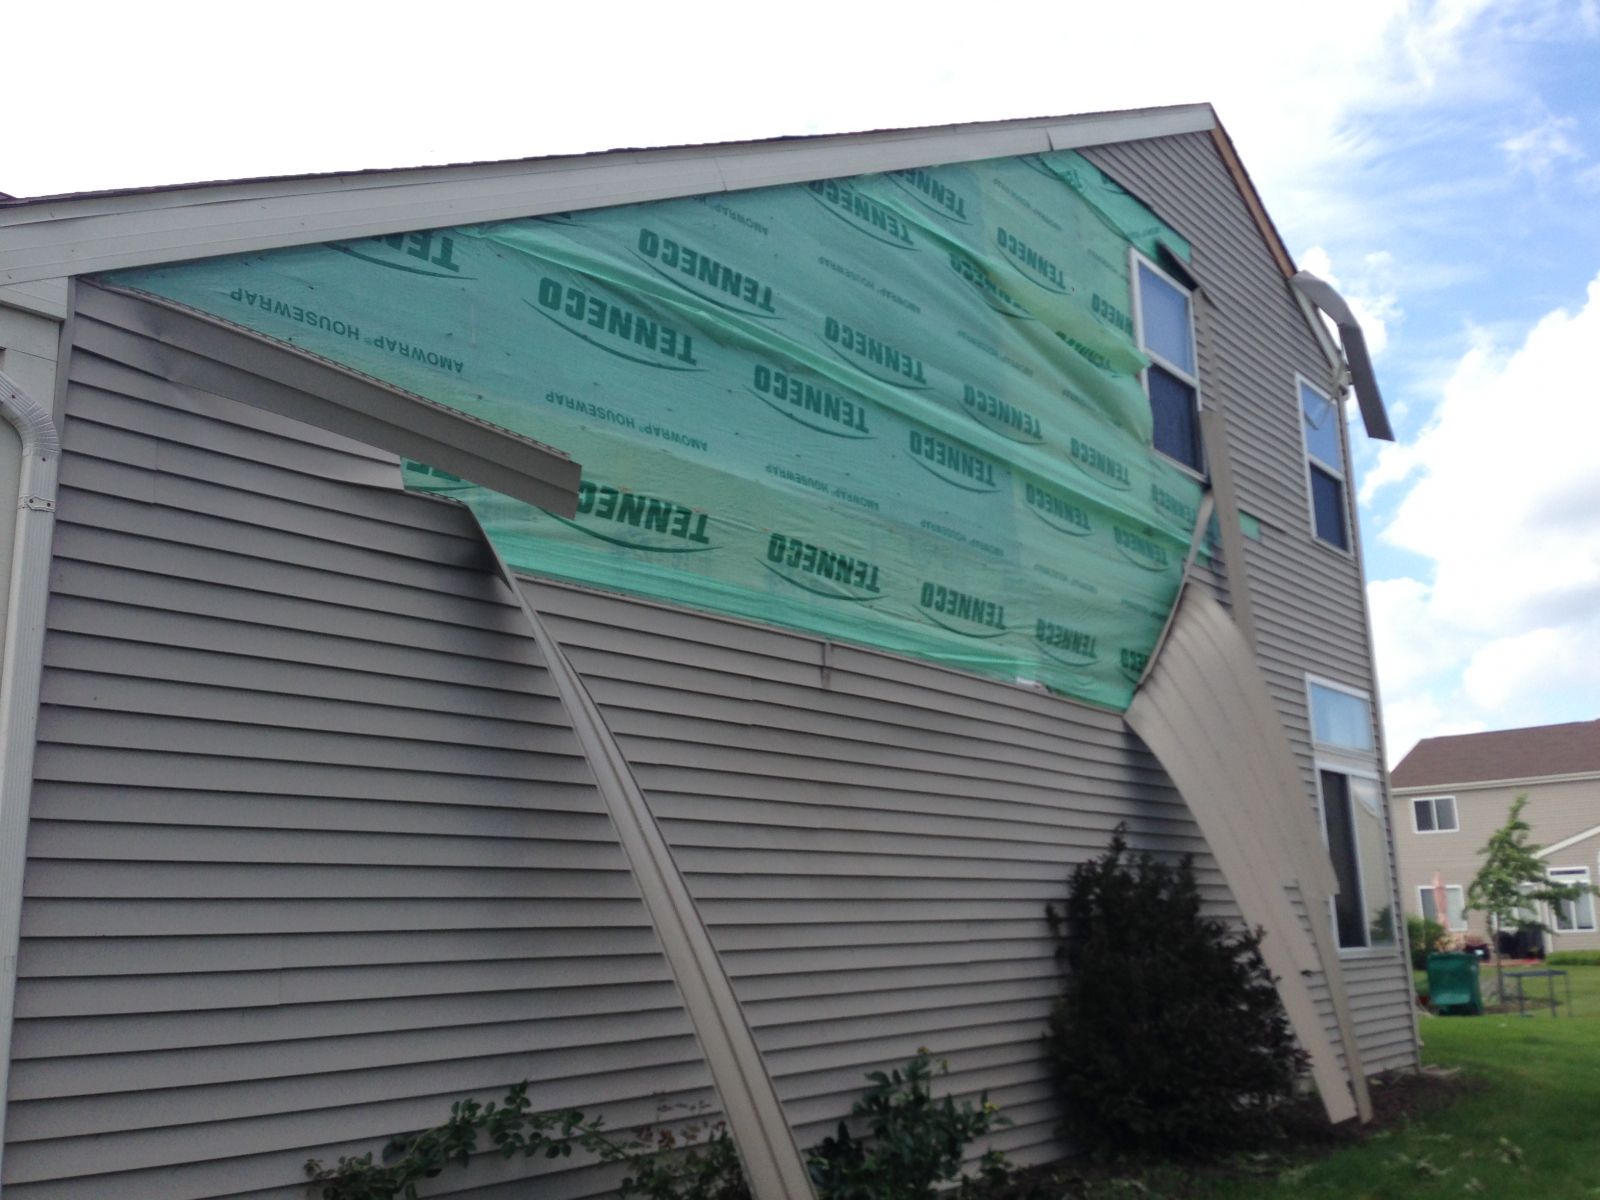
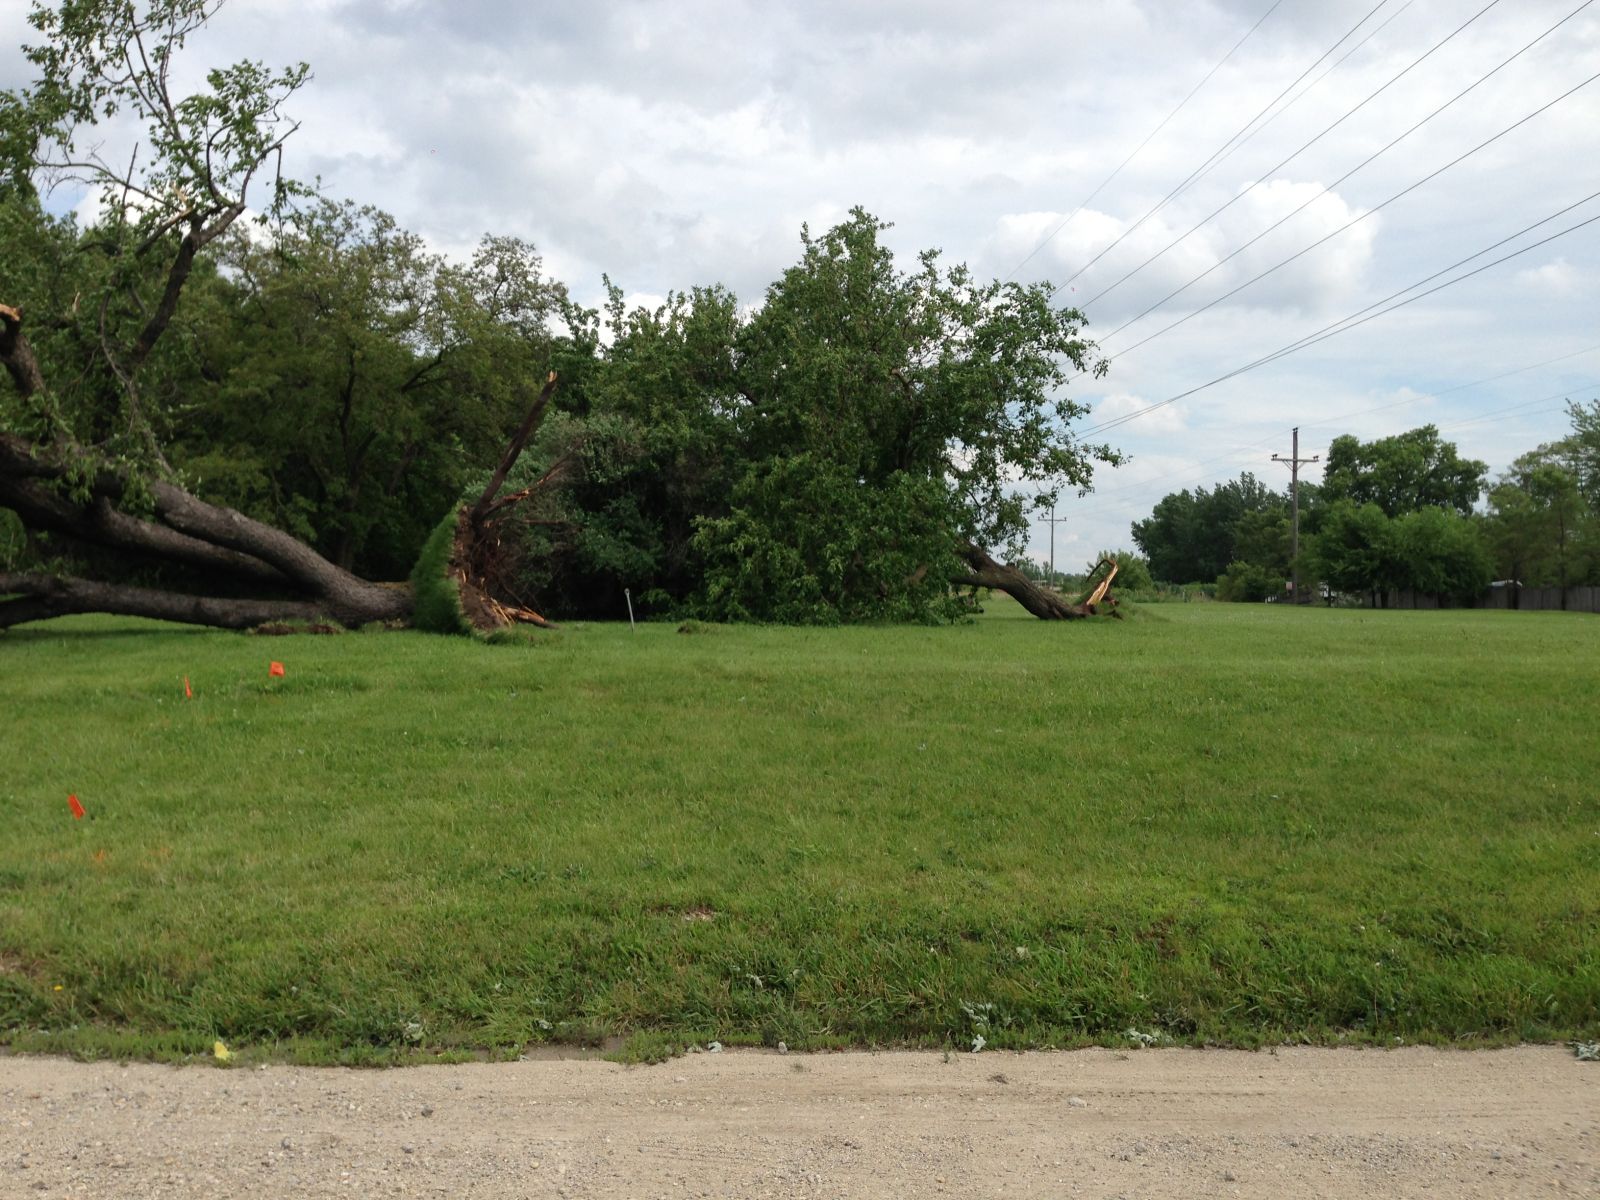
Summary: This tornado caused damage to trees and residences between Plainfield and Romeoville. Over 50 trees, including many large softwood trees, were uprooted within a concentrated path. A dozen modest to large trees were blown to the northwest against the eastward path of the storm. Numerous roads were blocked due to fallen trees. There was minor damage to numerous residences in the Woodlands of the Reserve and Lakewood Falls subdivisions. This damage mainly included peeled off siding and shingles, along with blown out windows. The tornado crossed I-55 near mile marker 261. The tornado was embedded within a larger area of straight-line wind damage. Maximum winds were estimated to 95 mph. |
|
|
| Tornado |
Start Time (CDT) |
End Time (CDT) |
Path Length (miles) |
Path Width (yards) |
EF Rating |
Maximum Wind Speed |
|---|---|---|---|---|---|---|
| Momence | 10:22 PM | 10:31 PM | 10.4 | 150 | EF-1 | 90 |
| Manteno #1 | 10:23 PM | 10:25 PM | 3.1 | 45 | EF-0 | 85 |
| Manteno #2 | 10:24 PM | 10:25 PM | 2.7 | 110 | EF-1 | 95 |
| Grant Park #1 | 10:26 PM | 10:28 PM | 4.6 | 110 | EF-1 | 105 |
| Grant Park #2 | 10:25 PM | 10:29 PM | 5.2 | 450 | EF-1 | 110 |
| Momence-Shelby | 10:29 PM | 10:43 PM | 15.7 | 175 | EF-1 | 110 |
| Grant Park #3 | 10:30 PM | 10:33 PM | 2.7 | 295 | EF-0 | 75 |
| Grant Park #4 | 10:32 PM | 10:35 PM | 3.9 | 240 | EF-2 | 115 |
| Grant Park #5 | 10:33 PM | 10:34 PM | 0.7 | 120 | EF-0 | 75 |
| Lowell #1 | 10:33 PM | 10:44 PM | 8.7 | 415 | EF-1 | 110 |
| Lowell #2 | 10:37 PM | 10:38 PM | 1.6 | 175 | EF-1 | 90 |
| Lowell #3 | 10:38 PM | 10:41 PM | 3.8 | 260 | EF-1 | 100 |
| Lowell #4 | 10:39 PM | 10:42 PM | 3.2 | 370 | EF-1 | 110 |
| Lowell #5 | 10:42 PM | 10:43 PM | 2.2 | 315 | EF-1 | 100 |
| Shelby-DeMotte | 10:42 PM | 10:54 PM | 13.2 | 395 | EF-1 | 110 |
| Lowell #6 | 10:44 PM | 10:46 PM | 3.2 | 295 | EF-2 | 115 |
| Lowell #7 | 10:46 PM | 10:47 PM | 2.1 | 185 | EF-1 | 105 |
| Stoutsburg/Wheatfield | 10:56 PM | 10:57 PM | 2.0 | 100 | EF-1 | 105 |
5.) Momence Area Tornado
|
(click on image to enlarge) |
|
Summary: This tornado started near the intersection of E. 6000N Rd and N. County Highway 51. Roof damage was done to a barn along with numerous trees snapped and uprooted. The tornado ended along County Highway 13. Maximum winds were estimated to be 90 mph. |
6.) Manteno Area Tornado #1
|
(click on image to enlarge) |
|
Summary: This tornado touched down near N. 5000E Rd and ended near N 8000E Rd. It snapped a wooden power pole and damaged corn along its path. Maximum winds were estimated to 85 mph. |
7.) Manteno Area Tornado #2
|
(click on image to enlarge) |
|
Summary: This tornado began near 10000N Rd and ended near a farmstead along N. 8000E Rd. A large machine shed was heavily damaged, and trees were snapped and uprooted. Maximum winds were estimated to 95 mph. |
8.) Grant Park Area Tornado #1
|
(click on image to enlarge) |
|
Summary: This tornado began near a farmstead on N. 8000E Rd and would end near the intersection of 9000N Rd and N. 11000E Rd. A barn was destroyed, a 4,000 lb. trailer moved 50 feet, and numerous hardwood trees were snapped and uprooted. Maximum winds were estimated to 105 mph. |
9.) Grant Park Area Tornado #2
|
(click on image to enlarge) |
|
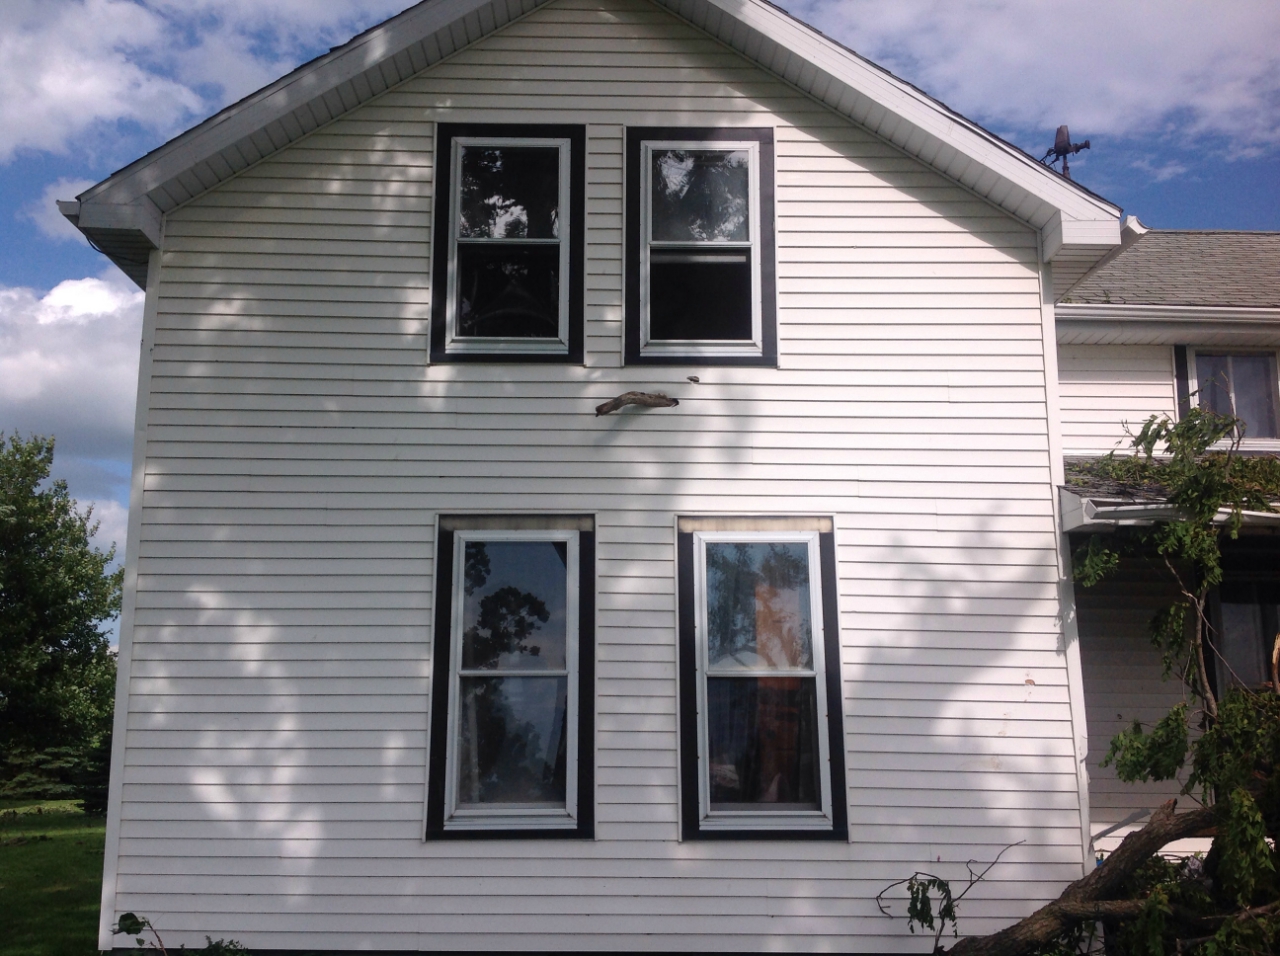
Summary: This tornado started near the intersection of 11000N Rd and N 8000E Rd. A large shed was destroyed with all of its posts and several anchors to the posts pulled from the ground. There was also minor buckling of a house's foundation, numerous trees snapped and uprooted, a snapped wooden power pole, and damage to corn crops. The tornado dissipated near Illinois Highway 1. Maximum winds were estimated to 110 mph. |
10.) Momence-Shelby Tornado
|
(click on image to enlarge) |
|
Summary: This tornado began north of Momence along Illinois Highway 17, crossed the Illinois-Indiana state line and tracked near 241st Ave. in Indiana. The tornado then passed through the far south end of the town of Schneider and ended near the Kankakee River southwest of Shelby. Damage was done to a roof of a barn along with numerous hardwood trees snapped and uprooted. Maximum winds were estimated to 110 mph. |
11.) Grant Park Area Tornado #3
|
(click on image to enlarge) |
|
Summary: This tornado that began near the intersection of 11000N Rd and Slaughter House Rd damaged a greenhouse and brought roof damage to a house, along with snapping large tree limbs. The tornado ended near County Highway 13. Maximum winds were estimated to 75 mph. |
12.) Grant Park Area Tornado #4
|
(click on image to enlarge) |
|
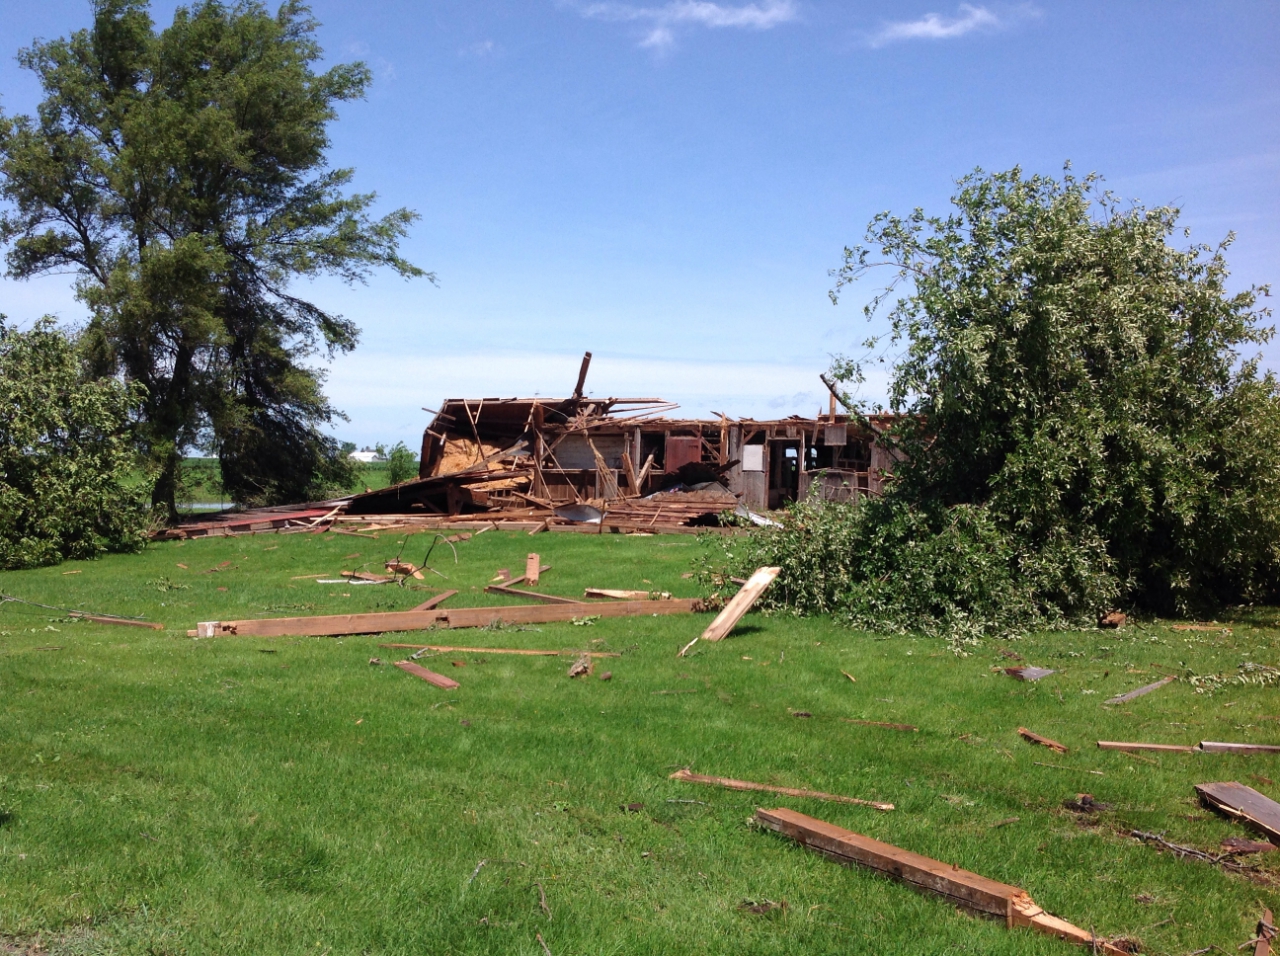
Summary: This strong tornado touched down slightly north of the intersection between E. 10500N Rd and N. 14000E Rd. The tornado torqued a house on its foundation beyond repair and damaged a small church. There were also numerous barns and outbuildings destroyed and severe damage to several large trees. The tornado dissipated near N. 17500E Rd. Maximum winds were estimated to 115 mph. |
13.) Grant Park Area Tornado #5
|
(click on image to enlarge) |
|
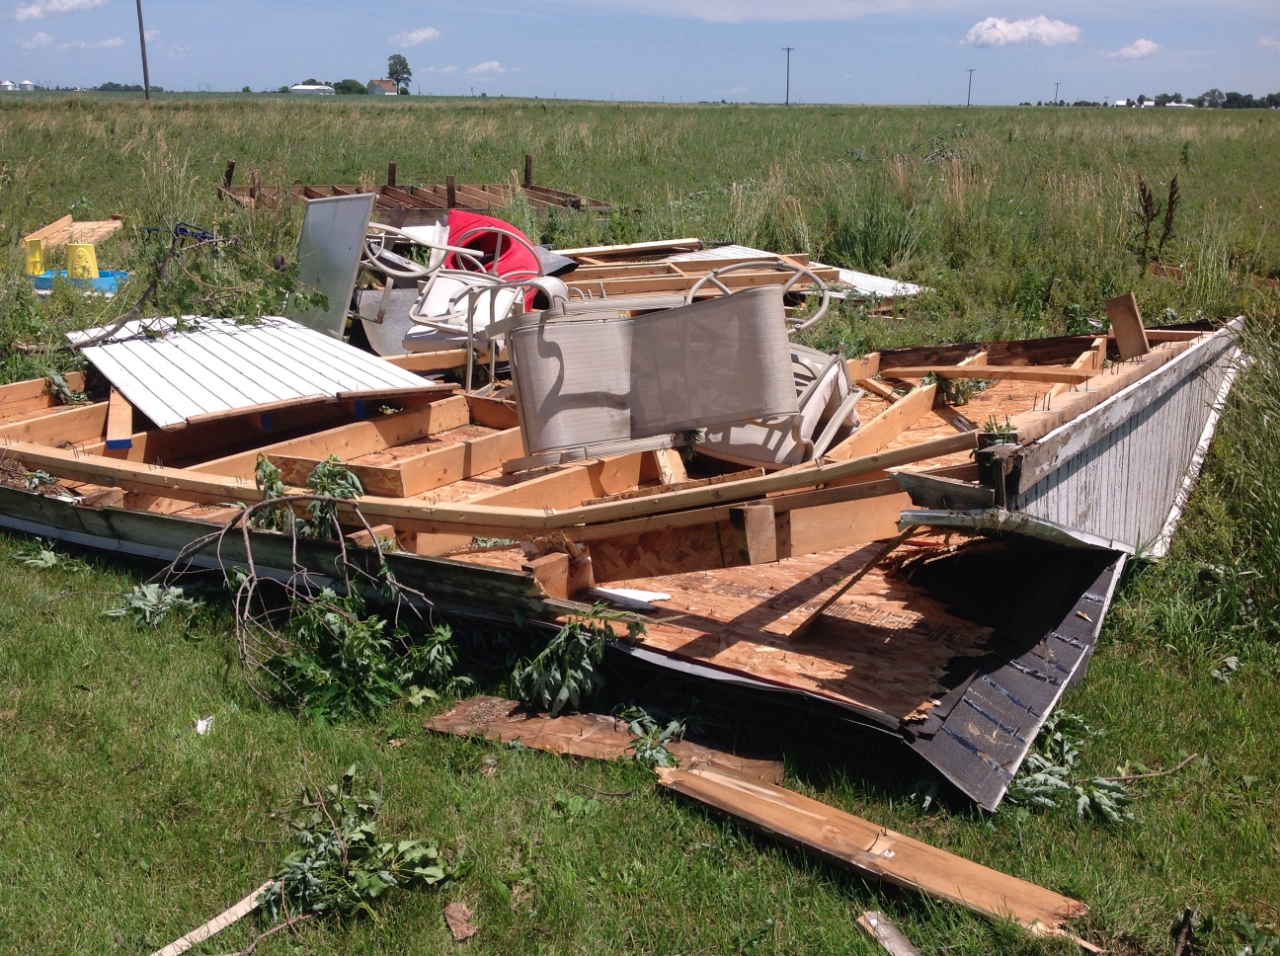
Summary: This very short-lived tornado tracked near E. 10500N Rd. Damage occurred to both a house and a barn, to a swimming pool, and to trees. Maximum winds were estimated to 75 mph. |
14.) Lowell Area Tornado #1
|
(click on images to enlarge) |
|
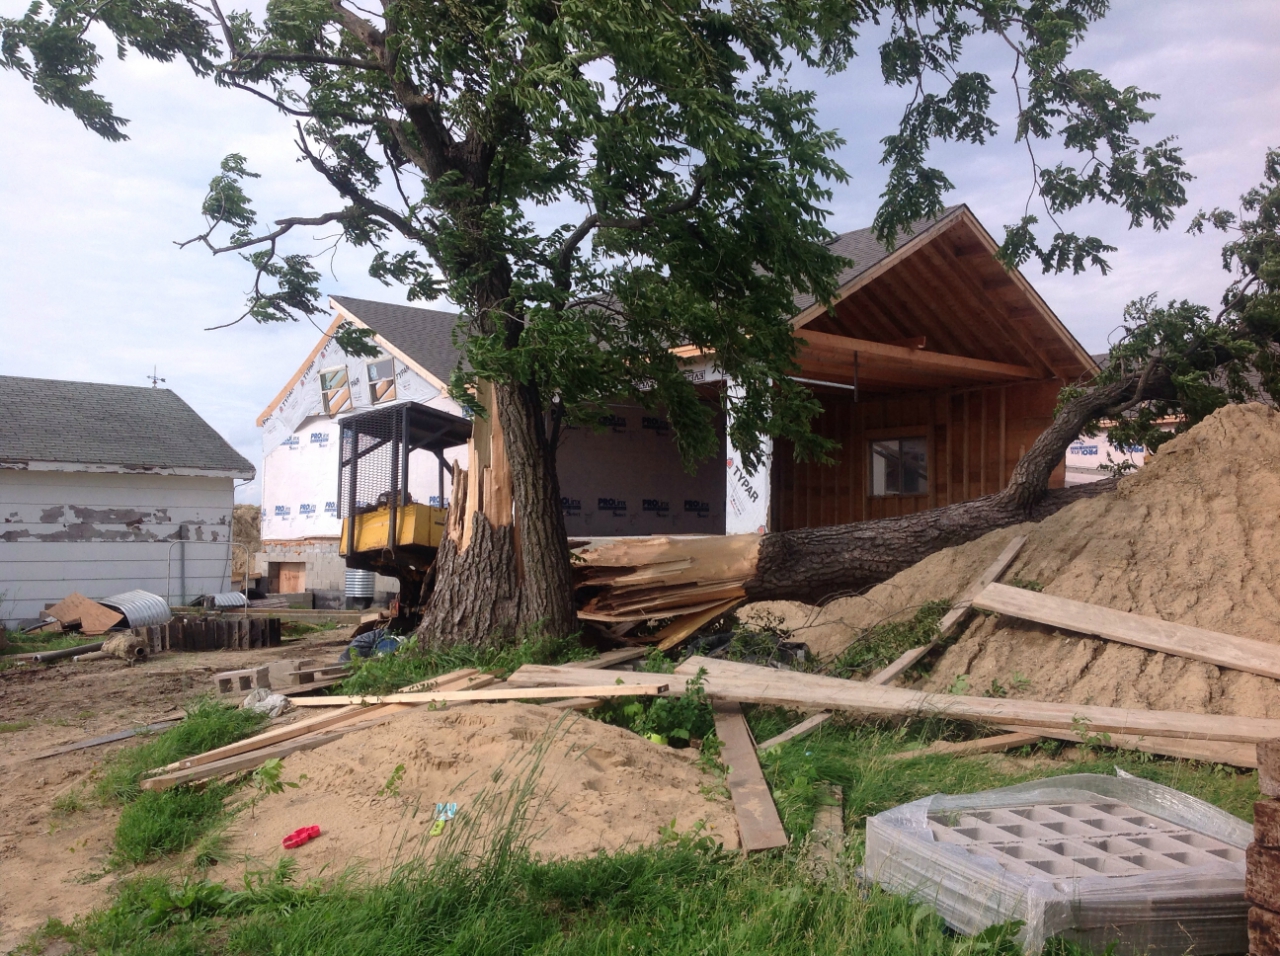
Summary: This tornado began near Kankakee County Highway 13 in Illinois and crossed into Indiana just south of E. 10500N Rd. A house under construction (but sealed) had an exterior wall of the garage blown out, part of a second story exterior wall blown in, and a portion of roof removed. A barn also had substantial roof damage along with numerous large trees snapped, uprooted, and partially stripped of their branches. The tornado dissipated south of Lowell, Indiana near Colfax St. Maximum winds were estimated to 110 mph. |
15.) Lowell Area Tornado #2
|
(click on image to enlarge) |
|
Summary: This short-lived tornado began just west of the Illinois-Indiana state line and crossed the state line into a grove of trees and ended near Calumet Ave. There were multiple large trees downed with this tornado. Maximum winds were estimated to 90 mph. |
16.) Lowell Area Tornado #3
|
(click on image to enlarge) |
|
Summary: This tornado started slightly east of the Illinois-Indiana state line and crossed U.S. Highway 41 before ending just east of Austin St. There were multiple large hardwood trees snapped and uprooted because of this tornado, as well as roof damage to a barn. Maximum winds were estimated to be 100 mph. |
17.) Lowell Area Tornado #4
|
(click on image to enlarge) |
|
Summary: This tornado touched down near the intersection of U.S. Highway 41 and Belshaw Rd and tracked due east ending near Colfax Rd. Damage was done primarily to trees. Maximum winds were estimated to 110 mph. |
18.) Lowell Area Tornado #5
|
(click on image to enlarge) |
|
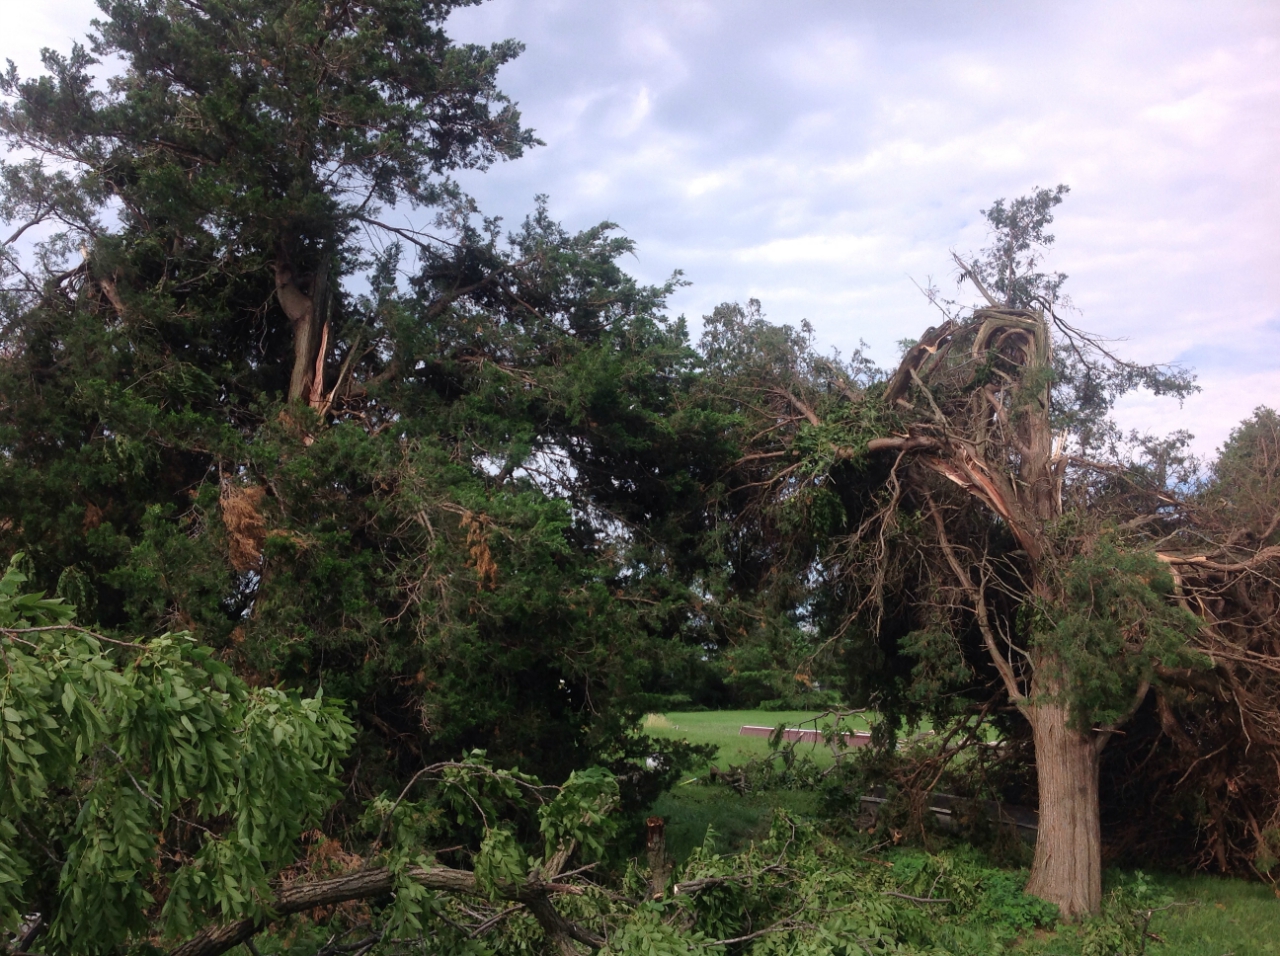
Summary: This tornado started near Cline Avenue southwest of the community of Lowell and ended near W. 197th Rd. Numerous trees were snapped and uprooted. Maximum winds were estimated to 100 mph. |
19.) Shelby-DeMotte Tornado
|
(click on image to enlarge) |
|
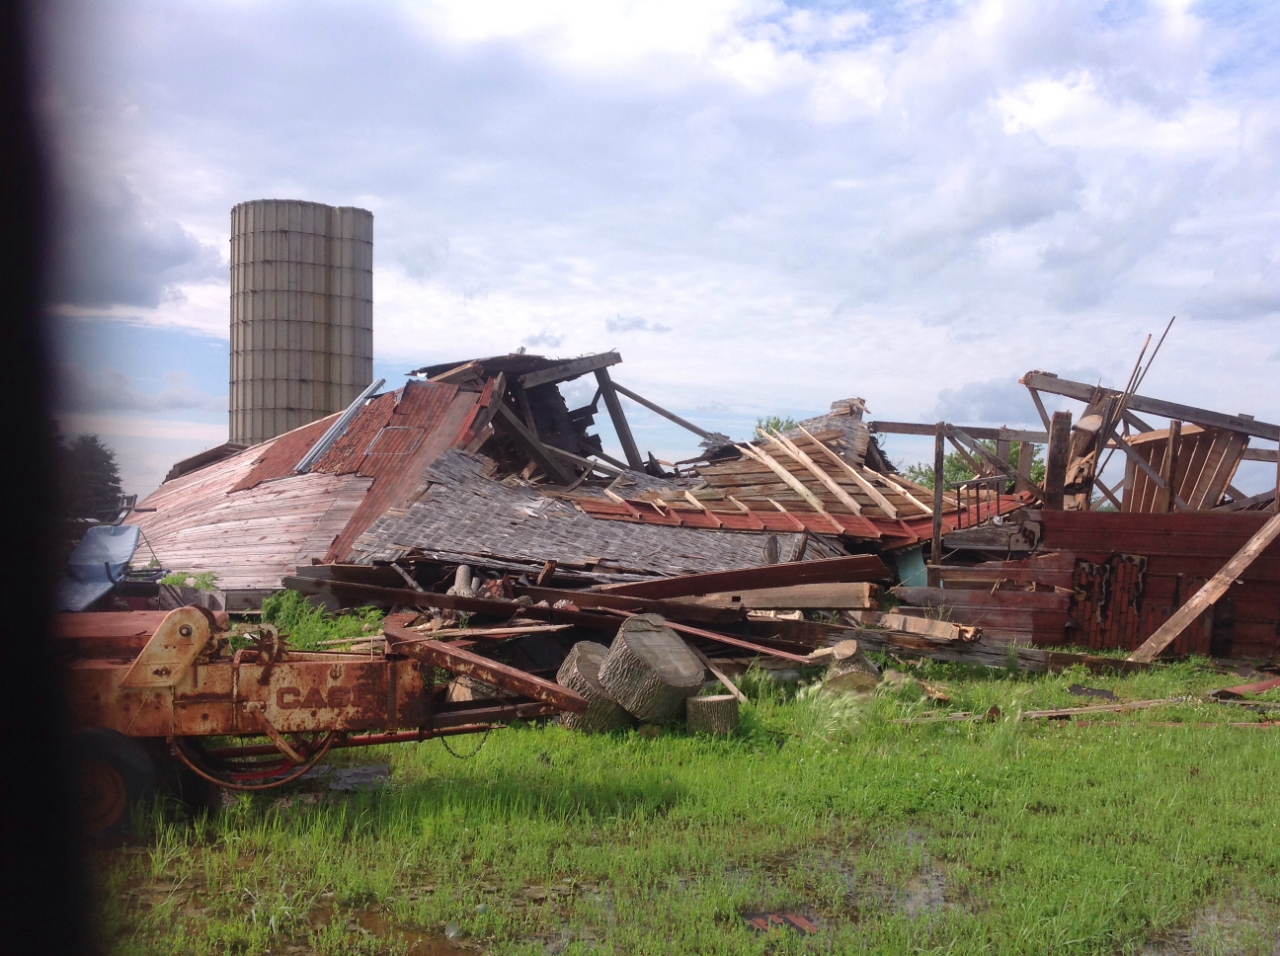
Summary: This tornado started near Colfax St. and tracked through the south side of Shelby, through DeMotte, and ended slightly east of N. 600W Rd. A large barn was completely destroyed, and damage was done to houses in both Shelby and DeMotte. In addition, numerous hardwood trees were snapped and uprooted. Maximum winds were estimated to 110 mph. |
20.) Lowell Area Tornado #6
|
(click on image to enlarge) |
|
Summary: This strong tornado touched down near the intersection of Clark St and Belshaw Rd and ended slightly east of Harrison St. Outbuildings as well as two large grain bins were destroyed, and numerous large high-tension wood power poles were snapped. There were also numerous trees snapped and uprooted along with crop damage. Maximum winds were estimated to 115 mph. |
21.) Lowell Area Tornado #7
|
(click on image to enlarge) |
|
Summary: This tornado began over a farmstead along Grant St and tracked due east ending near Mississippi St. A large barn was destroyed with the top half of the barn ripped off and the bottom half severely damaged. Numerous trees were snapped and uprooted. Maximum winds were estimated to 105 mph. |
22.) Stoutsburg/Wheatfield Area Tornado
|
(click on image to enlarge) |
|
Summary: This tornado occurred northwest of Wheatfield tracking near W. 1450N Rd. Damage was done to a large pole barn with the roof blown off and multiple walls collapsed. There were also numerous trees snapped and uprooted. Maximum winds were estimated to 105 mph. |
The Enhanced Fujita (EF) Scale classifies tornadoes into the following categories:
| EF0 Weak 65-85 mph |
EF1 Moderate 86-110 mph |
EF2 Significant 111-135 mph |
EF3 Severe 136-165 mph |
EF4 Extreme 166-200 mph |
EF5 Catastrophic 200+ mph |
 |
|||||
When a tornado is known to have occurred but does not cause damage to any qualified damage indicators, or if the only damage is located in an area that is inaccessible to NWS storm survey personnel, then a tornado may be assigned the EF-Unknown (EF-U) rating.
Straight-Line Winds
In addition to the 22 tornadoes that occurred across the NWS Chicago forecast area, including the numerous tornadoes in the Kankakee River Valley, corridors of damaging straight-line winds also occurred -- the most notable of which was also in the Kankakee River Valley. While most areas in these corridors experienced peak winds up to approximately 60 mph, a few isolated areas experienced damage consistent with peak wind gusts up to 80 mph.
|
|
Storm Reports
|
Map of Storm Reports from June 30, 2014 |
Click on the links below for a listing of quality-controlled storm reports from this event in the NWS Chicago forecast area:
(Boone, Cook, DeKalb, DuPage, Ford, Grundy, Iroquois, Kane, Kankakee, Kendall, Lake, La Salle, Lee, Livingston, McHenry, Ogle, Will, and Winnebago)
(Benton, Jasper, Lake, Newton, and Porter)
Photos
 |
 |
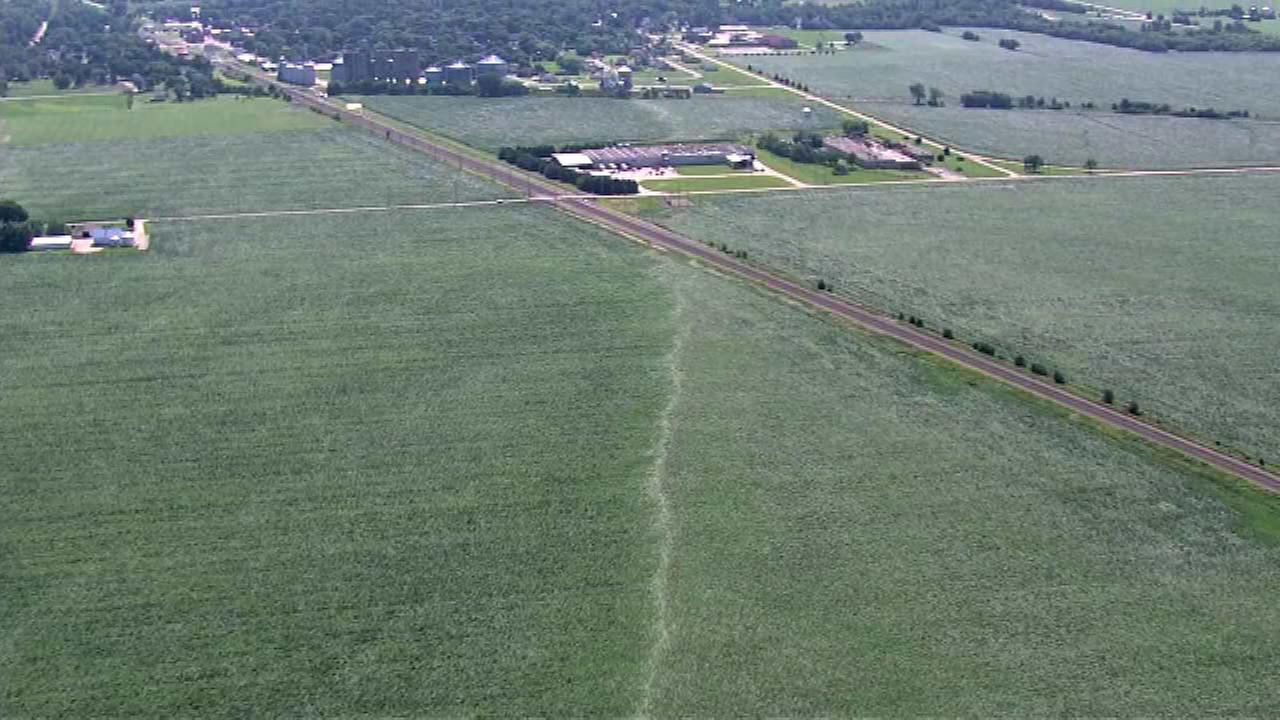 |
| Tornado damage in Earlville. Photo from NWS damage survey. | Tornado damage in Earlville. Photo from NWS damage survey. | A swirling pattern in corn fields near Earlville caused by a tornado. Aerial imagery courtesy of ABC 7 Chicago. |
 |
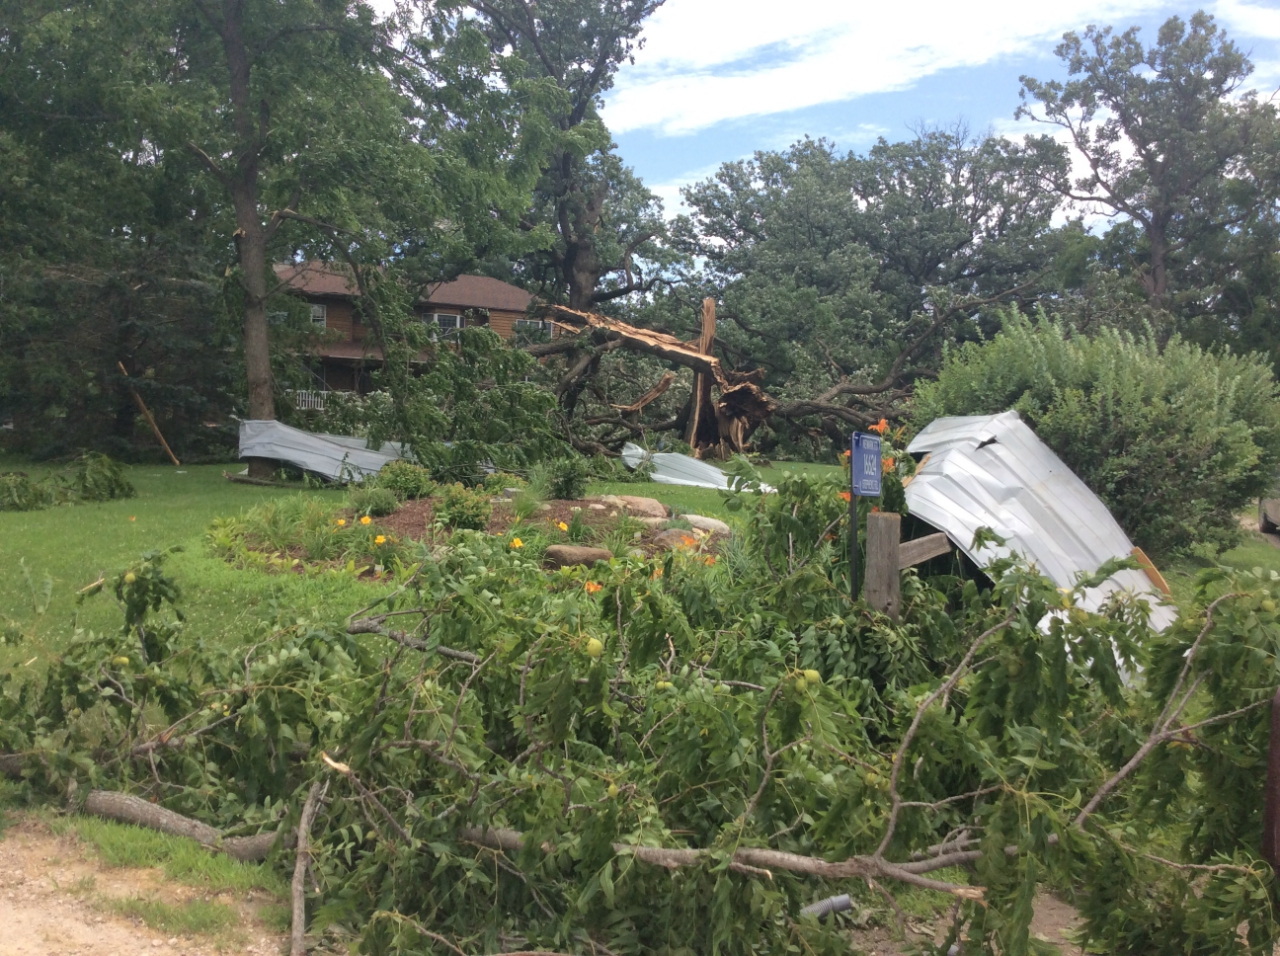 |
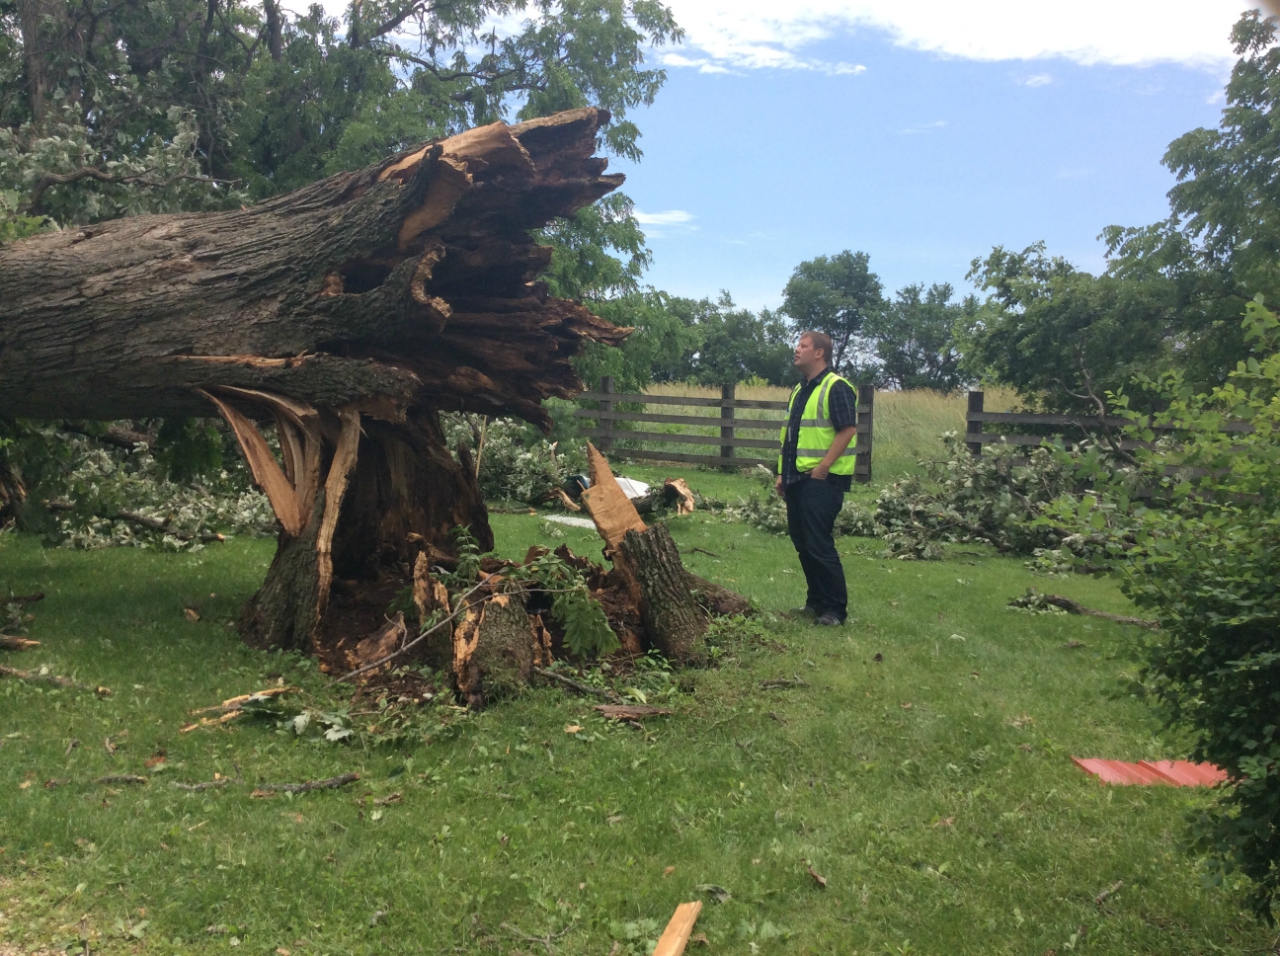 |
| A swirling pattern in corn fields near Earlville caused by a tornado. Aerial imagery courtesy of ABC 7 Chicago. | Tornado damage in southwest Kendall County. Photo from NWS damage survey. | Tornado damage in southwest Kendall County. Photo from NWS damage survey. |
 |
 |
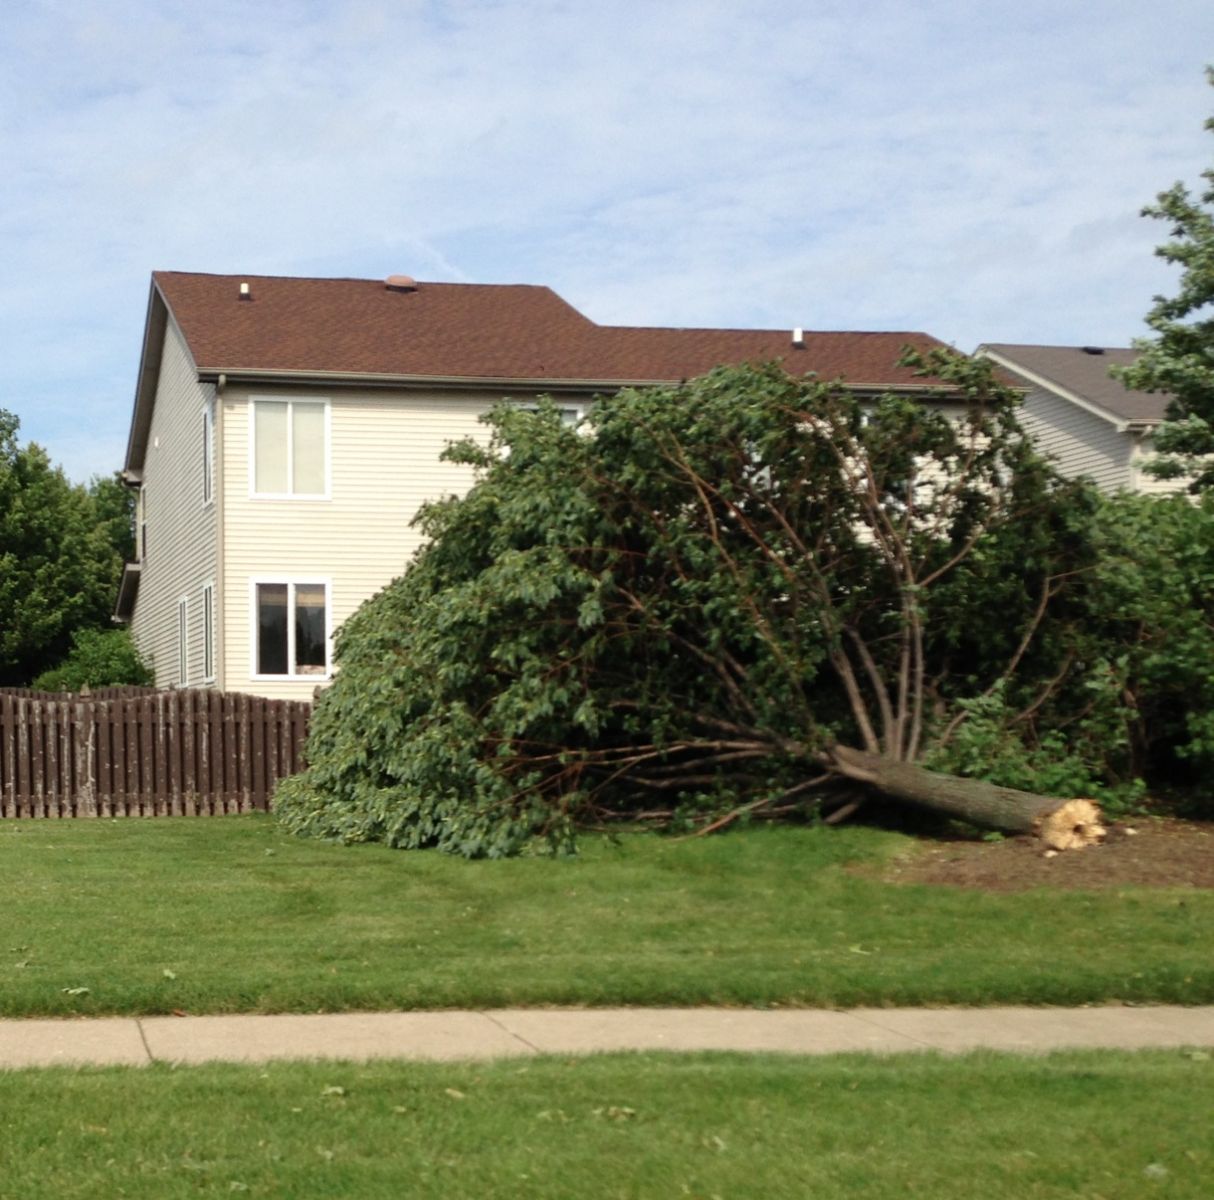 |
| Tornado damage in Plainfield. Photo from NWS damage survey. | Tornado damage in Plainfield. Photo from NWS damage survey. | Tornado damage in Plainfield. Photo from NWS damage survey. |
 |
 |
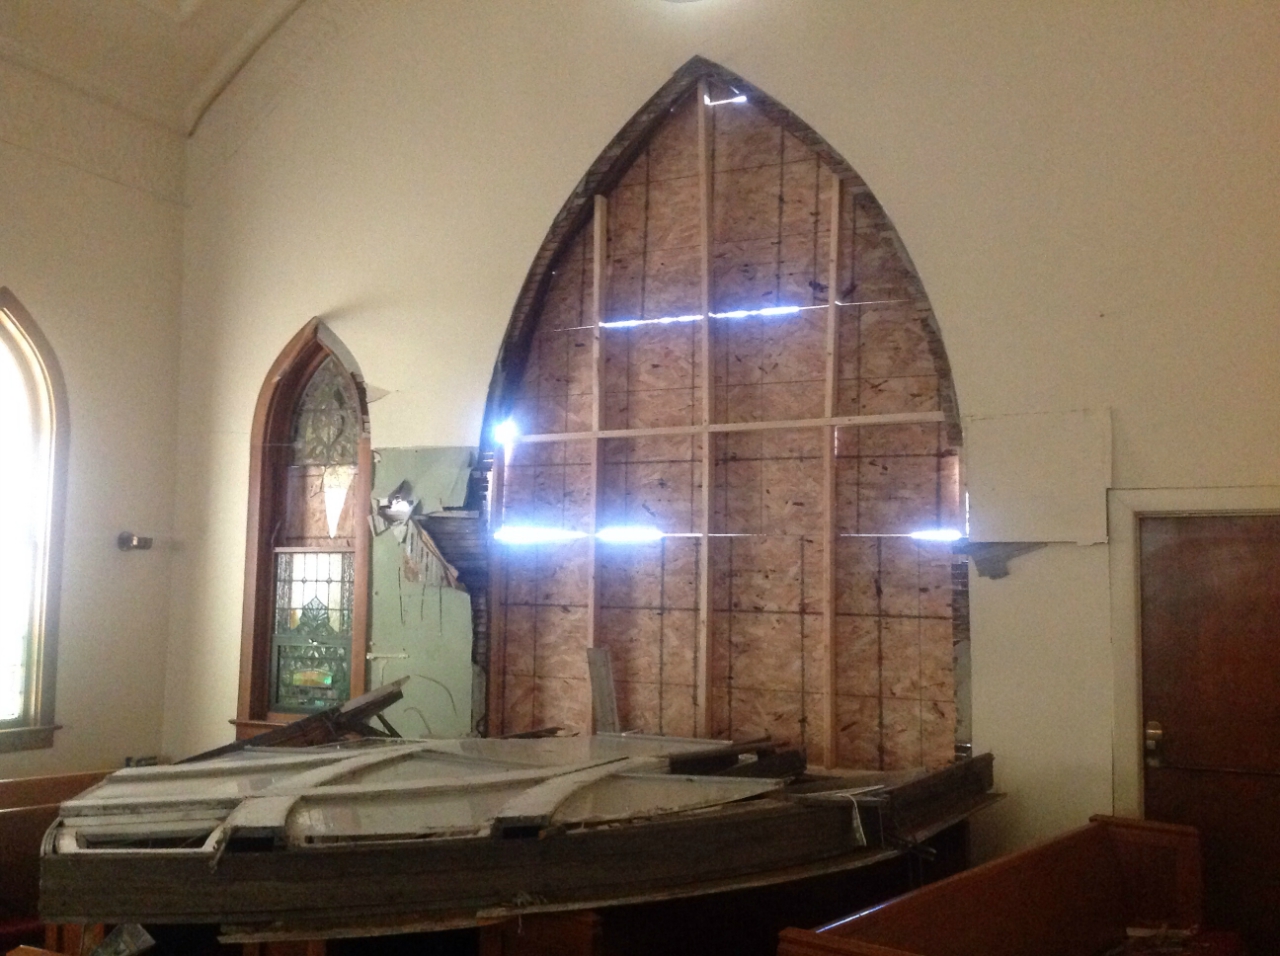 |
| Tornado damage near Grant Park. Photo from NWS damage survey. | Tornado damage near Grant Park. Photo from NWS damage survey. | Tornado damage near Grant Park. Photo from NWS damage survey. |
 |
 |
 |
| Tornado damage near Grant Park. Photo from NWS damage survey. | Tornado damage near Grant Park. Photo from NWS damage survey. | Tornado damage near Grant Park. Photo from NWS damage survey. |
 |
 |
.jpg) |
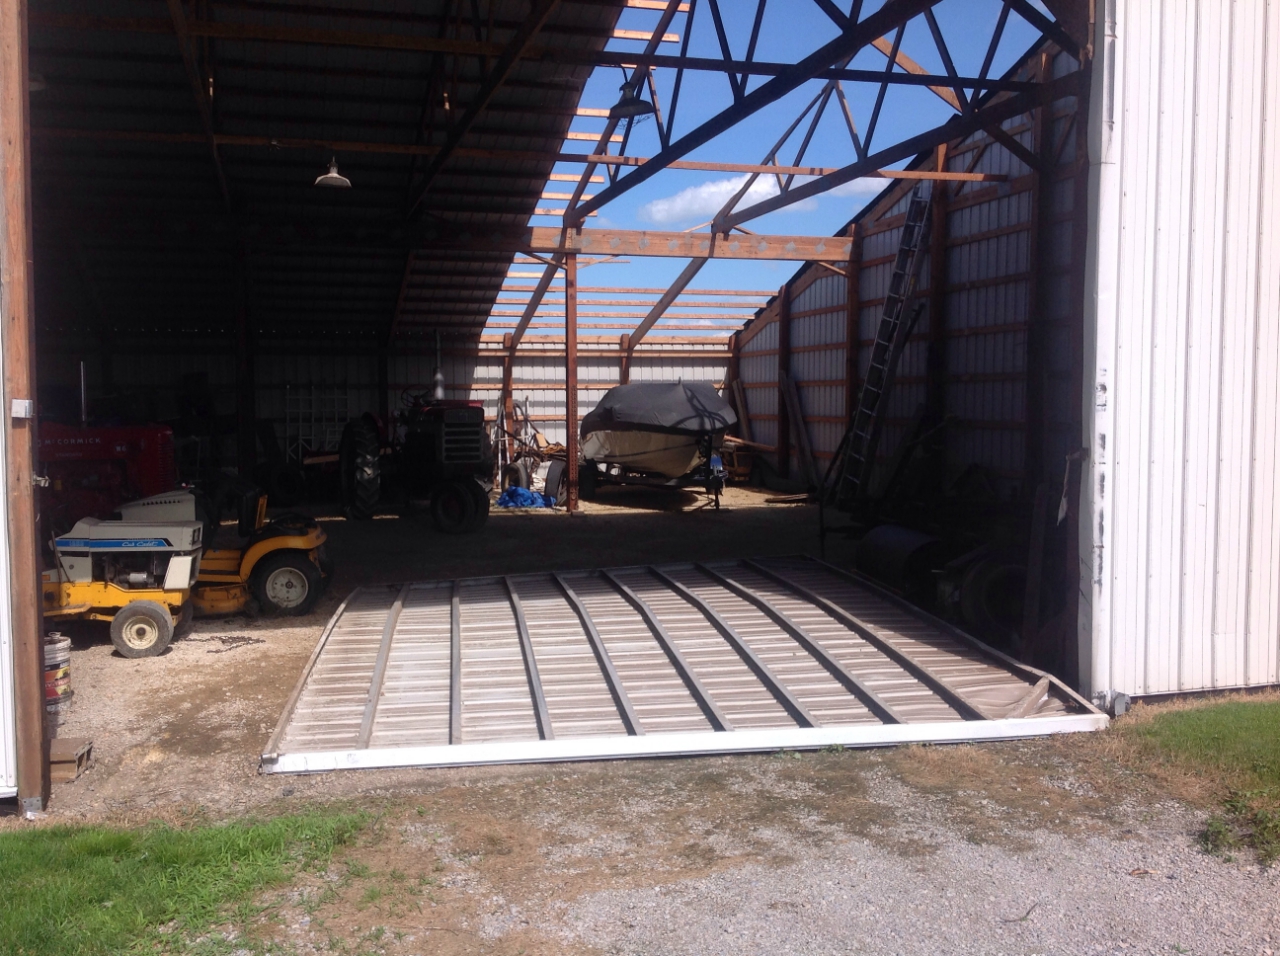
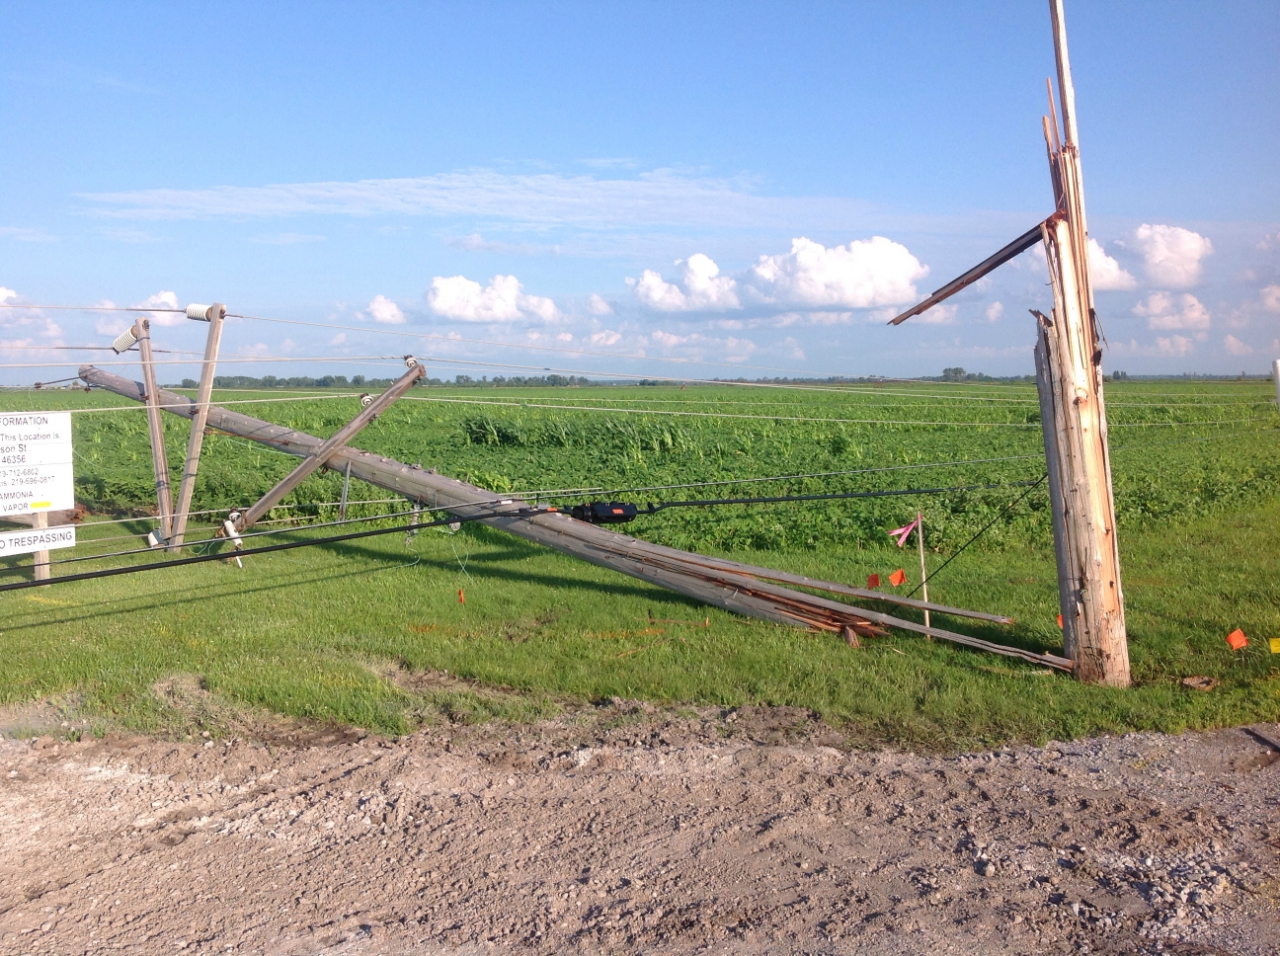
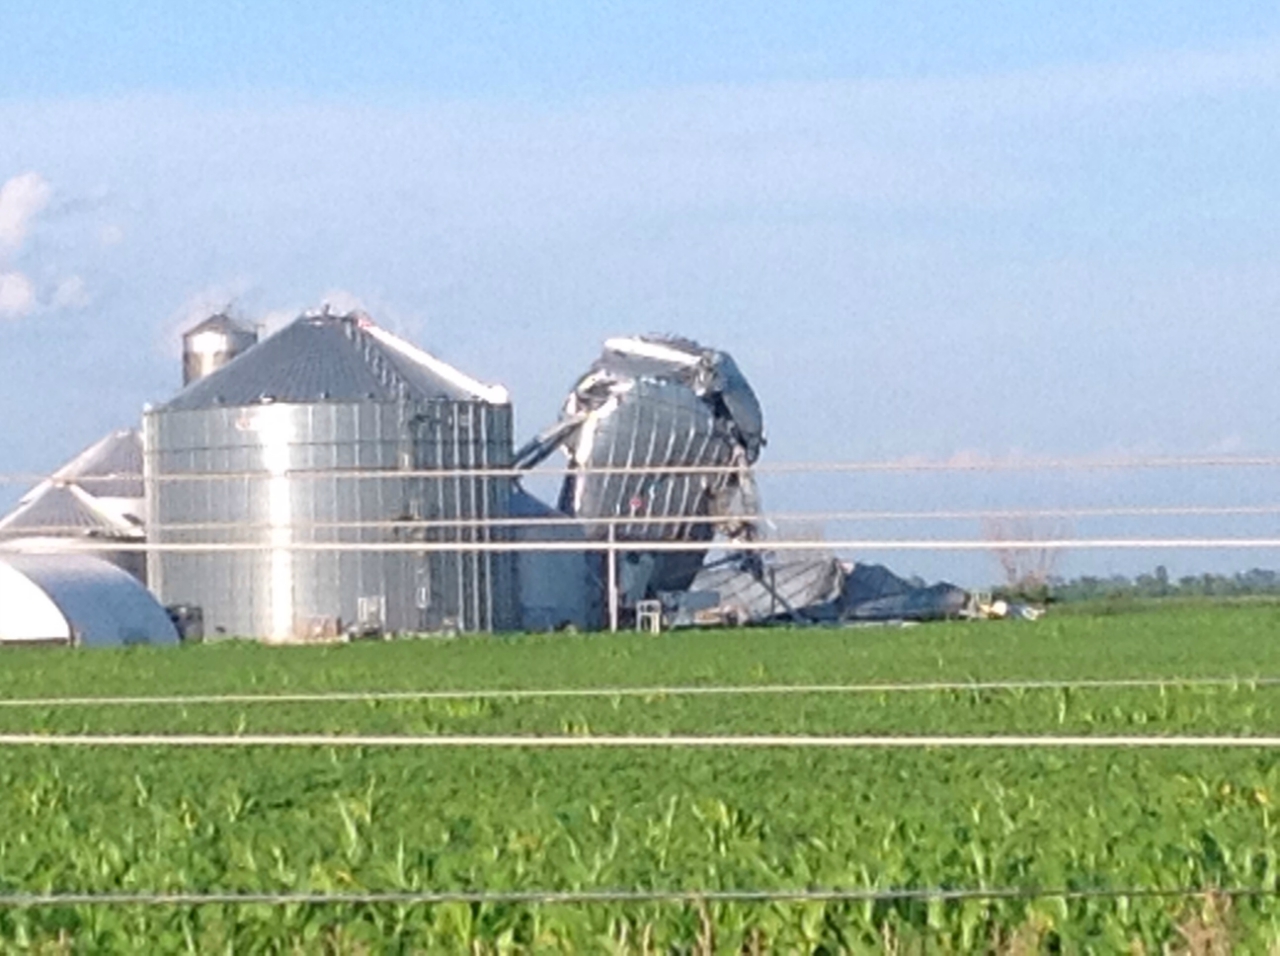
| Tornado damage near Grant Park. Photo from NWS damage survey. | Tornado damage near Grant Park. Photo from NWS damage survey. | Tornado damage near Lowell. Photo from NWS damage survey. |
 |
 |
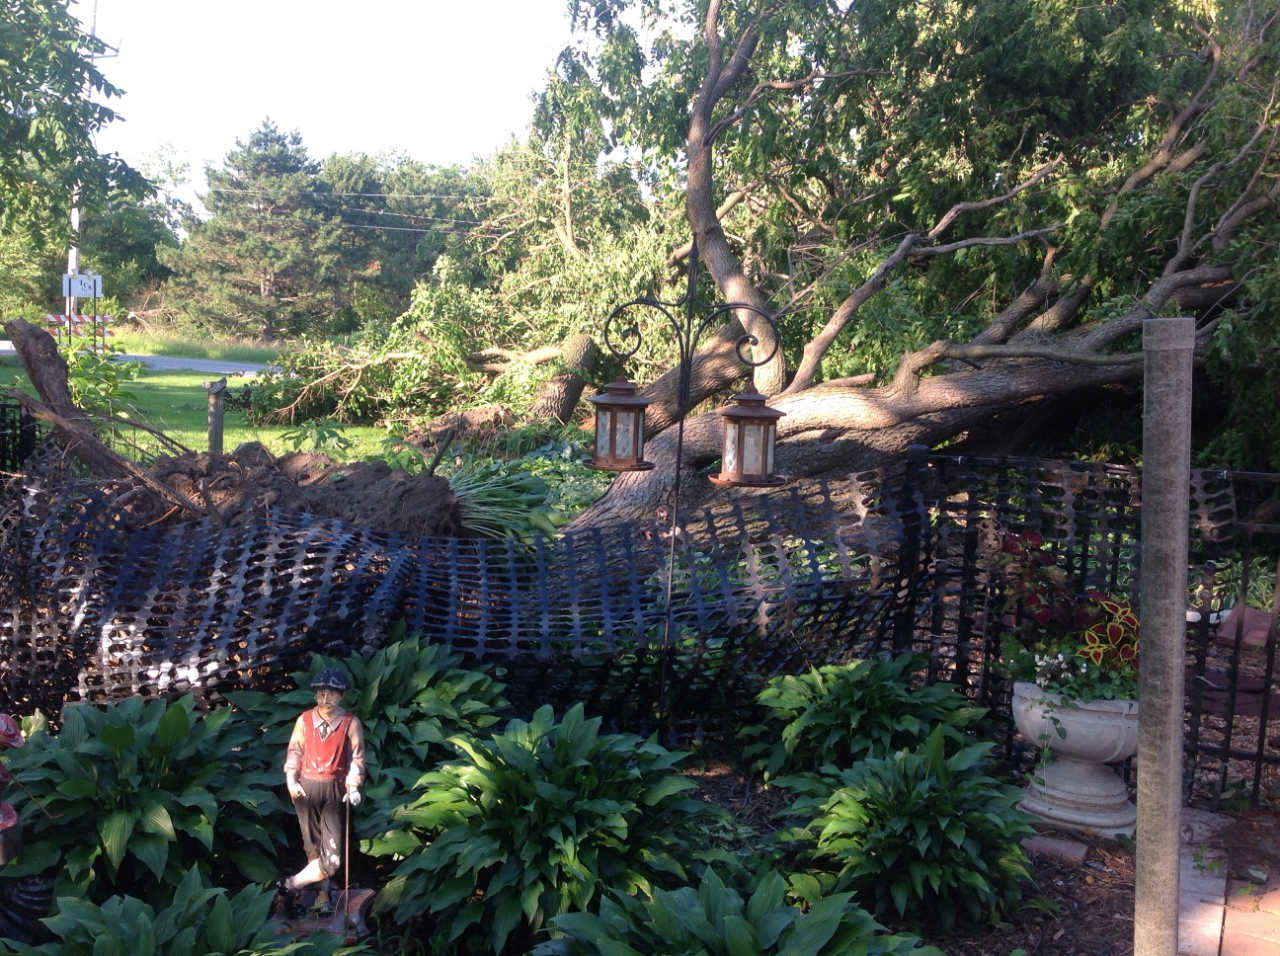 |
| Tornado damage near Lowell. Photo from NWS damage survey. | Tornado damage near Lowell. Photo from NWS damage survey. | Tornado damage near Lowell. Photo from NWS damage survey. |
.jpg) |
.jpg) |
.jpg) |
| Tornado damage near DeMotte. Photo from NWS damage survey. | Tornado damage in DeMotte. Photo from NWS damage survey. | Wind damage in Morris. Photo from NWS damage survey. |
Radar
|
Radar reflectivity loop from 6:30 PM to 11:30 PM CDT |
|
Radar imagery at the time of the Earlville tornado (Clockwise from top left to bottom left: Reflectivity (Z), Velocity (V), Storm-Relative Velocity (SRM), Correlation Coefficient (CC)) |
|
Radar imagery at the time of the Plainfield tornado (Clockwise from top left to bottom left: Reflectivity (Z), Velocity (V), Storm-Relative Velocity (SRM), Correlation Coefficient (CC)) |
|
Radar imagery at the time the derecho was producing tornadoes northwest of Momence and northwest of Grant Park (Clockwise from top left to bottom left: Reflectivity (Z), Velocity (V), Storm-Relative Velocity (SRM), Correlation Coefficient (CC)) |
|
Radar imagery at the time the derecho was producing tornadoes north of Momence and north of Grant Park (Clockwise from top left to bottom left: Reflectivity (Z), Velocity (V), Storm-Relative Velocity (SRM), Correlation Coefficient (CC)) |
|
Radar imagery at the time the derecho was producing tornadoes northeast of Grant Park (Clockwise from top left to bottom left: Reflectivity (Z), Velocity (V), Storm-Relative Velocity (SRM), Correlation Coefficient (CC)) |
Meteorology and Environment
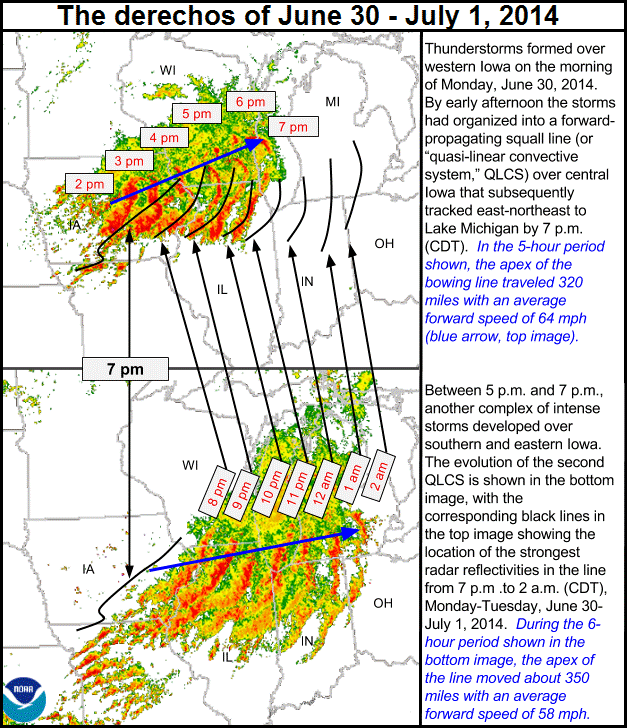
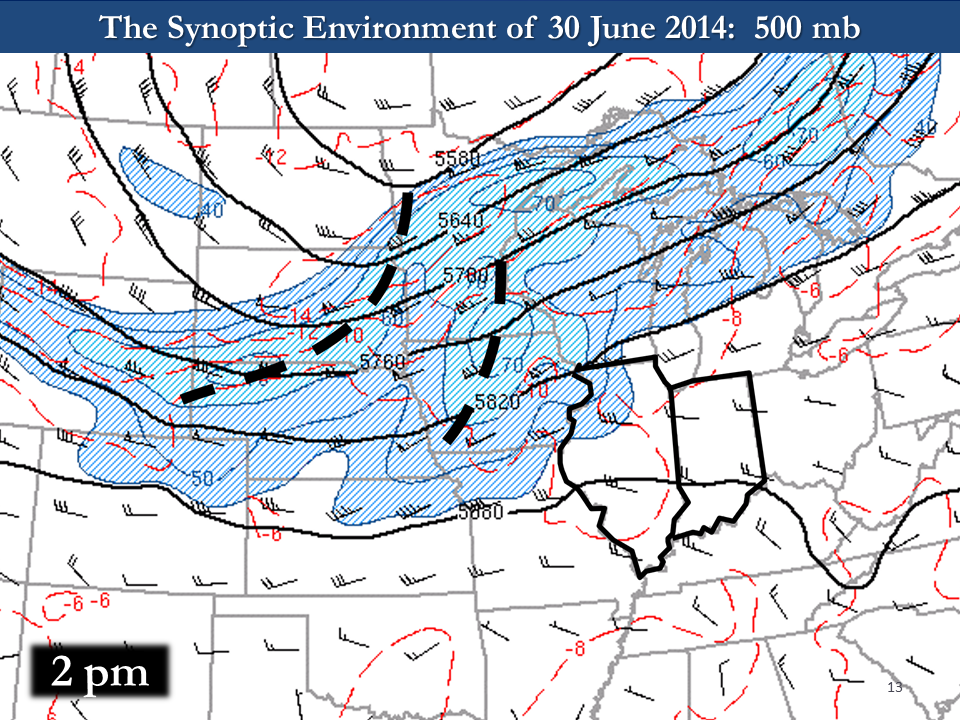
The severe weather event of June 30th, 2014 was quite unique. Two especially standout characteristics were that 1.) the event encompassed two separate derecho episodes in the Midwest, with one literally forming on the heels of its predecessor and 2.) the second derecho brought over two dozen embedded tornadoes to northern Illinois and northern Indiana.
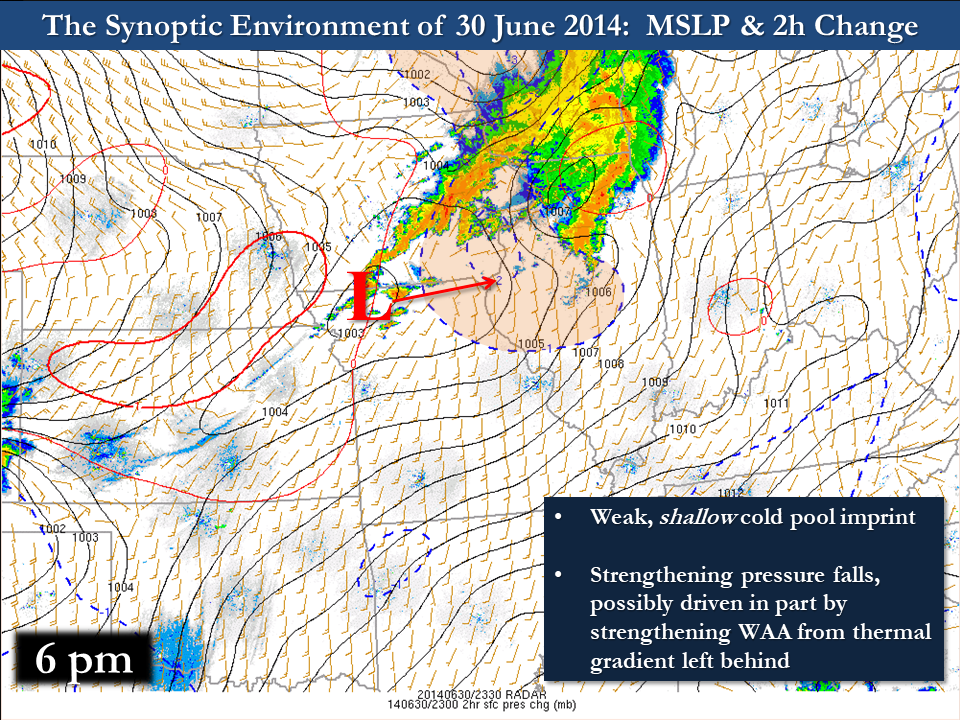
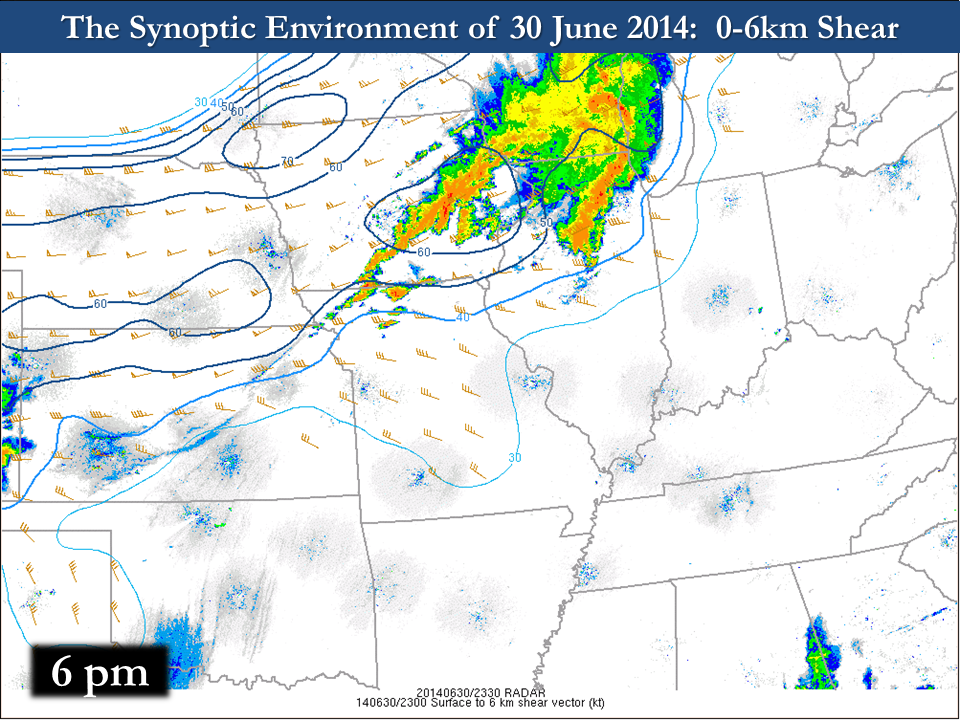
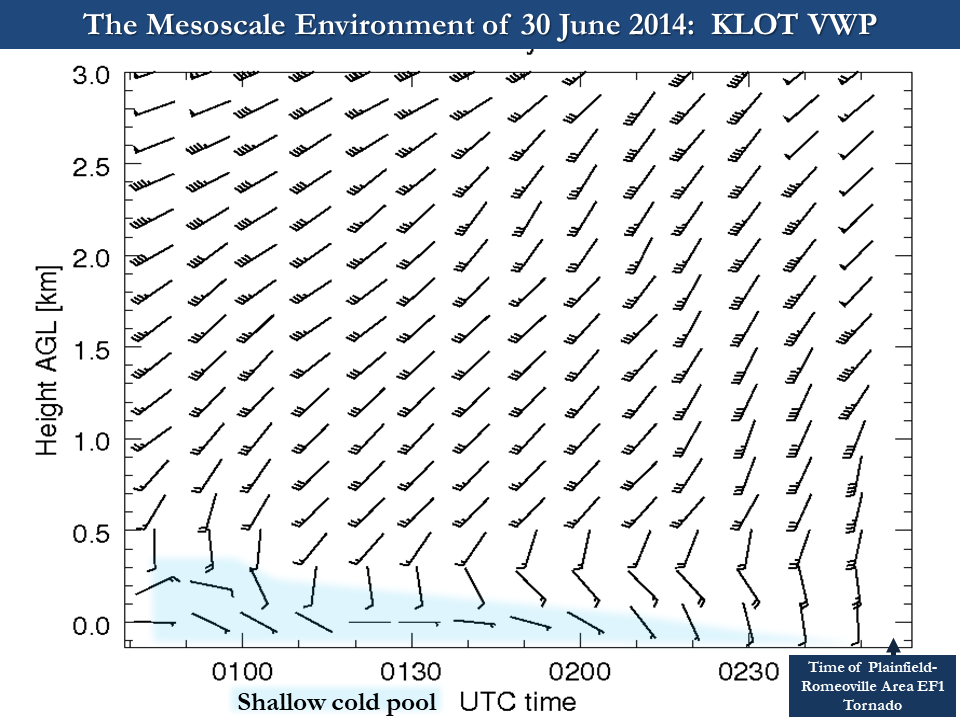
A complex of storms, even one not as potent as a derecho, often alters the environment for hours after in such a way that it is no longer conducive for thunderstorm redevelopment or intensification. This is because rain-cooled air limits convective lift, the low-level wind field is quite disrupted, and broad descent is often occurring in the atmospheric mid-levels (the opposite of what storms need). On June 30, 2014, the first complex of storms had little to no effect on the environment. In fact, it may have even slightly helped the environment for embedded tornadoes in Kankakee County and into northwest Indiana, as it placed an east-to-west boundary over that region. The southern portion of the first derecho began weakening in intensity as it moved across northeast Illinois into northwest Indiana, with the cooling of the atmosphere being very shallow. Thus, when the trailing well-organized complex of storms moved into that environment, its associated downdrafts (winds) could easily punch their way through that layer.
 |
 |
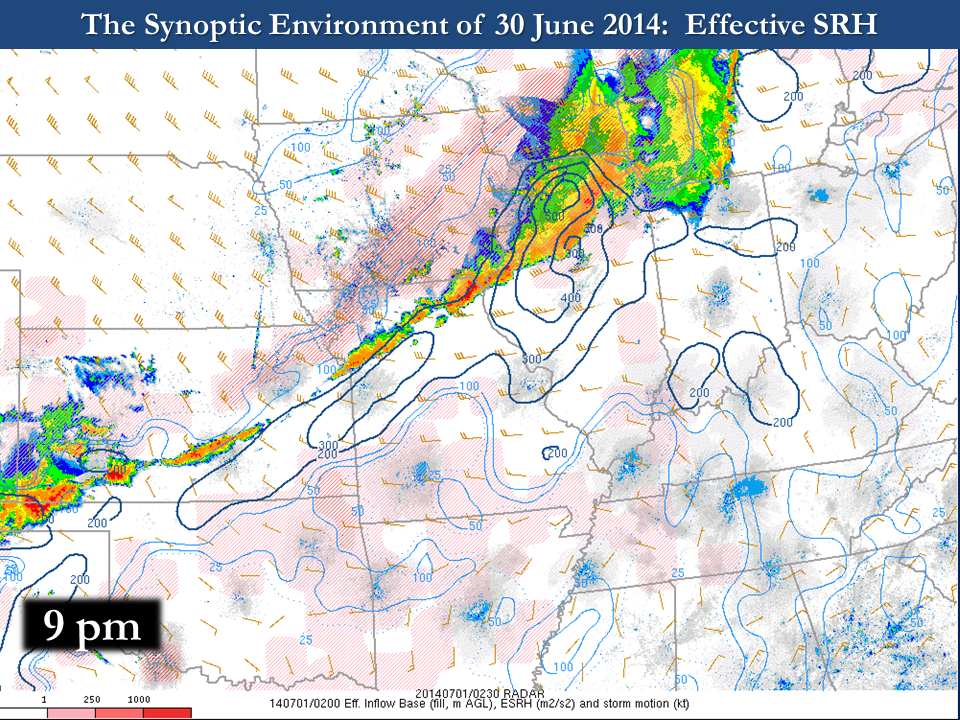 |
| Mean sea level pressure (and 2-hour pressure change) at 6 PM CDT | Wind shear in the 0-6 km layer at 6 PM CDT | Effective storm-relative helicity (SRH) at 9 PM CDT |
 |
 |
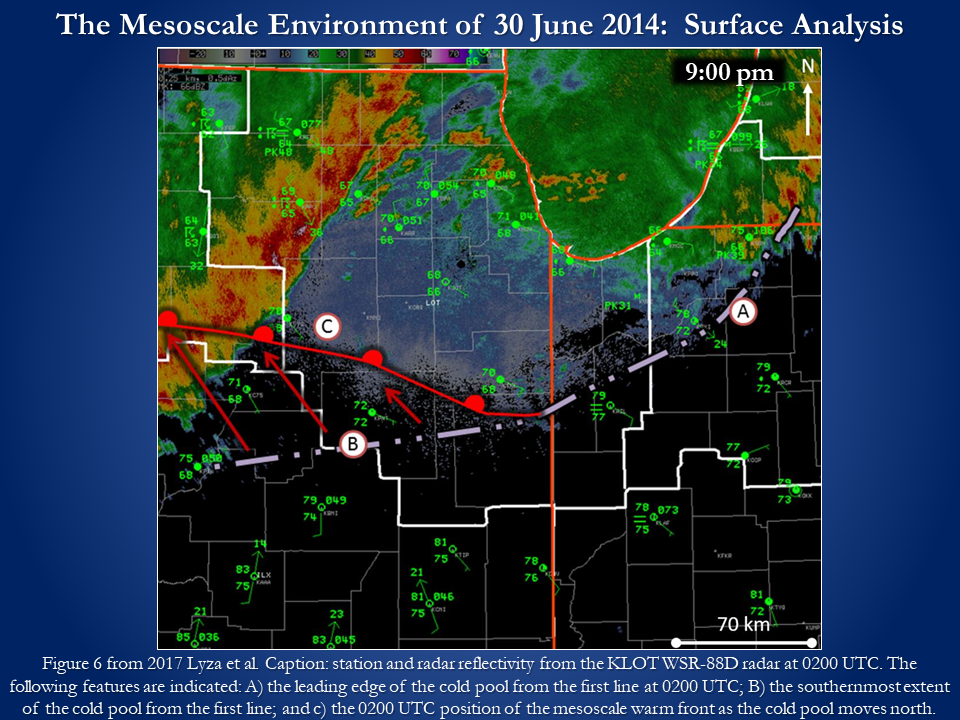 |
| 500 mb level analysis at 2 PM CDT showing two shortwave troughs in close proximity approaching Illinois and Indiana | Evolution of the vertical wind profile up to 3 km between 7 and 10 PM CDT as sampled by the KLOT radar. The depth of the shallow cold pool from the first line of storms is also overlaid, showing how it slowly diminished in the lead up to the Plainfield tornado. | Radar reflectivity and surface observations at 9 PM CDT. The location of the warm front and the leading edge of the cold pool from the first line of storms are also plotted. |
 |
||
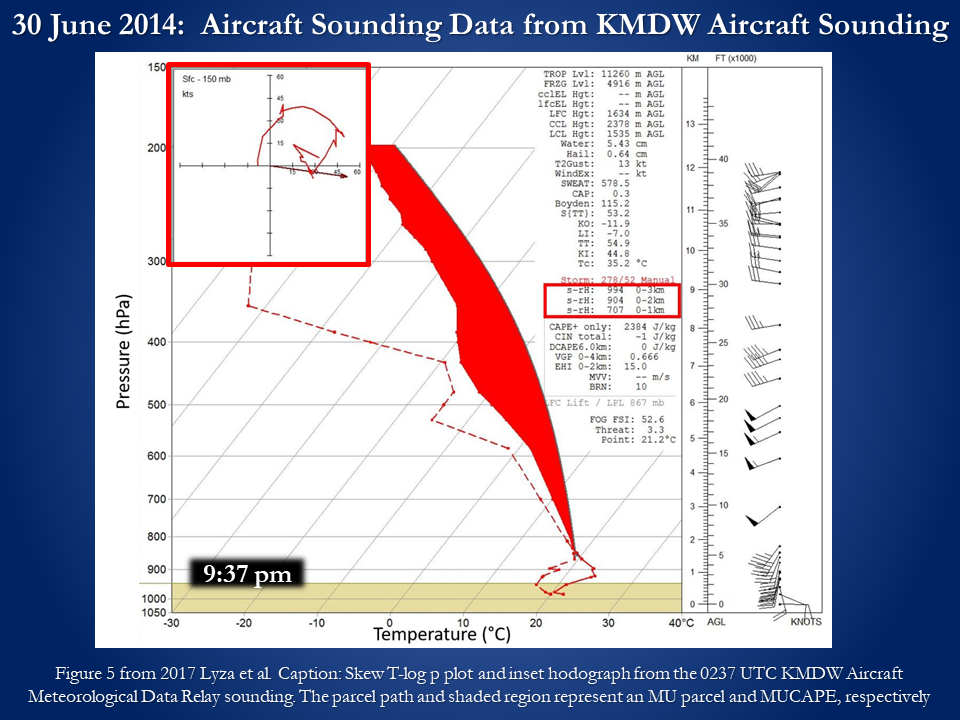
| An aircraft sounding from Midway Airport at 9:37 PM showing plenty of instability and a significant amount of low-level wind shear |
||
About Derechos
|
|
|
|
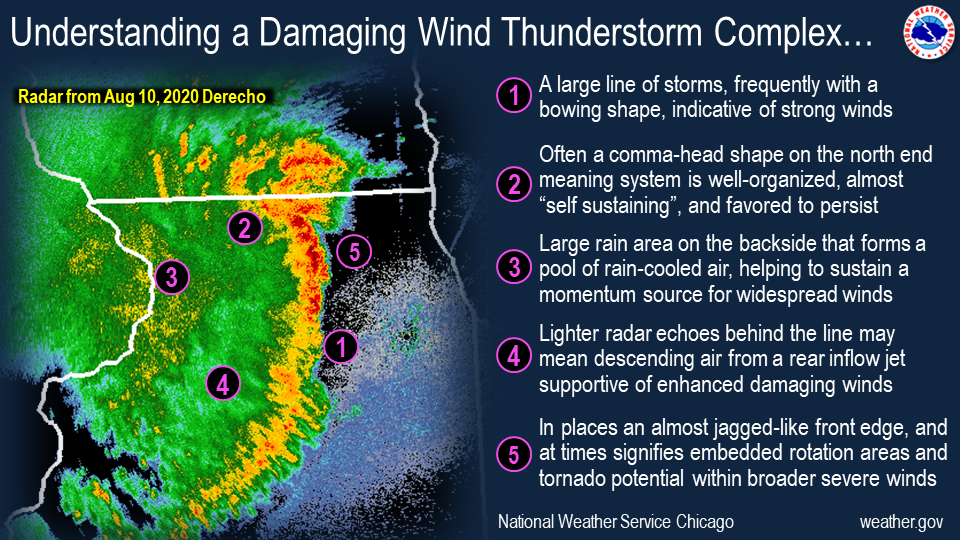 |
More information about derechos is available from the Storm Prediction Center.
Research
Over the past several decades, our understanding of the environments favorable for, and the mechanisms by which, tornadoes develop has drastically improved, allowing for a corresponding increase in our forecast and warning skill identifying tornadic thunderstorms. Generally speaking, we now understand that the key factors in determining whether or not a tornado will develop are related to the steadiness and strength of low-level updrafts, which themselves are related to key environmental parameters. By forecasting environments and parts of a storm that are supportive of steady and strong low-level updrafts, we can provide better warnings for life-threatening tornadoes.
The second of the two June 30, 2014 derechos was particularly efficient in the production of tornadoes. Many of these tornadoes occurred simultaneously and in close proximity to one another, which posed a significant challenge in both warning and ultimately surveying the eventual damage paths. As a result, the storms provided the opportunity for additional study using unique datasets and platforms to clarify the paths and potential formation mechanisms of each tornado. Over the course of several years, research teams led by Dr. Anthony Lyza (current affiliation: NOAA/OAR/National Severe Storms Laboratory) that included staff from NWS Chicago analyzed the circulations and damage paths to ultimately provide a more accurate assessment of the damaging derecho event. Two peer-reviewed studies that resulted from their work are provided below:
A Multi-Platform Reanalysis of the Kankakee Valley Tornado Cluster on 30 June 2014
Perhaps one of the most lasting findings from the studies on the June 30, 2014 derechos was a reinforcement in the idea that squall lines can be exceptionally prolific producers of tornadoes. Indeed, a single squall line can produce similar quantities and intensities of tornadoes to those that occur in tornado outbreaks driven primarily by supercells. Our local area is prone to tornadoes produced by both squall lines and supercells, and many of the most prolific tornado events that have occurred here in recent memory involved squall lines. Several notable examples are provided below (in reverse chronological order):
| Event Date/Name | # of Tornadoes in Local Area | Storm Mode | Max Tornado Intensity |
| July 28, 2023 Tornado Event | 13 | Squall Line | EF-1 |
| March 31, 2023 Tornado Outbreak | 22 | Squall Line and Supercells | EF-2 |
| June 20, 2021 Tornado Event | 4 | Squall Line | EF-3 |
| August 10, 2020 Derecho | 15 | Squall Line | EF-1 |
| June 30, 2014 Derechos | 22 | Squall Line | EF-1 |
| August 4, 2008 Derecho | 5 | Squall Line | EF-2 |
Additional information about squall lines and other types of thunderstorms can be found here.
Additional Information
Links:
 |
Media use of NWS Web News Stories is encouraged! Please acknowledge the NWS as the source of any news information accessed from this site. Additional recaps can be found on the NWS Chicago Past Events Page |
 |