National Weather Service United States Department of Commerce

Record Breaking August Gale Pummels Lake Michigan 


The storm system that affected Chicago and Lake Michigan Thursday into Friday was definitely one for the record books. This storm produced beneficial rainfall in some locations, with locally heavy rainfall totals along Lake Michigan due to lake effect/enhancement. The storm was also responsible for producing very rarely seen lake effect thunderstorms with nearly 60 cloud-to-ground lightning strikes detected in the Chicago area from these lake effect thunderstorms. Numerous waterspouts also occurred over Lake Michigan late Thursday into early Friday morning. Finally, the storm produced a prolonged period of very strong northerly winds making it one of the strongest August gales producing the highest waves ever recorded during the month of August (dating back to 1981) at the southern Lake Michigan mid lake buoy.
 
A couple days out model forecast guidance began to catch on to the idea that an unseasonably strong low pressure system would move north into the Great Lakes on Friday. This low intensified significantly on Friday and the following image is from Penn State University showing just how unusually strong this low pressure had become by early Friday morning. The areas in blue in purple show where the mean sea level pressure values (MSLP) were significantly below average, with areas in purple indicative of MSLP values more than 3 standard deviations below average, which means that 99% of the time MSLP values this time of year are higher than in this case.


sea level pressure deviation from normal

 
The rainfall with the storm was not distributed all that evenly across the area, with many areas west of Chicago picking up very light rainfall totals of less than 0.10”. More significant rain fell over northwest Indiana and along the lake in northeast Illinois. The following image shows accumulated rainfall from this storm system.


rainfall total map


A large part of the rain that fell over northwest Indiana and extreme northeast Illinois was a result of lake effect showers and thunderstorms. The following loop of hourly radar and lightning data from 10 pm Thursday evening through 6 am Friday morning shows the progression of the waves of lake effect showers and thunderstorms effecting the area.
 

radar loop of lake effect thunderstorms


The strong pressure gradient between the unseasonably strong low pressure over the Great Lakes and a strong high pressure moving into the northern plains resulted in a very rare August gale on Lake Michigan. Fairly continuous weather records for the southern Lake Michigan mid-lake buoy date back to 1981 and can offer some insight into just how unusual this storm was. Waves at the south buoy peaked at 13.5 ft late Friday afternoon which is the highest wave height ever recorded at the south buoy during the month of August. The previous record highest wave height for August was 11.8 ft back on August 4, 1994. In fact, there were 3 hourly observations at the south buoy on Thursday that broke the previous record highest wave height.
 
Astonishingly, there were 9 hourly observations (2 pm through 10 pm Friday) at the south buoy that had wave heights measured at 10 ft or greater. Prior to this event, dating back to 1981 there had only been 13 hourly observations total at the south buoy in August with wave heights of 10 ft or larger. So this one record breaking gale on the lake produced nearly as many hourly observations with 10+ ft waves at the south buoy as had been recorded in the past 30 years combined for August!
 
It’s worth noting that wave heights at the buoy are often lower than observations from ships. In fact, the ship M/V Burns Harbor reported waves of 18 ft nearby the south buoy at 7:00 PM on Friday, while at the same time the buoy was reporting 13 ft waves. Observations from the south shore of the lake near Indiana Dunes reported waves of up to 16 ft observed Friday afternoon, so while the buoy observations provide an excellent source of historical data for comparison, the wave heights recorded at the buoy in many cases are somewhat lower than those reported by ships and at the shore.
 
The following chart shows the observations of winds and wave heights at the southern Lake Michigan mid-lake buoy during the height of the storms.
 
Year
Month
Date
Hour
Wind Dir
Speed
Gust
Wave Hgt
 
(knots)
(knots)
(feet)
2012
8
10
1:00 AM
40
21
23
4.6
2012
8
10
2:00 AM
20
17
21
4.9
2012
8
10
3:00 AM
30
19
21
4.3
2012
8
10
4:00 AM
20
19
23
4.6
2012
8
10
5:00 AM
20
19
23
4.9
2012
8
10
6:00 AM
10
21
25
4.9
2012
8
10
7:00 AM
10
23
27
5.2
2012
8
10
8:00 AM
20
23
27
5.9
2012
8
10
9:00 AM
10
25
29
6.2
2012
8
10
10:00 AM
360
25
31
6.2
2012
8
10
11:00 AM
350
25
29
7.5
2012
8
10
12:00 PM
350
25
31
8.2
2012
8
10
1:00 PM
360
25
31
9.2
2012
8
10
2:00 PM
350
25
31
10.2
2012
8
10
3:00 PM
350
25
29
11.2
2012
8
10
4:00 PM
350
27
37
11.2
2012
8
10
5:00 PM
340
27
33
12.5
2012
8
10
6:00 PM
340
27
33
13.5
2012
8
10
7:00 PM
340
27
31
12.5
2012
8
10
8:00 PM
340
25
33
11.5
2012
8
10
9:00 PM
340
27
31
10.8
2012
8
10
10:00 PM
350
25
31
10.8
2012
8
10
11:00 PM
350
23
27
9.5
2012
8
10
12:00 AM
340
23
25
8.2
2012
8
11
1:00 AM
340
21
25
8.9
2012
8
11
2:00 AM
340
21
25
7.5
2012
8
11
3:00 AM
330
19
23
7.9
2012
8
11
4:00 AM
330
21
25
7.9
2012
8
11
5:00 AM
320
19
25
7.5
2012
8
11
6:00 AM
330
21
25
7.2
2012
8
11
7:00 AM
320
19
23
7.2
2012
8
11
8:00 AM
310
21
25
6.9
2012
8
11
9:00 AM
320
19
23
6.9
2012
8
11
10:00 AM
330
19
23
6.6
2012
8
11
11:00 AM
330
17
21
6.6
2012
8
11
12:00 PM
330
17
21
5.9
2012
8
11
1:00 PM
320
17
21
6.2


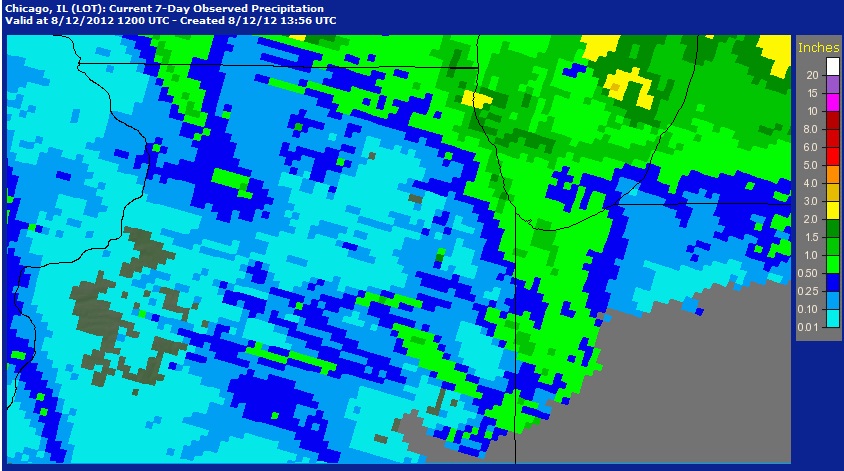
The chart above shows that there 12 hours with winds gusting over 30 knots with peak winds of 37 knots and peak waves of 13.5 ft. Looking back through the buoy data, it appears as though there have only been 3 other storms anywhere near as strong as this one in August. The last time a storm this powerful hit Lake Michigan in August was back on August 13-14, 1999. During this storm, winds peaked at 35 knots from the north with gusts at or above 30 knots for 8 hours. Wave heights during the August 1999 storm topped out at 11.6 ft. Another significant August storm was back on August 4-5, 1994, during which time waves peaked at 11.8 ft (previous record highest for August) and spent 5 hours above 10 ft. Unfortunately, during this storm wind information from the buoy was missing. Finally, back on August 11-12, 1983 another somewhat comparable August storm affected the lake with peak winds of 30 knot and only one hour of 30 knot or greater winds. During that storm waves peaked at 10.8 ft.


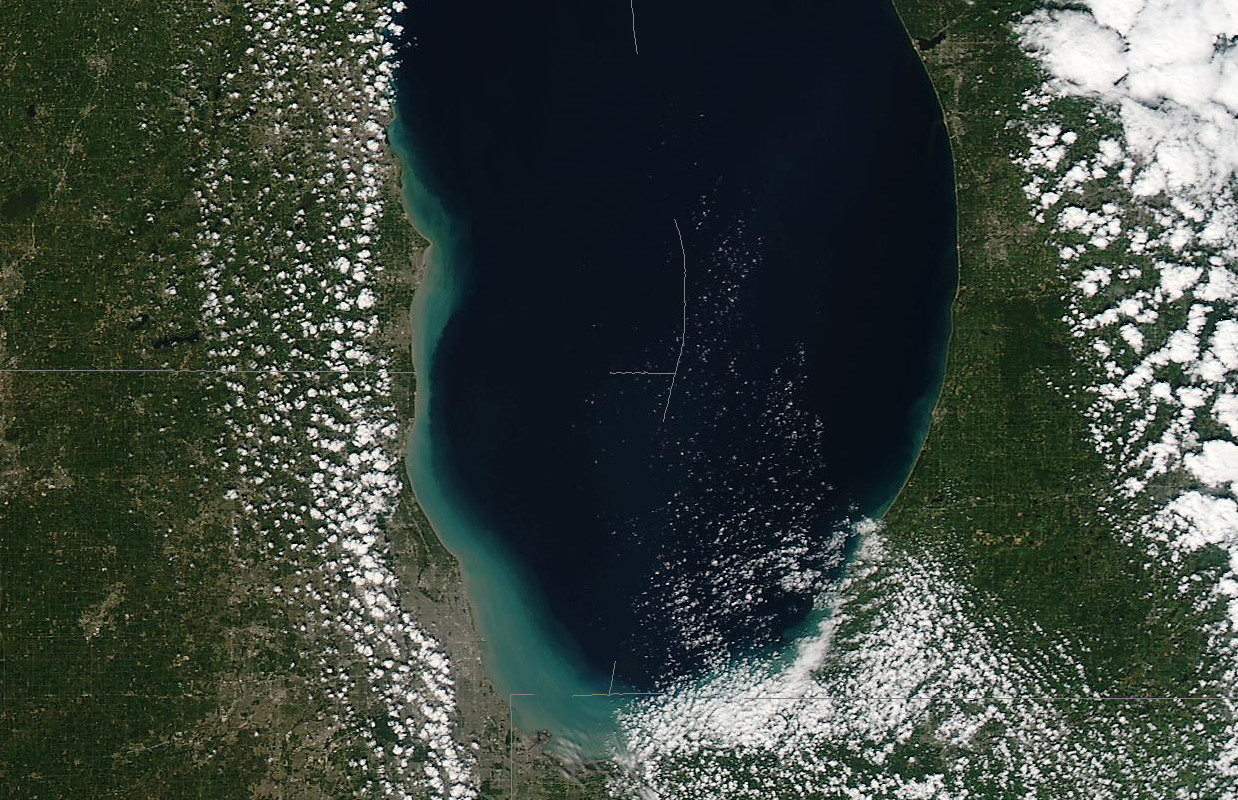
The strong north winds and large waves which occurred over Lake Michigan Thursday night and Friday caused a significant amount of sediment to be churned up and piled up over the southern end of the lake.  With generally clear skies on Saturday, visible satellite imagery reveals a noticeable discoloration of the water along the southern and western shores which is a result of sediment churned up by the high waves. The true-color, 250 meter resolution image below, comes from the Moderate Resolution Imaging Spectrometer (MODIS) aboard NASA's polar-orbiting Aqua satellite, and is made available by the Space Science and Engineering Center (SSEC) at the University of Wisconsin-Madison.


satellite showing sediment piled up along southern end of lake


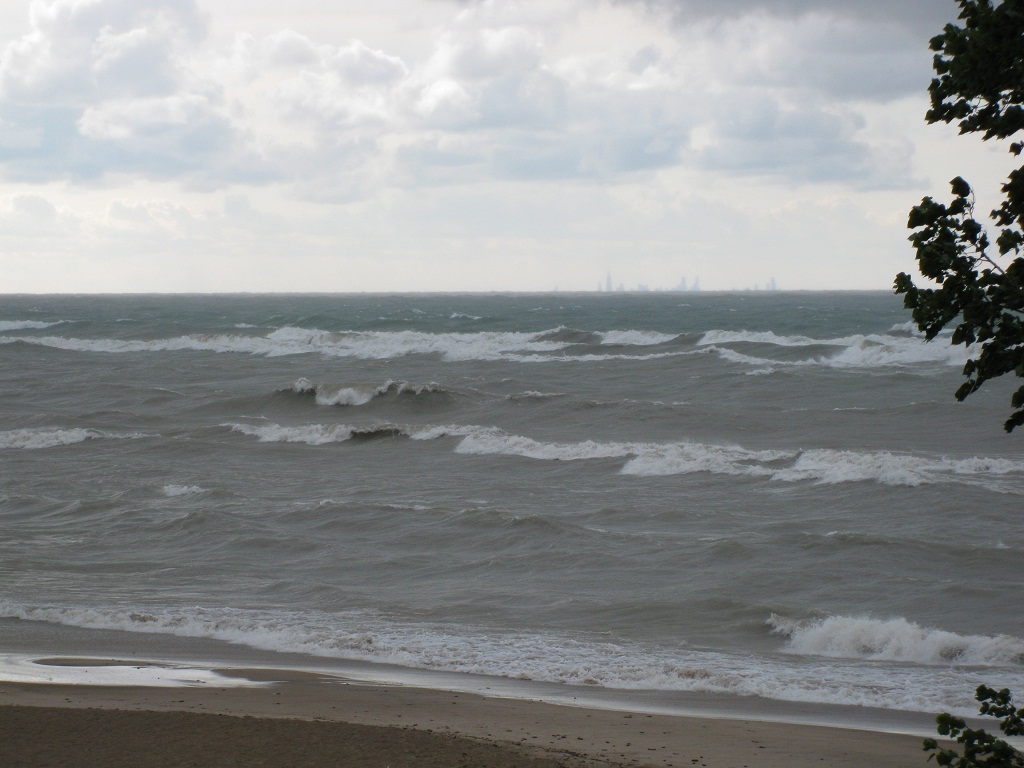
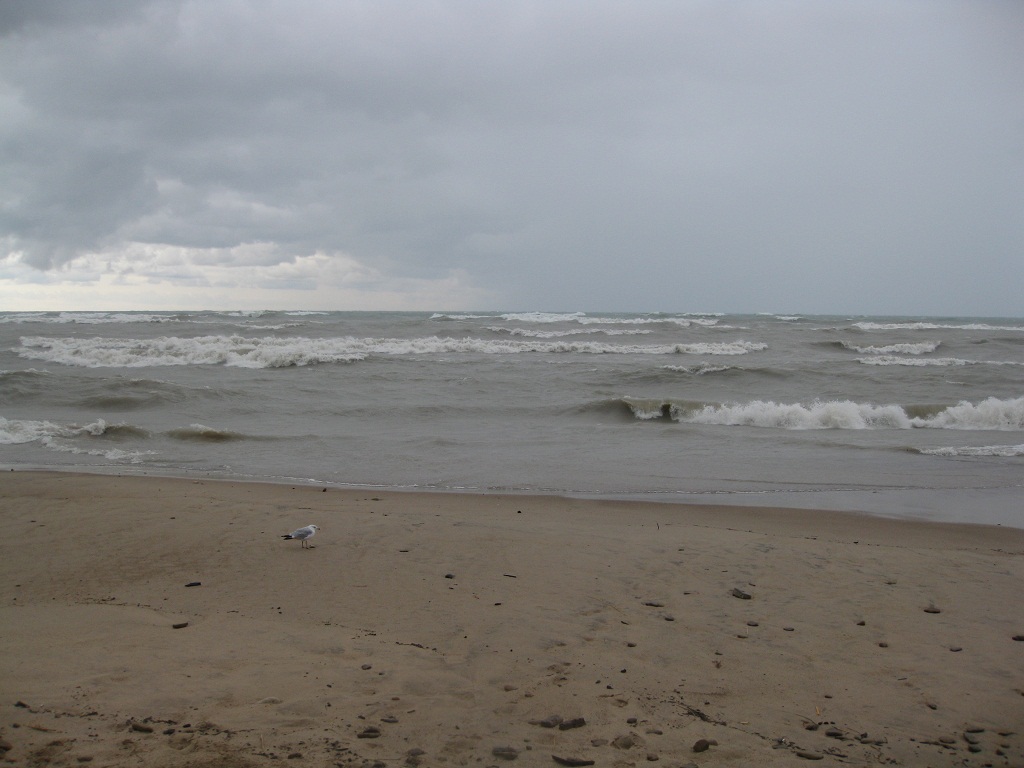
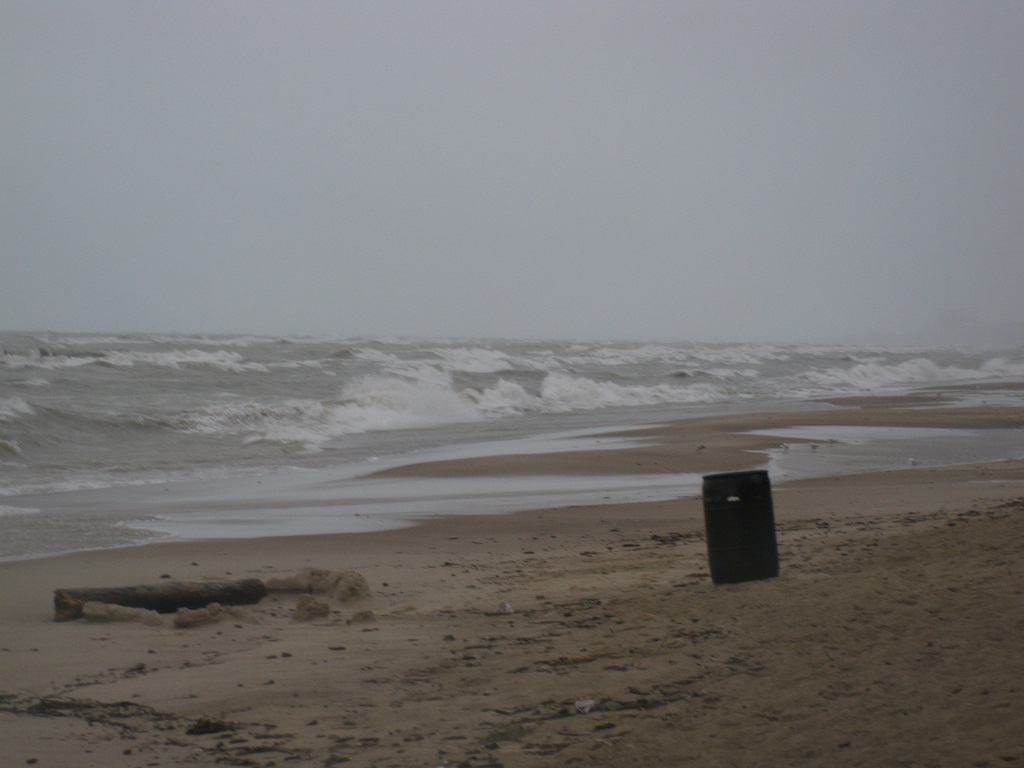
Below are some photos of the large waves at Beverly Shores, IN, taken by NWS Chicago meteorologist Mike Bardou early Friday (8/10) evening:


Large Waves at Beverly Shores, IN Friday 8/10/12


Large Waves at Beverly Shores, IN Friday 8/10/12


Large Waves at Beverly Shores, IN Friday 8/10/12