Overview of Large Scale Environment:
On the afternoon of June 21st, an area of surface low pressure was located over far southwest Minnesota (Figure 1). A warm front extended east from the low across southern Wisconsin and Lake Michigan, while an occluding cold front was pushing east across the Mississippi Valley. Northern Illinois and northwest Indiana were located within a broad warm sector southeast of the surface low, characterized by air temperatures in the mid and upper 80s and surface dew points in the lower 70s.
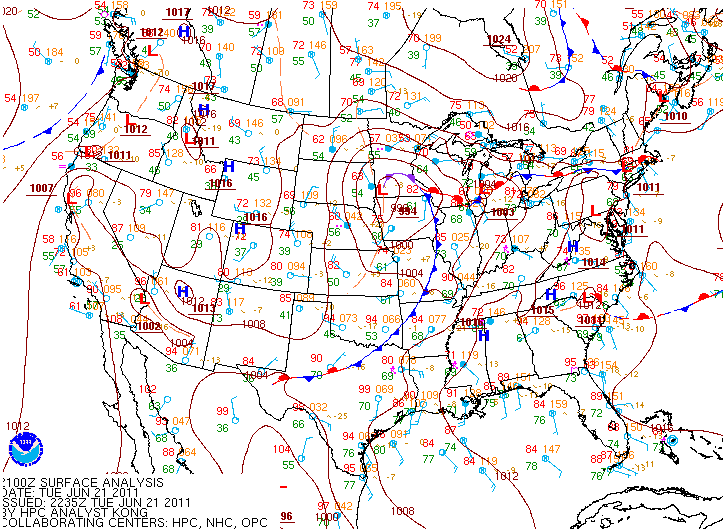
Figure 1: Surface weather map at 21Z (4 pm CDT).
Looking above the surface, the large scale upper air pattern across the region was dominated by an unseasonably deep upper trough and closed upper low centered north of Sioux City Iowa. A smaller scale mid-level short wave trough was noted moving northeast across Missouri, along with a 90 knot upper level jet streak which was over Illinois and southern Wisconsin. These features can be seen in the 00Z 500 mb (Figure 2) and 300 mb (Figure 3) analyses respectively. The approach of the mid level short wave trough would enhance large scale lift across Illinois during the evening hours, while increased wind speeds in both the mid and upper levels would supply deep layer vertical wind shear necessary for thunderstorm organization.
Figure 2: 00Z 500 mb analysis. Note subtle trough over Missouri, which was lifting northeast toward IL.

Figure 3: 00Z 300 mb analysis depicting deep upper low north of Sioux City IA, and the 90 kt jet streak over IL and WI.
Mesoscale Environment:

Figure 4: ILX 00Z sounding. Note the instability as indicated by MLCAPE values in excess of 4000 J/kg.
In addition to the instability, indicated by the calculated MLCAPE of 4177 J/kg, the ILX 00Z sounding also depicts a veering of the wind profile from the surface through about 500 mb (around 18,000 feet MSL) and moderately strong mid and upper level winds associated with the approach of the mid level short wave and upper jet streak. These conditions would suggest that damaging winds and large hail would be concerns with stronger storms which developed within this environment. However, while the turning of the winds was not highly pronounced in the low levels, computed values of 0-1 km helicity of 165 m2/s2 did suggest that the tornado potential was not zero, especially if low level winds were to back even more southeasterly in the close proximity to a strong thunderstorm updraft.
The Storm Prediction Center produces a number of graphics each hour for the purpose of monitoring the mesoscale environment with respect to thunderstorm initiation, evolution and mode. Two particular graphics from early Tuesday evening also hinted at the potential for tornado development over northeast Illinois. One such graphic displays the Energy Helicity Index, or EHI. The Energy Helicity Index combines cape (instability) and helicity (a measure of rotational shear) to delineate areas that may be more favorable for rotating thunderstorm updrafts and tornadoes. Figure 5 below depicts the EHI at 01Z (8 pm CDT) Tuesday evening, with values around or slightly above 2 over the Chicago metro area. Values above 2.5 tend to be more indicative of supercells with the potential for tornadoes.
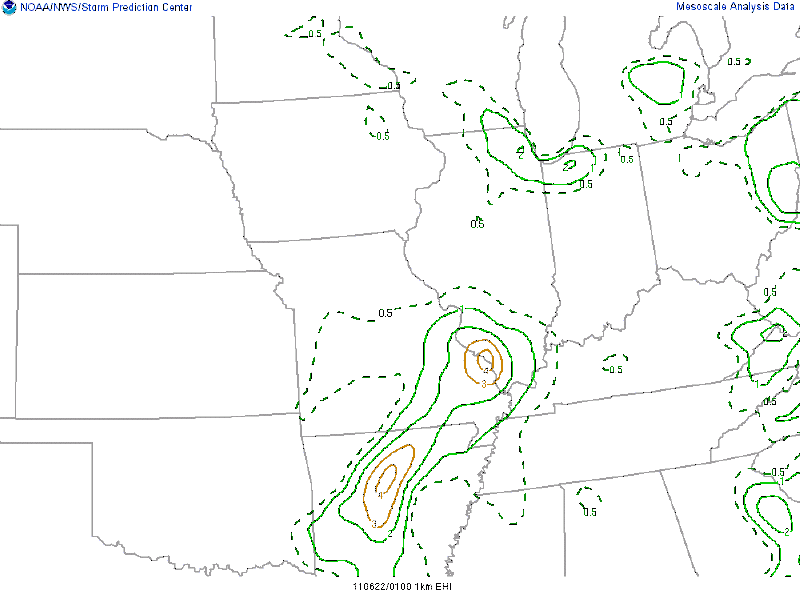
Figure 5: Energy Helicity Index at 01Z. Note values at or above 2 over northeast Illinois.
Another SPC mesoanalysis graphic displays the Significant Tornado Parameter. This index combines bulk shear, convective instability and inhibition, low level helicity and the height of the lifted condensation level (LCL). According to research conducted by the SPC, a majority of significant tornadoes (F2 or greater damage) have been associated with STP values greater than 1 within an hour of tornado occurrence, while most non-tornadic supercells have been associated with values less than 1 in a large sample of RUC model analysis proximity soundings. While not exceptionally high, Figure 6 below does depict an STP value of around 1 across northeast Illinois at 01Z (8 pm CDT) Tuesday. Both of these indices compliment the relatively strong low level helicity indicated by the ILX 00Z sounding, and lend environmental support for the tornado spin-ups which occurred with the otherwise linear thunderstorm segments which occurred on Tuesday evening.
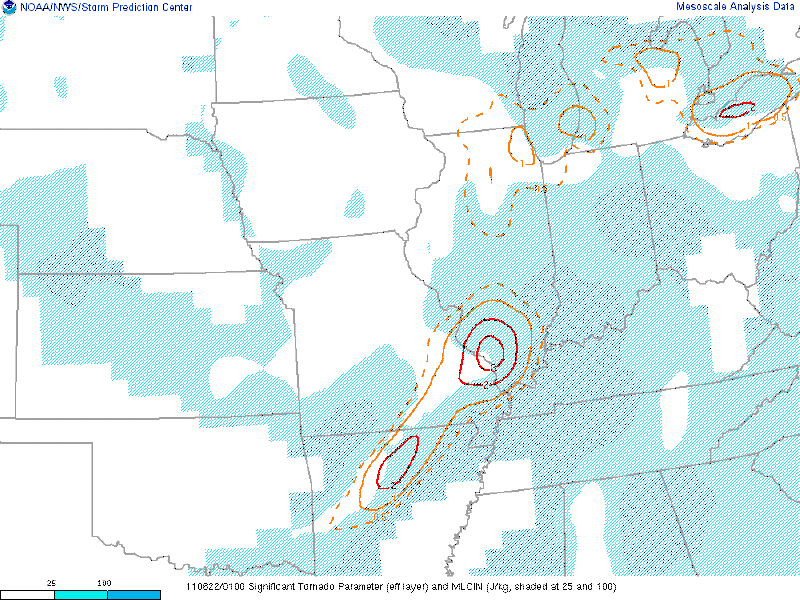
Figure 6: Significant Tornado Parameter at 01Z June 21st. Note values exceeding 1.0 over northeast IL.
By late afternoon, however, instability was reaching its peak across western Illinois, just downstream of the approaching mid-level short wave from Missouri. Objective analysis from the Storm Prediction Center’s Mesoanalysis website indicate MLCAPE values increasing to nearly 3000 J/Kg across portions of western and central Illinois by 21Z (4 pm CDT). Figure 7 shows the distribution of MLCAPE (instability) at this time.
Figure 7: SPC mesoanaylsis of MLCAPE at 21Z June 21st. Note axis of 2000-3000 J/kg across IL.
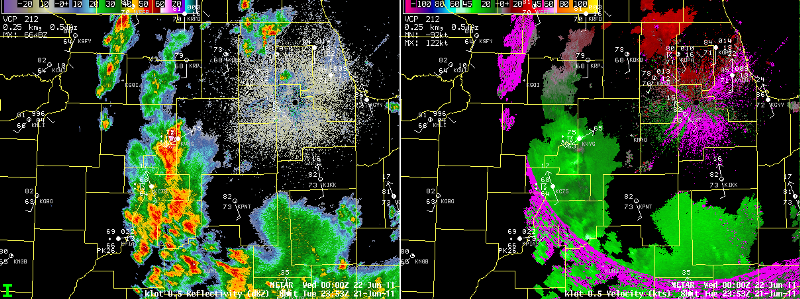
Over the next hour and a half, these thunderstorms continued to move northeast and intensify, with a particularly intense bowing line segment approaching western La Salle County by 7 pm CDT. Figure 9, shown below, depicts radar reflectivity on the left and base velocity on the right. Note the bulge in the line near Peru (KVYS), and the corresponding bright green in the velocity image which indicates strong inbound winds. The 2355Z observation from KVYS is plotted atop the radar data, indicating a 65 knot (75 mph) wind gust with the arrival of this line of severe thunderstorms!
Forty five minutes later, at 0043Z (743 pm CDT), this line of severe thunderstorms was over eastern La Salle county, moving northeast toward Kendall and Grundy counties. Figure 10 indicates that radar reflectivity and velocity data continued to infer a continued damaging wind threat, with the bright green colors on the velocity imagery representing inbound wind speeds (toward the KLOT WSR-88D in the upper right) in excess of 50 knots. Of additional interest, was an area of enhanced 50+ knot inbound velocities noted across Kankakee county south of the radar. These strong southerly winds were not associated with strong or deep convection, but appear to be related to an increase in the surface pressure gradient between high pressure over southeast Illinois associated with a dissipating area of thunderstorms, and strong pressure falls across far northern Illinois likely associated with the approaching mid level short wave and upper jet streak discussed earlier. Also of importance, is the presence of backed surface winds across portions of northeast Illinois ahead of the thunderstorms. While subtle, the shift from a south to a south-southeast wind increases the low level shear in the near storm environment and may make the environment more conducive to tornado development.
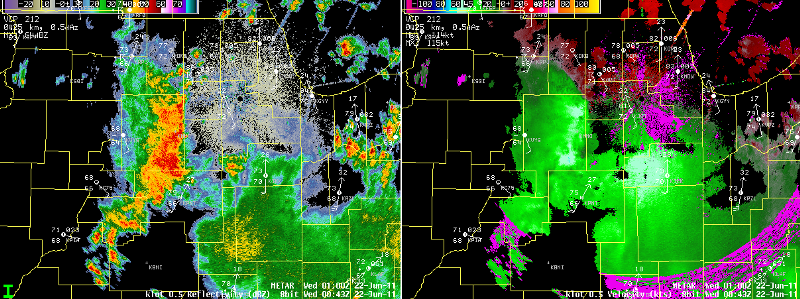
Figure 10: Radar at 0043Z. Note severe storms over eastern La Salle county, and strong inbound velocities over Kankakee county, south of the radar.
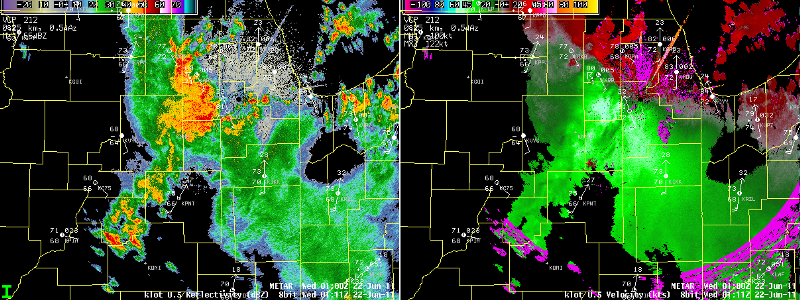
Figure 11: Severe thunderstorms moving into southwest Chicago suburbs at 0111Z, with new convection developing along nose of stronger southerly winds across Will and southern Cook counties.

Figure 12: Two velocity “couplets” indicating areas of small scale rotation along the leading edge of the line of severe thunderstorms at 0053Z Tuesday June 21st. Location is between Hinckley and Plano Illinois.
Where the newly developing convective cells intersected the pre-existing line of severe thunderstorms over far northwest Will county, a stronger and longer lasting low level circulation developed that would track across portions of the western and northern suburban areas of the Chicago area. Figure 13 shows the low level reflectivity and velocity structure at 0134Z (834 pm CDT) as seen on the NWS Chicago/Romeoville WSR-88D, which is located just beyond the lower left edge of the image. While not immediately evident, the velocity image within the white circle indicates a weakness (30 knots) and a maximum outbound (80 knots) which depict the circulation which produced the brief tornado in Downers Grove. In the reflectivity image, note the small “eye” or bounded echo region which corresponds to the strong circulation. This circulation developed over far northwest Will county, moving northeast across parts of the the Naperville, Bolingbrook and Woodridge areas before producing the tornado just east of I-355 in Downers Grove.
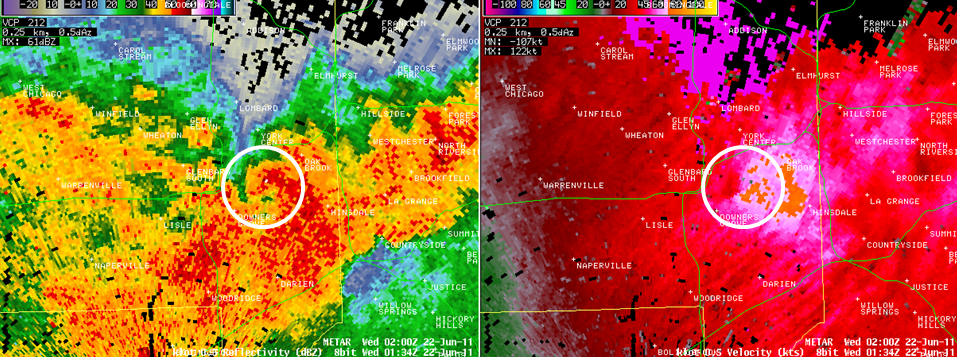
Figure 13: KLOT Radar at 0134Z, approximately at the time of the Downers Grove tornado.
The Midway Airport Terminal Doppler Radar, located southeast of the circulation, captured a more classic view of the velocity couplet, as seen in the 0132Z image in Figure 14 below.
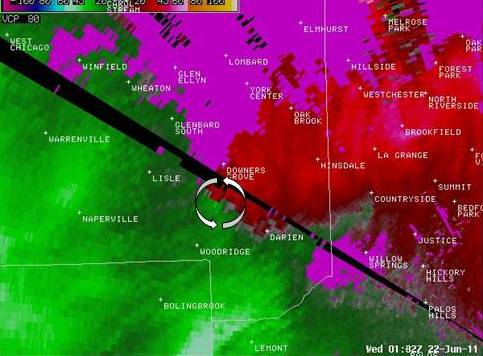
Figure 14: Circulation associated with Downers Grove tornado as seen by the TMDW at 0132Z.
The circulation depicted in Figures 13 and 14 remained discernable as it tracked off to the north-northeast along roughly a Downers Grove-Elmhurst-Elk Grove Village-Mount Prospect line through approximately 0150Z. It was along this path that the most significant wind damage occurred, and where NWS damage surveys confirmed two EF-1 tornadoes occurred in Downers Grove and Mount Prospect. The circulation passed just to the west of both O’Hare International Airport and Chicago Executive Airport, which measured wind gusts to 70 mph and 81 mph respectively. The line of severe storms, and the pocket of strongest damaging winds, continued to cross southeast and eastern Lake county Illinois before pushing out over Lake Michigan by approximately 0220Z (920 pm CDT).
Storm Survey Results:
Three survey teams from the National Weather Service examined damage from these storms on Wednesday June 22. Widespread wind damage was noted with winds 60-80 mph in many parts of the west, northwest and north suburbs. Two tornado EF-1 tornadoes were confirmed in Downers Grove and Mount Prospect. Follow this link to information on these tornadoes: https://www.weather.gov/lot/2011Jun21_tornado
M. Ratzer 6/23/11

