Heat expands across the Desert Southwest, Plains, Mississippi Valley and Midwest into Monday. Fire weather concerns continue for portions of the Intermountain West. Active monsoonal moisture fuels thunderstorms over the Southwest with possible flash flooding. Tropical cyclone Fausto in the Pacific, should weaken as it approaches Hawaii; Dangerous surf, swells and rip currents are expected. Read More >
Downers Grove Tornado
| Intensity Rating | EF-1 |
| Estimated Max Winds | 90-100 mph |
| Tornado Began | 8:31 PM |
| Tornado Lifted | 8:33 PM |
| Path Length | ~2.1 miles |
| Maximum Width | 200 yards |
Figure 1: Map showing path of Downers Grove Tornado.
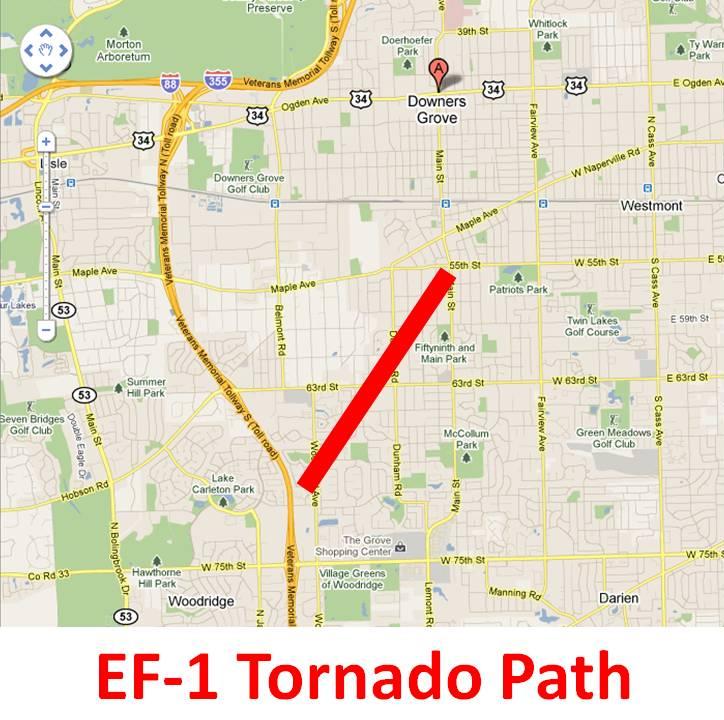
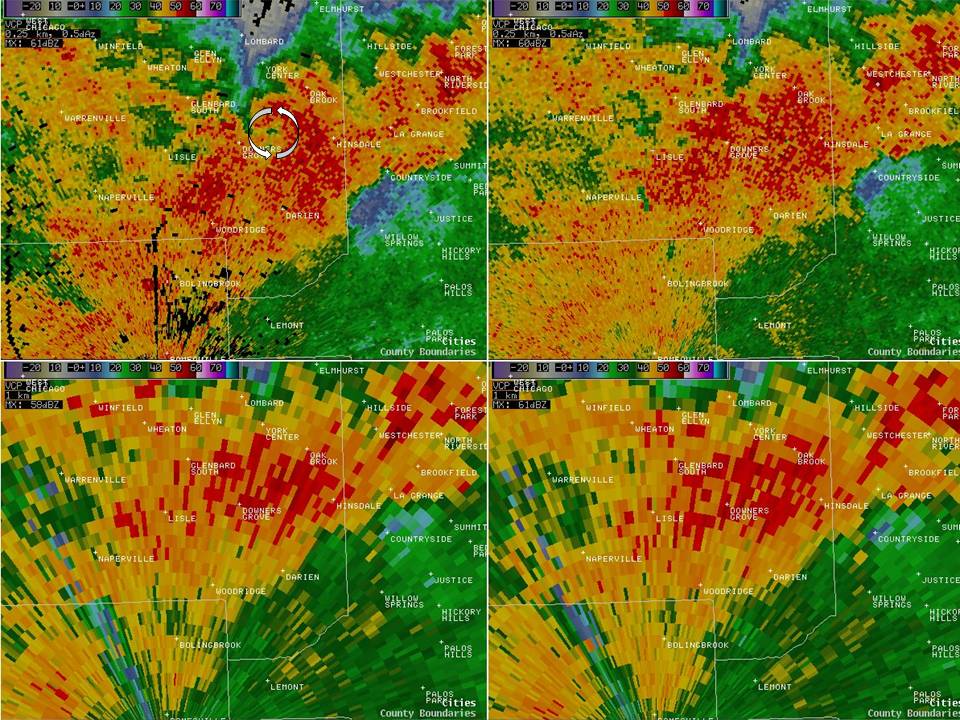
Figure 2 (Below): Four panel image of radar reflectivity from the Romeoville, IL (KLOT) WSR-88D. Note in the upper left quadrant on the 0.5 degree elevation scan, the weak echo area bounded by higher reflectivity (arrows indicate inferred rotation from velocity data). This is indicative of a small-scale area of rotation along the leading edge of the line of thunderstorms lifting northeast across the Downers Grove area. This radar image corresponds with the time of the Downers Grove tornado.
|
Radar Reflectivity Imagery |
|
|
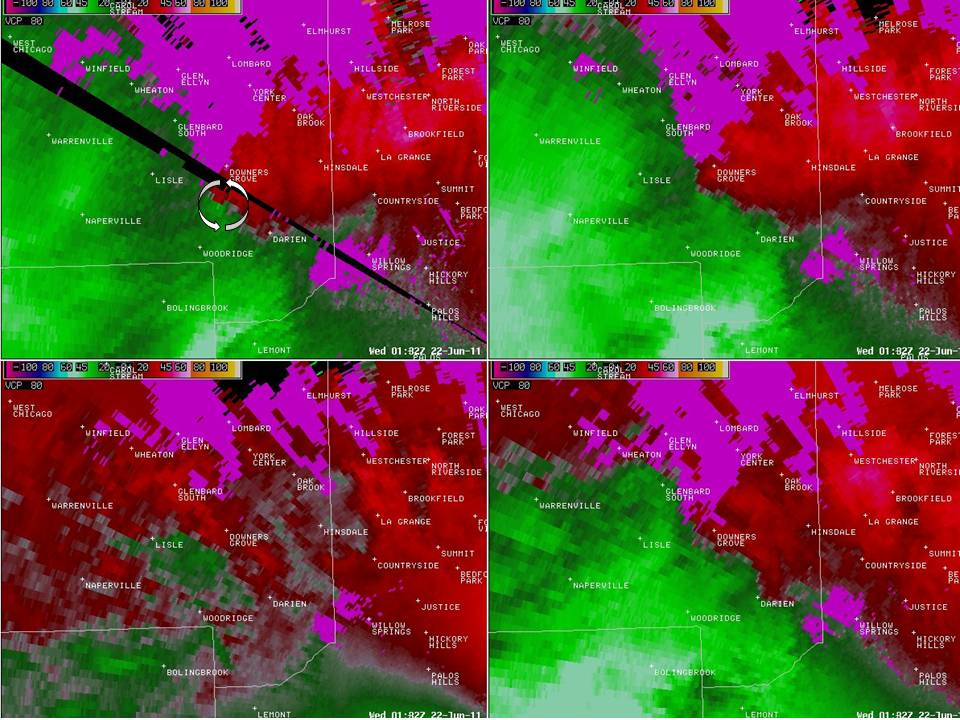
Figure 3 (Below): Four panel image of storm-relative velocity from the Terminal Doppler Radar south of Midway Airport (TMDW). As above, the upper left quadrant shows the lowest elevation scan. Note the contrasting green and red areas within the circular arrows. The bright green colors are winds moving toward the radar (to the southeast, or lower right in this case), while the reds are moving away from the radar. The arrows surround a signature called a "velocity couplet", which is indicative of relatively strong low level rotation as seen by Doppler radar. This image shows the storm a couple of minutes prior to the reflectivity data in Figure 2, during the Downers Grove Tornado.
|
Radar Velocity Imagery |
|
|
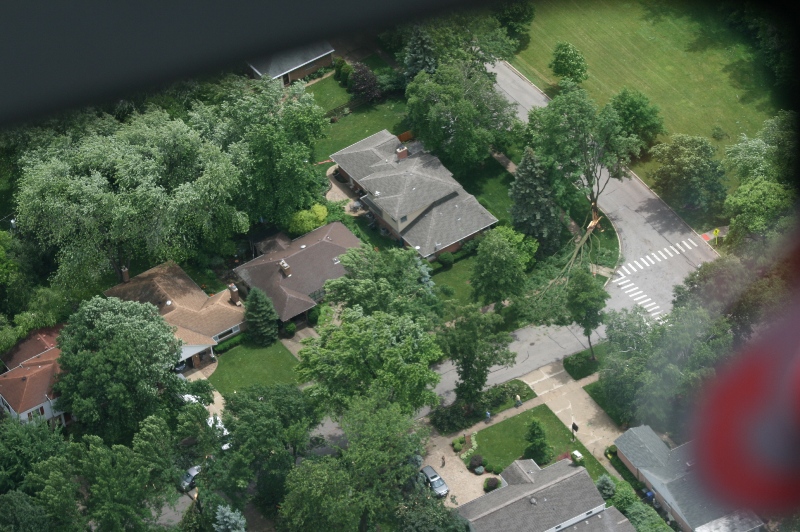
Figure 4 (Below): Aerial view of tornado damage in Downers Grove, Illinois. Looking southeast, the major street running from top left to right center is 63rd street, and the intersection at the top left is Duhnham Rd. Downers Grove High School tennis courts are at the upper right. Note the mature trees snapped off near the center of the picture.
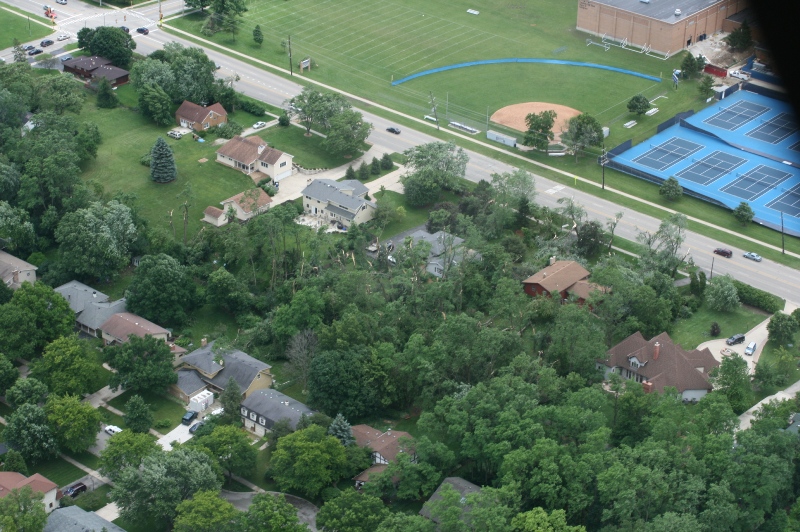
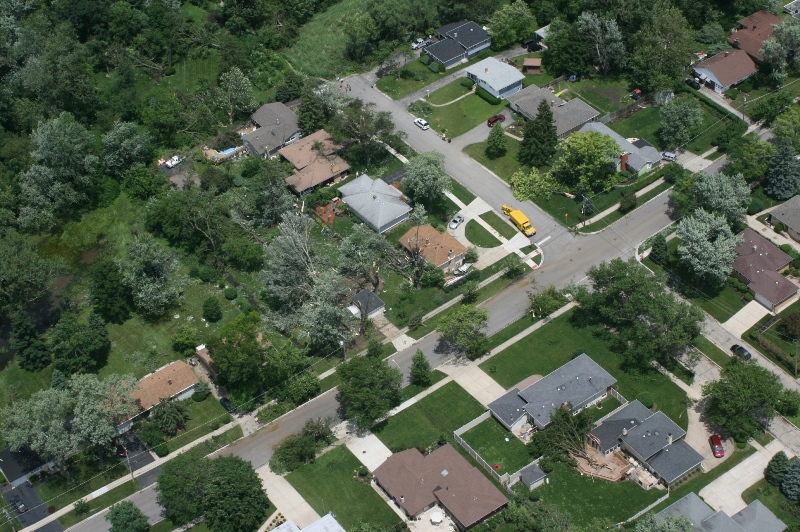
Figure 5 (Below): Another aerial view of tornado damage in Downers Grove, IL. Much of the damage was to trees, as seen in the left center of the photo where several mature hardwood trees have been snapped off or knocked down.
Mount Prospect Tornado
| Intensity Rating | EF-1 |
| Estimated Max Winds | 90-100 mph |
| Tornado Began | 8:48 PM |
| Tornado Lifted | 8:50 PM |
| Path Length | ~2.3 miles |
| Maximum Width | 200 yards |
Figure 6 (Below): Map of the path of the Mount Prospect Tornado.
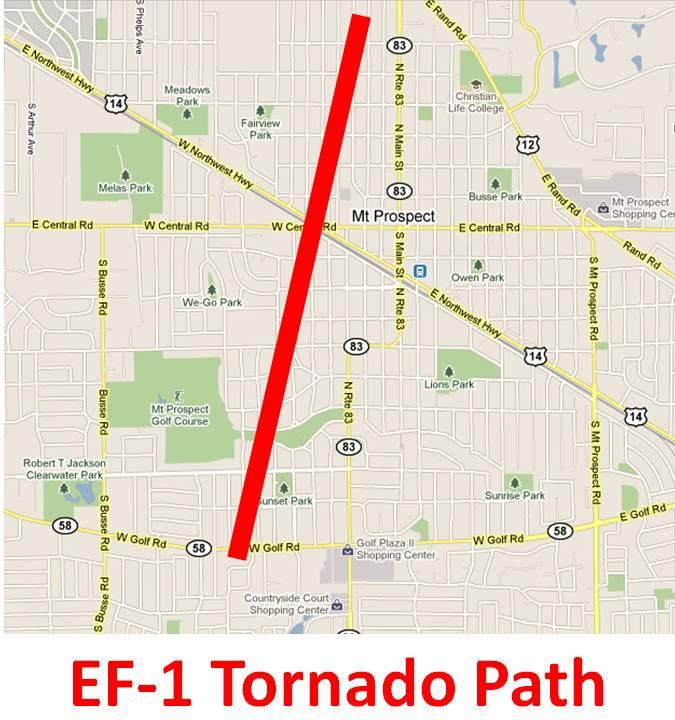
Figure 7 (Below): Similar to Figure 2, this is reflectivity image from the O'Hare Terminal Doppler Radar (TORD) taken from the time of the Mount Prospect tornado. Again note the area indicated by the arrows in the top left quadrant of the four panel image. This shows somewhat weaker reflectivity returns wrapping cyclonically (counter-clockwise) in a hook-like shape, which is an indicator of rotation along the leading edge of the storms. Note also the correlation with the velocity signature in the following Figure.
|
Radar Reflectivity Imagery |
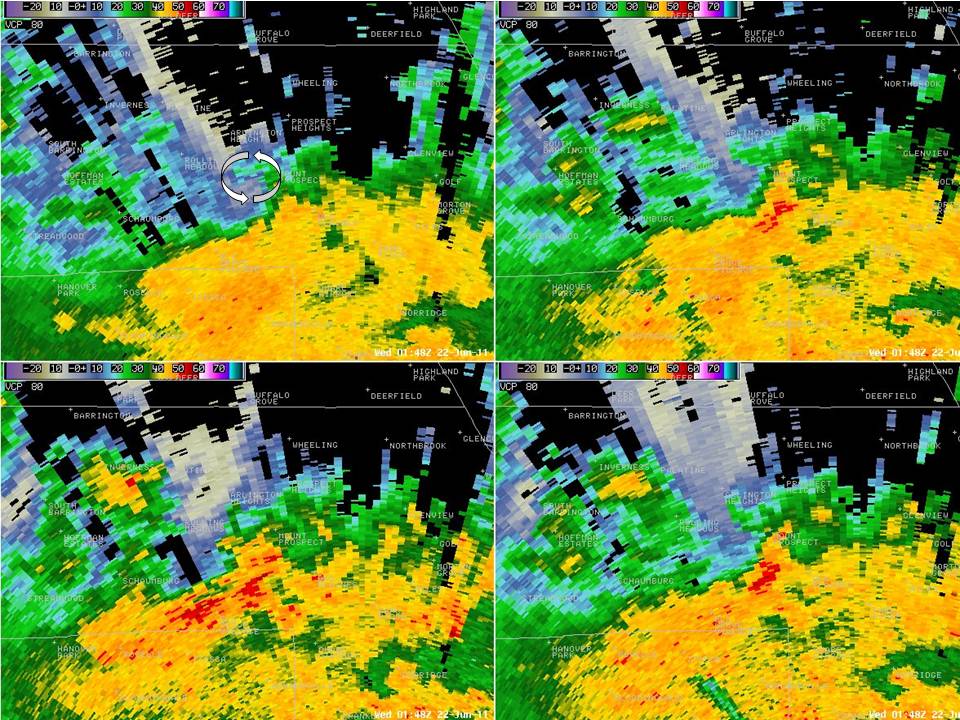 |
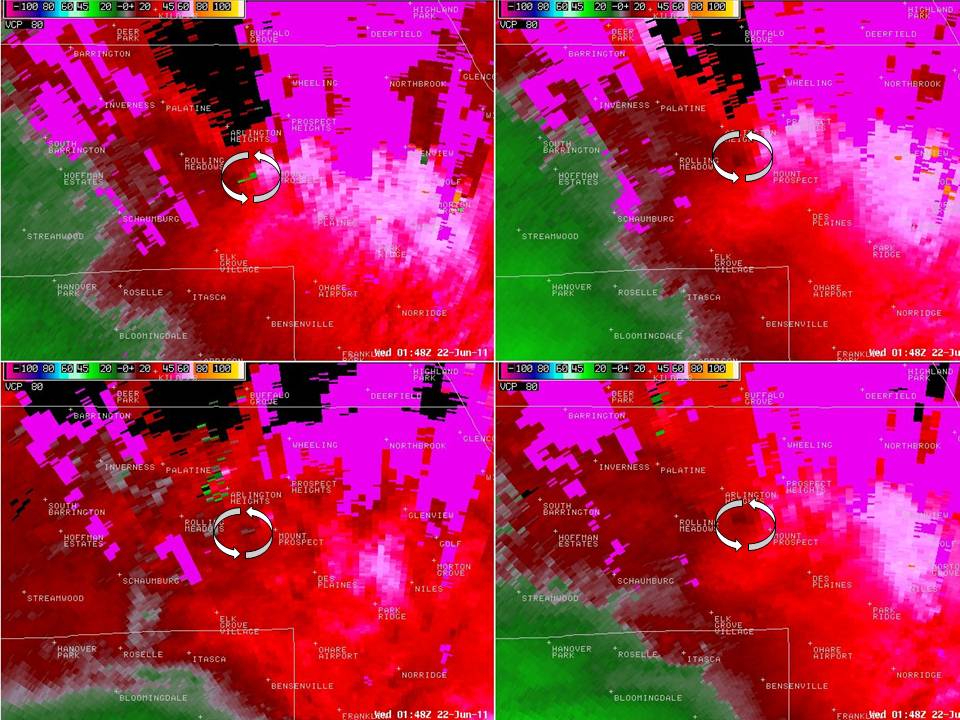
Figure 8 (Below): Similar to Figure 3, this is storm-relative velocity data from the O'Hare Terminal Doppler Radar (TORD). Once again, direct your attention to the area within the arrows, which again depicts a "velocity couplet", or a strong signature of low level rotation as seen by Doppler radar. The bright greens again indicate inbound velocities toward the radar, located south-southeast or to the lower right in this image, while the red colors are outbound velocities. These images also correspond to the time and location of the Mount Prospect tornado.
|
Radar Velocity Imagery |
|
|
Figure 9 (Below): Aerial view of tree damage in Mount Prospect.
Aerial survey assitance from CBS 2 Chicago.
Izzi, Allsopp, Ratzer 6/22/11.