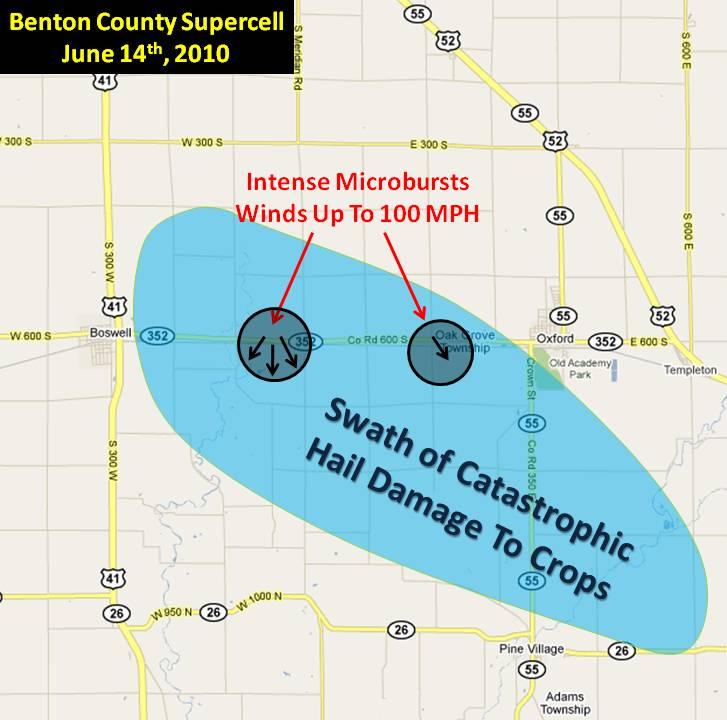
On the afternoon of Monday June 14th, 2010, a severe thunderstorm produced a swath of significant wind and hail damage (Figure 1) across southern portions of Benton County Indiana. The storm initially developed over east central Illinois, then rapidly intensified as it crossed the Iroquois/Benton County line and moved into Indiana. The storm continued to strengthen within an environment of strong deep layer shear and moderate instability, which allowed the storm's updraft to develop a strong mesocyclone (rotation), and resulted in the supercell storm becoming a prolific severe weather producer. A full write-up on the National Weather Service's Storm Damage Survey can be found here.
Meteorological Setup
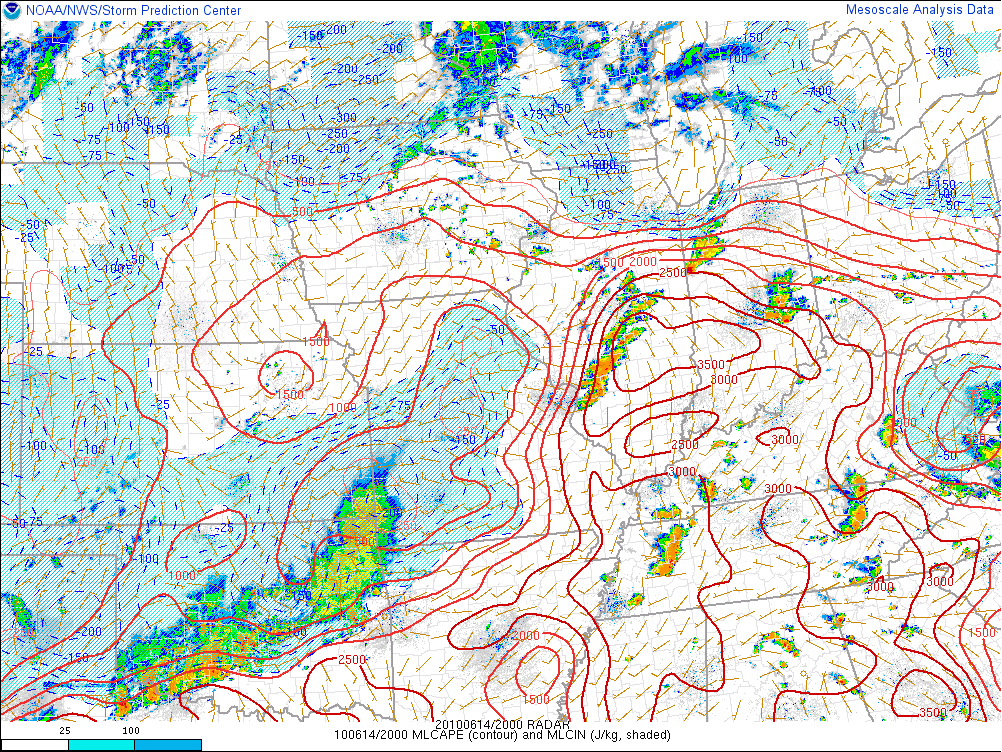
During the morning of June 14th, a frontal boundary had become nearly stationary across northern Illinois and northern Indiana (Figure 2). By mid-afternoon, the airmass along and south of the front had become moderately unstable, with MLCAPE values increasing to 2000-2500 j/kg (Figure 3).
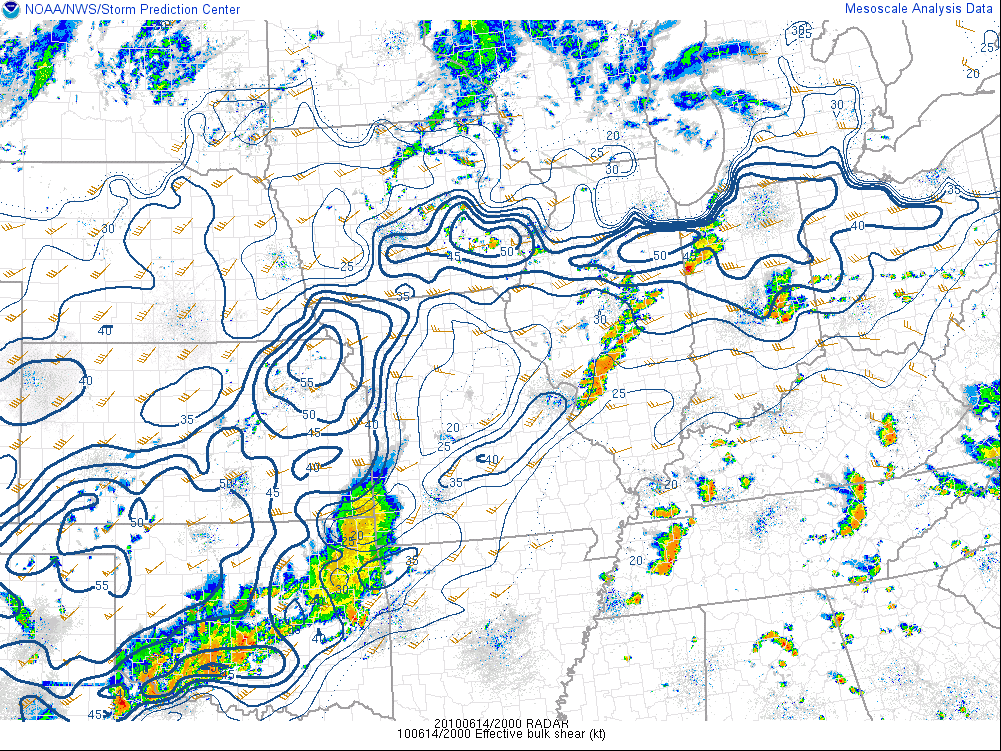
As the storm was developing rapidly due to the moderately unstable airmass, it was also experiencing an environment of relatively strong deep layer shear. Bulk shear in excess of 35 knots within the 0-6 km layer is often used as an indicator of the potential for supercell storms. The effective bulk shear (using an observational and model blend to assess a storms inflow height) was significantly stronger than this across northern Illinois and northwest Indiana, with values approaching 50 knots! (Figure 4)
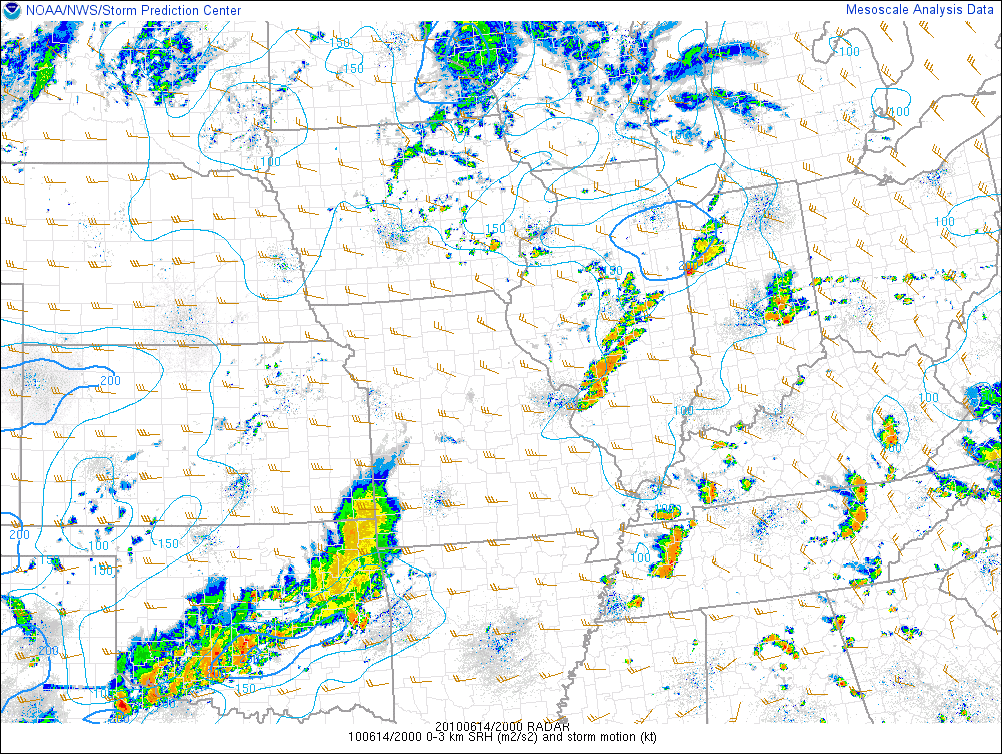
In addition to the deep layer shear available to this storm, the backed east to northeasterly winds north of the stationary front also produced significant low level turning of the winds with height, since winds aloft were westerly. Storm Relative Helicity (SRH) is often used as a measure of the potential for cyclonic updraft rotation in right-moving supercells. While current research indicates that deeper layer shear may be better related to supercell formation, values of 0-3 km SRH in excess of 250 m2/s2 do suggest an increased threat of tornadoes with supercells. The SPC/RUC mesoanalysis at the time of the Benton County storm indicated 0-3 km SRH values in excess of 200 m2/s2 (Figure 5).
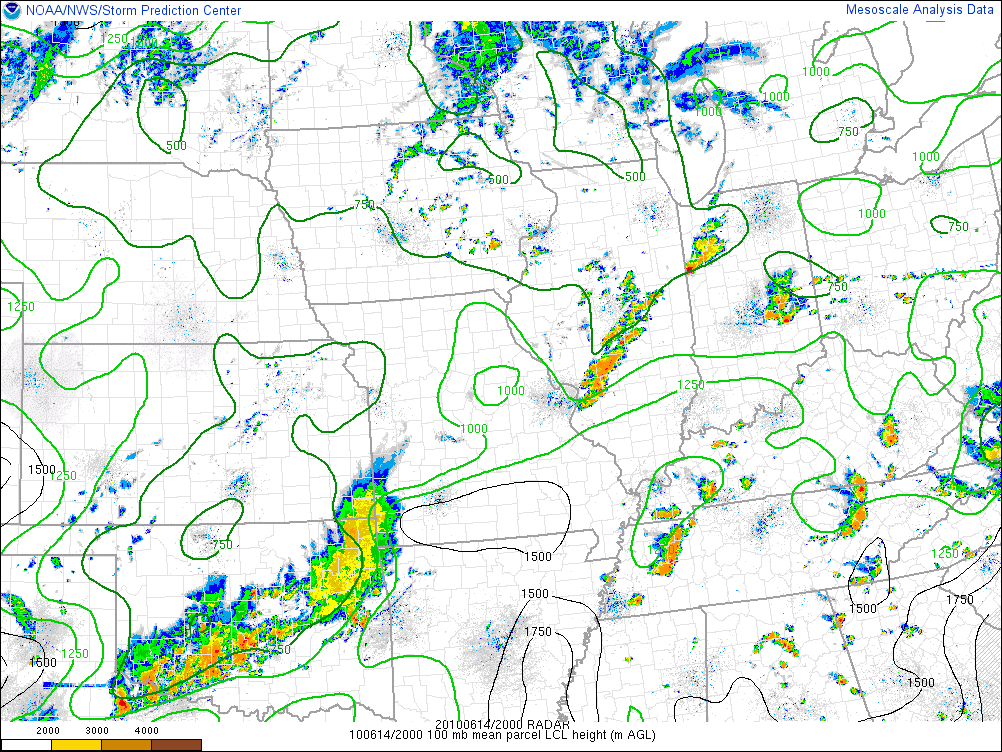
While a post-storm damage survey indicated that the damage from this storm was produced by straight line downburst/microburst winds and very large hail, the combination of a strong mesocyclone, impressive low level helicity along the frontal boundary, and a very moist low level airmass suggested a very real potential for tornado development with this storm. Moist low level conditions, noted by low cloud bases and Lifted Condensation Levels (LCL) below 1000-1500 meters have been shown in recent research to also be a favorable factor for tornadoes with supercell storms. This storm developed within a very moist low level environment with surface dewpoint depressions around 10F and LCL heights as low as 500 meters (Figure 6).
Radar Depiction of Supercell at 415 pm EDT
 Radar Loop of Storm CLICK HERE
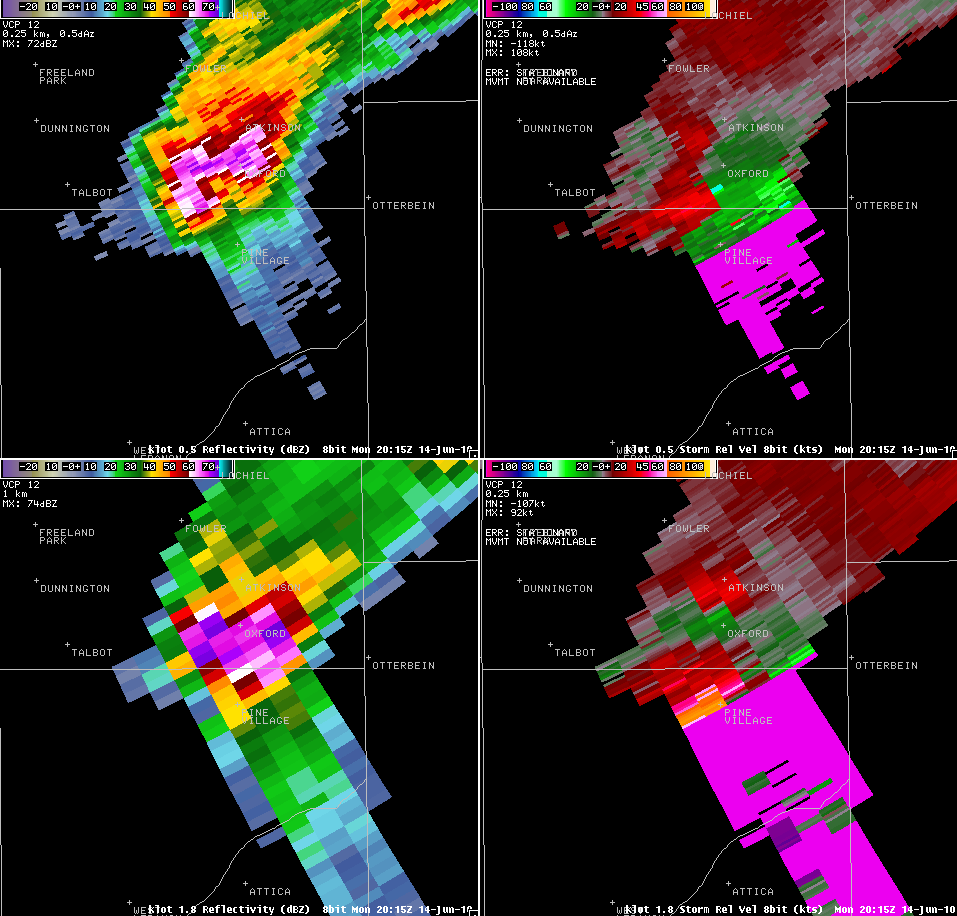
The following image (Figure 7) is a four-panel radar depiction from the NWS Chicago/Romeoville IL WSR-88D at 2015 Z (415 pm EDT). This is during the time when severe microburst winds were occurring near Boswell and Oxford in southern Benton County. The panel at top left is a base reflectivity image showing the storm. While the radar beam is intersecting the storm at close to 7000 feet AGL, there is a clearly defined weak echo region (WER) where the higher reflectivity (purple colors) surround weaker returns in a "C" shape. This is where the strong, rotating updraft was occurring. The lower left panel shows a higher slice of the storm, at around 18,000 feet AGL. Note that the low level WER is completely capped aloft by highly reflective returns. This is likely very large hail, which is further evidenced by the three-body scatter spike which extends southeast from the storm in both depictions. This "hail spike" signature is a radar artifact usually caused by the presence of large hail within a storm. In fact, softball size hail (4.25") was falling from this storm near Oxford at this time! The upper and lower panels on the right side of the image are Storm Relative Velocity images, which depict the mesocyclone via green inbound (the radar is ~70 nm to the northwest of the storm) and bright red outbound velocities. Pixel to pixel or "gate to gate" shear values were approaching 100 knots at this time, which indicates very strong rotation within the mesocyclone. These are all classic radar evidence of a very strong supercell thunderstorm.
Three dimensional views of the storm were equally as impressive, with a vertical cross section through the heart of the storm (Figure 8) nicely depicting a classic "overhang". This overhang feature is indicative of a very intense updraft that is so strong that it is literally blowing all of the rain and hail great distances upward into the storm. Trained storm spotters and tornado chasers look for this region, which is typically chracterized by a rain free base of the storm. The region of the storm beneath this overhang also coincides with the strongest rotation in the storm and is typically where a wall cloud, funnel cloud, and/or tornado would be most likely to form. The updraft of this storm was so incredibly intense, not only was it able to support the weight of up to softball sized hail, but the air was rising with so much force that the overshooting tops at one point reach up to 63,500 feet above the ground, which is a little over 12 miles straight up into the sky!!
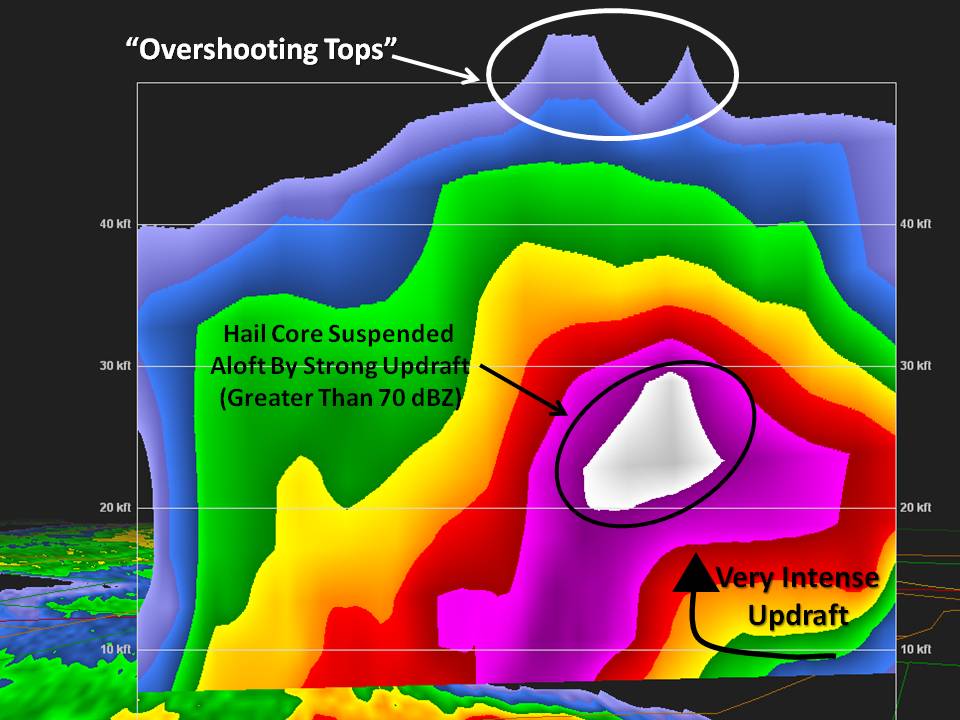
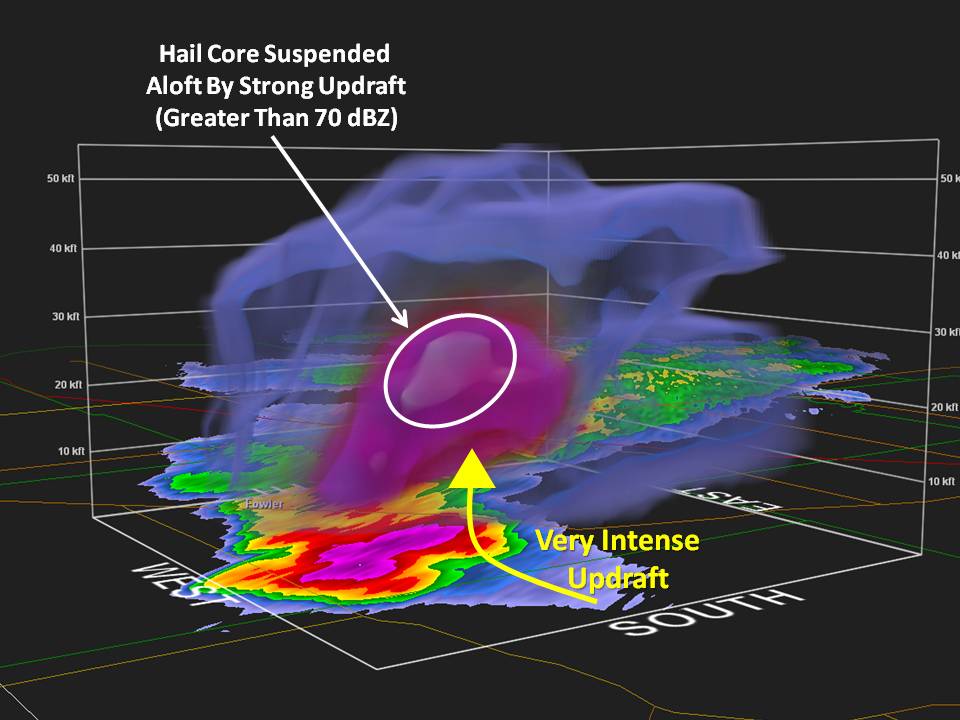
Finally, a three dimension vertical cross section (Figure 9) of this storm similarly shows the incredible magnitude of the updraft, and also nicely depicts the hail core that is being suspended aloft by the intense updraft. Many of the same features that can be seen on the 2 dimensional view of the storm show up even clearer in 3-D!
Ratzer/Izzi/Shea, 06/14/10

