I. Introduction
During the late afternoon and early evening of April 14th, 2006 convection rapidly developed over east central Illinois and northwest Indiana. Hail 2.5” to 3” in fell over portions of Iroquois (Il) and Jasper (IN) counties. Hail to 1.75” was reported at Marseilles in LaSalle County Illinois. Most of this occurred between 6PM and 7 PM CDT. In this document we will concentrate on three storms that occurred in…Marseilles Illinois, Milford Illinois and Remington Indiana.
A combination of mesoscale surface related systems and factors aloft combined to produce the large hail. A variety of traditional and non traditional data sources shed light on conditions present or just prior to the hail. Hail size is visually documented. Using the supplemental radar display programs of WDSS2 and IDV we are able to get a unique view of the cells responsible for this activity as well as radar signatures commonly associated with large hail.
II. Mesoscale and Synoptic Background
Low level forcing can be summed up with the surface analysis for 15/0000 UTC (click on image for larger version).
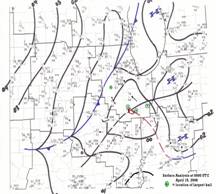
A synoptic cool front was working southeast across northern Illinois while an old boundary extended from northwest Indiana into central Illinois. This latter boundary was related to convection which went through the region the prior night. Low pressure has formed over Iroquois County at this time. Moist southwest winds are feeding into the system from around Champaign and Danville southward. Location of the largest hail reports are indicated by the green bulleyes. Note surface dew points remain in the low to mid 60s well north of the southern boundary to and even behind the cool front.
The latest SPC outlook area for late in the afternoon of the 14th focused further south in Indiana into central Illinois where impressive supercells developed near Indianapolis. Of the assorted SPC hourly RUC based analysis charts the surface based CAPE and significant hail parameter provided some insight into impending events. At 2200 UTC the maximum surface based CAPE of 3500j/kg encompassed both LaSalle and Iroquois Counties. The significant hail parameter (SHIP) is new this year and is intended to highlight areas where large hail (>2”) may occur. Values of SHIP greater than 1.00 indicate a favorable environment for SIG hail. Values greater than 4 are considered very high. In practice, maximum contour values of 1.5-2.0 or higher will typically be present when SIG hail is going to be reported. In the analysis at 2200 UTC the entire zone impacted by large hail had a value between 3 and 4.
The visible satellite view at 2302 UTC reveals two areas of active convection. The southern most is related to the weak surface trough over east central Illinois.
The airmass aloft was characterized by steep lapse rates, large CAPE values and increasing northwest jet level winds. Soundings taken at ILX at 2100 UTC and 15/0000 UTC reflect the steep lapse rates through a deep layer and “balloon” CAPE profile. CAPE values exceeded 2700j/kg at 2100 UTC while over 2300 j/kg at 0000 UTC. Modifying the 0000 UTC sounding for conditions (while lines) near the large hail the CAPE values increase to over 2900 j/kg. In both data sets winds veer steadily with height. We were also able to independently verify the ILX soundings from TAMDAR (aircraft) data from Bloomington Airport at 2250 UTC.
Aloft the environment was impacted by an approaching high level wind maxima…and remains of a retreating jet streak over the upper Ohio Valley. ACARS (aircraft) jet level wind data composite for a 3 hour period, 2100-2359 UTC, shows the ‘nose’ of a jet maxima overspreading the convective zone. Initialized NAM-80 model data at 1800 UTC for 250mb suggests the approaching jet maxima was also interacting with a retreating jet streak further downstream. Between them, over northern Indiana, was a divergent pool (coupling of jet features) which would lend support to enhancing vertical motion above the lower level forcing.
III. Hail Production and Detection
Although winds at jet level were increasing, convective cores as detected on the radar, were generally vertical. Thus hail growth was not apparently inhibited by shear or entrainment. The CAPE profile and thermal structure seen on the ILX soundings offers some insight into hail growth potential. First, the existence of a deep zone of steep lapse rates supported a ‘fat’ zone of CAPE. This implies rapid acceleration of air parcels (since the saturated air is so much warmer than the environment). Absent of strong shear and entrainment the hailstones have a uniform environment within which to grow and strong updraft to keep larger stones aloft. A closer look at either the 2100 UTC or 15/0000 UTC sounding shows the while the freezing level was near 13,000 ft the wet-bulb zero (WBZ) was closer to 10,000 ft. With such strong updraft potential and modestly low WBZ the hail growth zone was both vigorous and deep.
One of the more reliable telltale radar reflectivity indicators of large hail is the three-body scatter spike (TBSS). This phenomena is the result of deflection of the radar beam off large/wet hail stones and the detection of such as a delayed ‘second trip’ echo. On a plan radar view this appears as streaked return along the radial on the back side of a cell. The level at which this is observed should be near the hail core. Because these hail storms were isolated it was possible to detect these streaks without interference from surrounding echoes.
A four-panel display of KLOT radar reflectivity at 2245 UTC shows the development of this feature generally prior to the reports of the largest hail. They are not evident in the lower scans but at 2.4 deg and above (lower 2 panels) it becomes quite apparent. This corresponds to around 20,000 ft and above. As the hail grows and depth of larger stones increase (they fall!) the TBSS can be detected as low as around 6500 ft at 2312 UTC (only 27 minutes later). Even from the other side, WFO IND, the hail spike for the Remington storm could plainly be seen at 2322 UTC (note the strong storm just east of IND!...it had a hook shortly after this image)
Usually we view these TBSS phenomena in a plan view setting. However, through the use of WDSS2, we are able to view these in cross sections and see whether indeed the hail core has a relationship with the TBSS. Our first example is the storm which produced 1.75” hail at Marseilles. Viewed from the 6.0 deg scan elevation at 2329 UTC a narrow TBSS can be noted down radial from the small pocket of maximum return. The cross section line is noted. In the vertical slice one can plainly see the relationship between the hail core and down-radial return. Also note…the core of the storm is sloped upwind! [We are looking from west to east so the core is sloping a bit from east to west]. With the increasing shear aloft from the approaching jet this upstream axis suggests the core is quite strong.
The plan reflectivity view (at 0.5 deg) of the Milford and Remington storms at 2324 UTC provide a visual reference for the subsequent cross sections. A few minutes earlier, at 2308 UTC, a cross section along a TBSS for the Milford storm showed the dramatic echo return of the TBSS (this was just prior to the large hail report at Milford). The core of this storm is very strong with >60dBz returns in excess of 30,000 ft. Concurrently the plan view the Remington storm at 2324 UTC has the most impressive profile. Here there is a >65dBz return to 26,000 ft and large TBSS shadow. Remember, the basic beam height (0.5 deg scan level) at this range is nearly 6500 ft. In all three of these storms there is a clear relationship between the (large) hail core and TBSS.
IV. 3-D Displays
In the course of traditional storm diagnostics the use of 4-panel displays and cross sections are important tools. They provide a 3-dimensional representation of the storm structure. With the use of a program called IDV we can get an even more insightful view of the 3 dimensional nature of convective cells.
The first presentation is of the LaSalle County (Marseilles) storm at 2308 UTC. This appears to be an aerial view and provides a unique perspective. The two reflectivity displays are basically the same….the lower one is mapped to the geopolitical background map while the elevated one reflect the true beam height as the earth curves away from the radar beam (0.5 deg in this case). The vertical core is an isosurface of 60 dBz. The discontinuity in the vertical pillar reflects the scan strategy being used (VCP121) which omits some slices in the vertical. The pillar also terminates abruptly reflecting the upper limit of the scan strategy. Nonetheless one can get a good sense three dimensional character of the storm core and its relationship to other storms. Note that the Marseilles storm has 60dBz at the beam interface (and upward) while the storm to its north has only a small 60dBz core elevated somewhat above the 0.5 beam elevation.
The Milford storm at 2308 UTC viewed in a similar fashion looking north shows this cell had a somewhat larger core mass at 60 dBz than the Marseilles cell. The same double mapping scheme is used to reflect the actual vs mapped reflectivity displays. The core from the Remington storm just to the right (east) of the Milford core has been blocked out for display purposes.
At 2324 UTC the Remington storm, which likely produced the largest hail, is viewed from the southeast. The 60dBz core display has been truncated by scan strategy beam restrictions but one still gets a good idea of the size of this high reflectivity core and its relationship to the rest of the storm. Note the core of the Milford storm, just to the west, has decreased since 2308 UTC.
Often the analysis of structure and strength of convective cells is related to the elevation, magnitude and size of the maximum reflectivity core, the storm itself is comprised of varying levels of return. Displaying that in detail using 3 dimensions is a unique means to visualize that structure. The image at 2328 UTC provides a glimpse of what this may look like using two levels of return. In this display the magenta is the 60dBz isosurface core which is meshed with the 40dBz isosurface. Here one can get a sense of the vertical structure and relationships internal to convective cores.
V. Hailstones and Summary
This analysis would not be complete without a glimpse of what actually occurred. The hail stones at Remington Indiana inflicted damage on the siding of houses, dented cars and undoubtedly cracked some windshields. These stones are compared to a quarter making their estimated size about 2.5 inches in diameter. Since the ground was wet from previous rains the hail also made indentations in the muddy ground. In holding this stone the lady provides a reference for how large some of these were.
The hail storms of April 14, 2006 developed rapidly during the late afternoon. A combination of synoptic, mesoscale and thermodynamic factors converged to initiate and sustain the convection. Traditional SPC guidance tools focused further east in Indiana for a tornado threat. However, a few of the parameters available from the SPC analysis web site proved accurate in anticipating large hail over the zone in which it occurred. The isolated nature of individual cells provided an opportunity to detect important signatures reflective of large hail. It also allowed the opportunity to display aspects of the storms using more advanced graphics thus adding some insight to their structure and character.
KML 5/06

