Snow and Mixed Precipitation Storm
|
 |
 |
The Event
A broad scale satellite view of the synoptic pattern at midnight Tuesday morning (0600UTC Tues) shows the anchor vortex off southern California with southwesterlies extending eastward into the Ohio Valley. The main baroclinic ribbon ran from around Lake Huron into northern Oklahoma. A series of disturbances can be seen along this southwest flow with perhaps the main one being over New Mexico and Colorado. In our region the surface weather reflected the circulation around a large anticyclone over southern Canada by the northeast winds and temperatures in the 30s as far south as central Illinois. Drier air lurked just to the north over southern Wisconsin but the wind component off Lake Michigan held dew points in northeast Illinois near 30F.
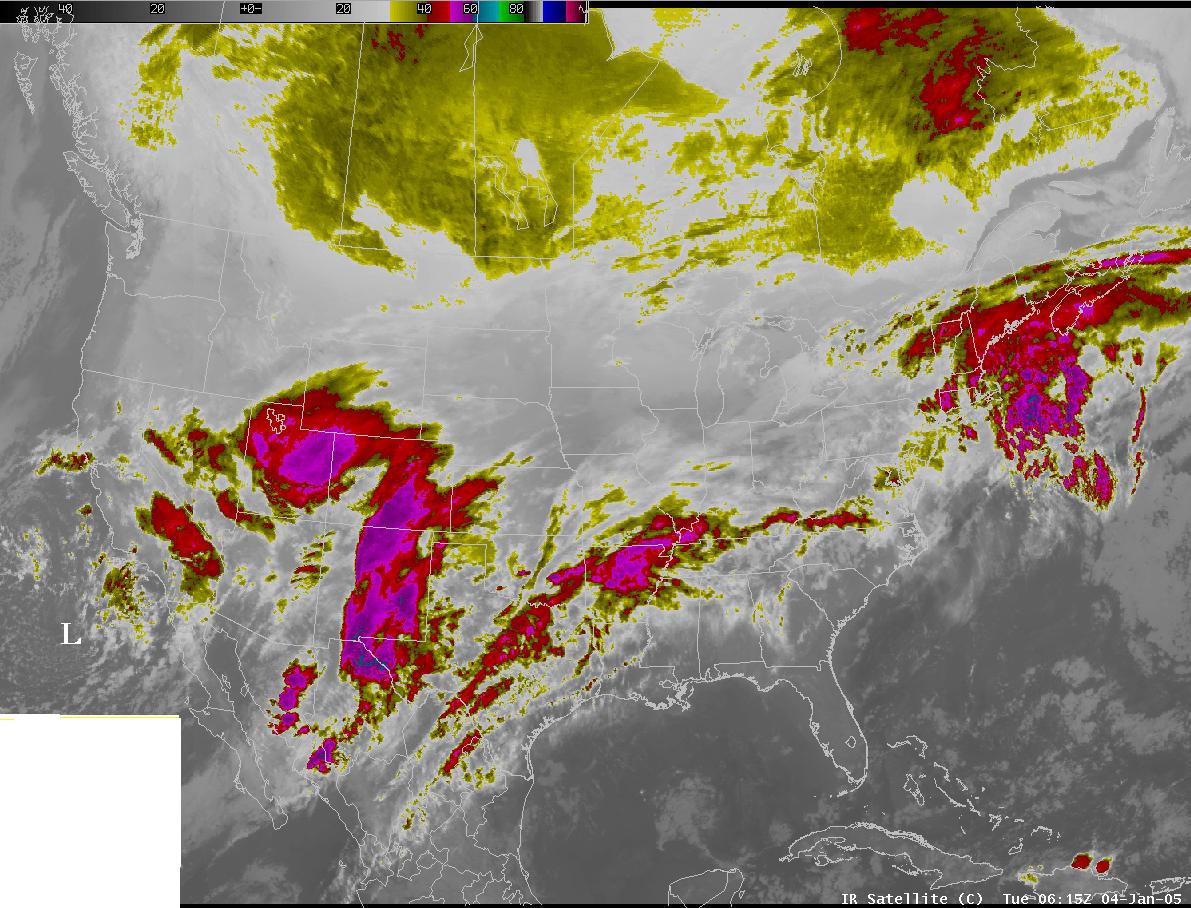 Satellite view at 0600 UTC on January 4, 2005 |
By later on Tuesday (5PM) satellite imagery showed the cloud shield had expanded well north into the western Lakes while mixed precipitation had broken out in eastern Iowa and western Illinois. The scope of the low level thermal contrast can be seen in the observations across southern Missouri into the lower Ohio Valley. Aside from the marked temperature contrast the surface dew points feeing into the system on the warm side of the boundary exceeded 60 deg F in some spots.
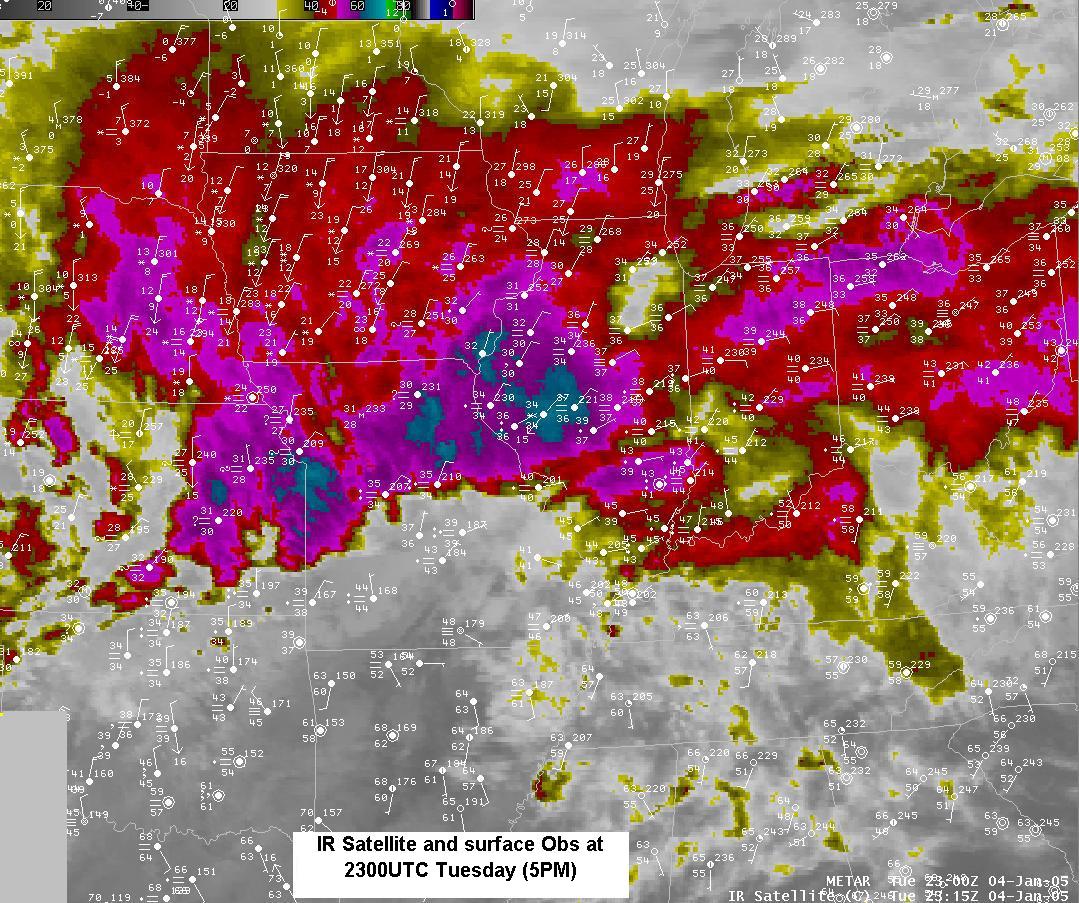
5 PM satellite imagery on January 4
The concern with the anticipated unfolding of events was the mix of precipitation given the shallow nature of the cold air in the region and expected push of moist (warm) air associated with any disturbances. The KDVN sounding at 0000UTC of January 5th (late Tuesday afternoon) illustrates the problem. While surface conditions are below freezing a zone above freezing can be seen between about 850mb and 775mb. While not exceedingly warm it was sufficient to account for the mixed rain and sleet reported in eastern Iowa at the time.
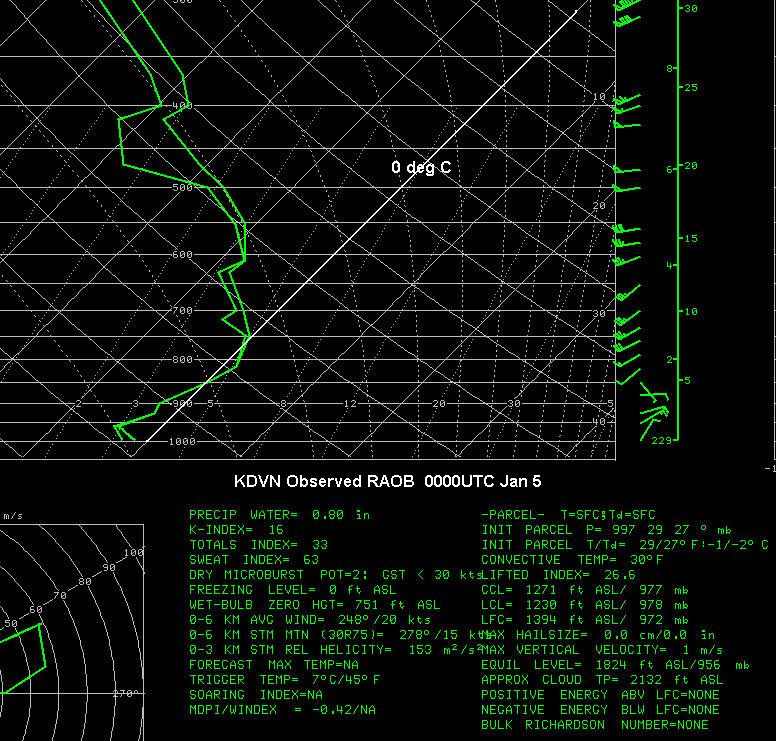
KDVN raob at 0000 UTC on January 5
Looking at things a different way, a vertical time section at ORD beginning at 1200UTC Wednesday (far right) shows a warm layer (not above freezing) holding through most of the day Wednesday. Since the zone never got above freezing (apparently) precipitation at least at ORD and points north would be expected to be essentially all snow. In fact some freezing drizzle and sleet began the event around midnight Wednesday but all snow was observed during the time frame in this image.
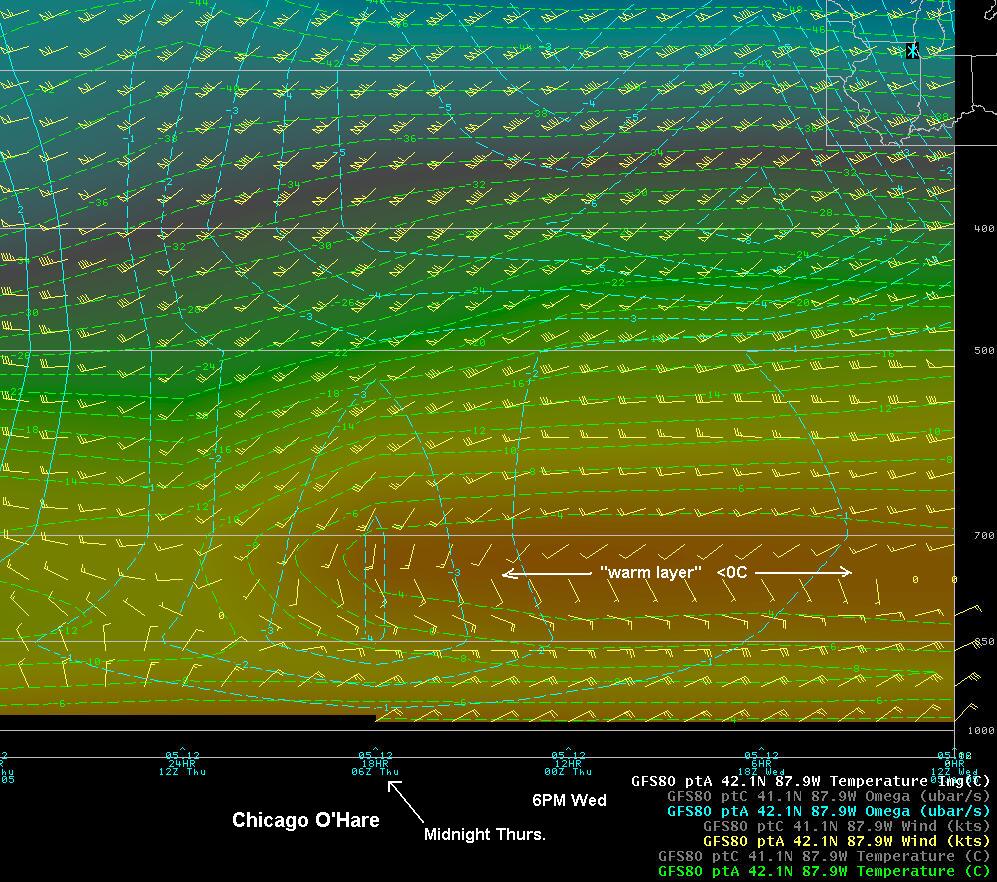
Vertical section at KORD at 12 UTC January 5
Further south at Kankakee a similar time section showed a persistent zone above freezing temperatures into Wednesday night. The zone was modestly deep and suggested enough melting would occur to make precipitation during the day Wednesday mostly rain, which it was. The trick in these events is where to draw the ‘line in the sand’ for precipitation types as well as ‘how much snow’ will fall (as well as ice).
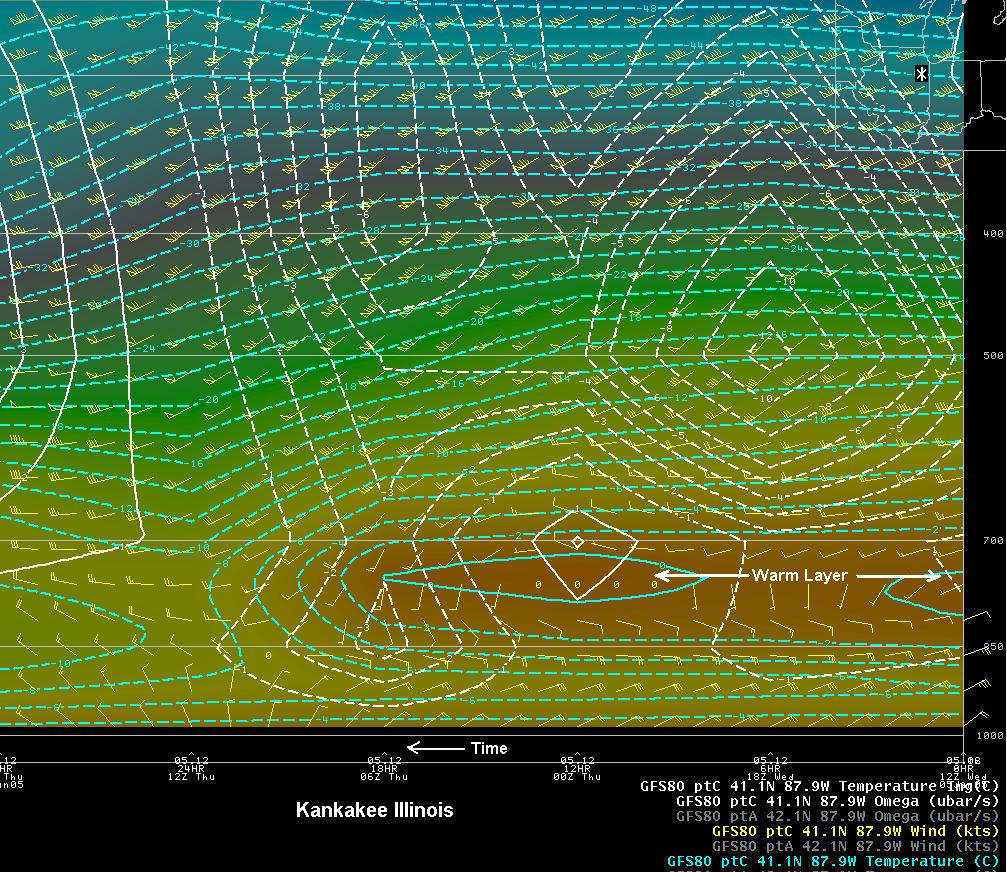
Vertical section at Kankakee at 12 UTC January 5
Radar and surface observations during the evening of the 4th (0400UTC Wednesday) showed the widespread nature of the precipitation. The dashed white line approximates the rain/snow line. Over down state Illinois and into Indiana the radar returns were quite vigorous reflecting the deep overrunning of very moist air. Precipitation was all rain there.
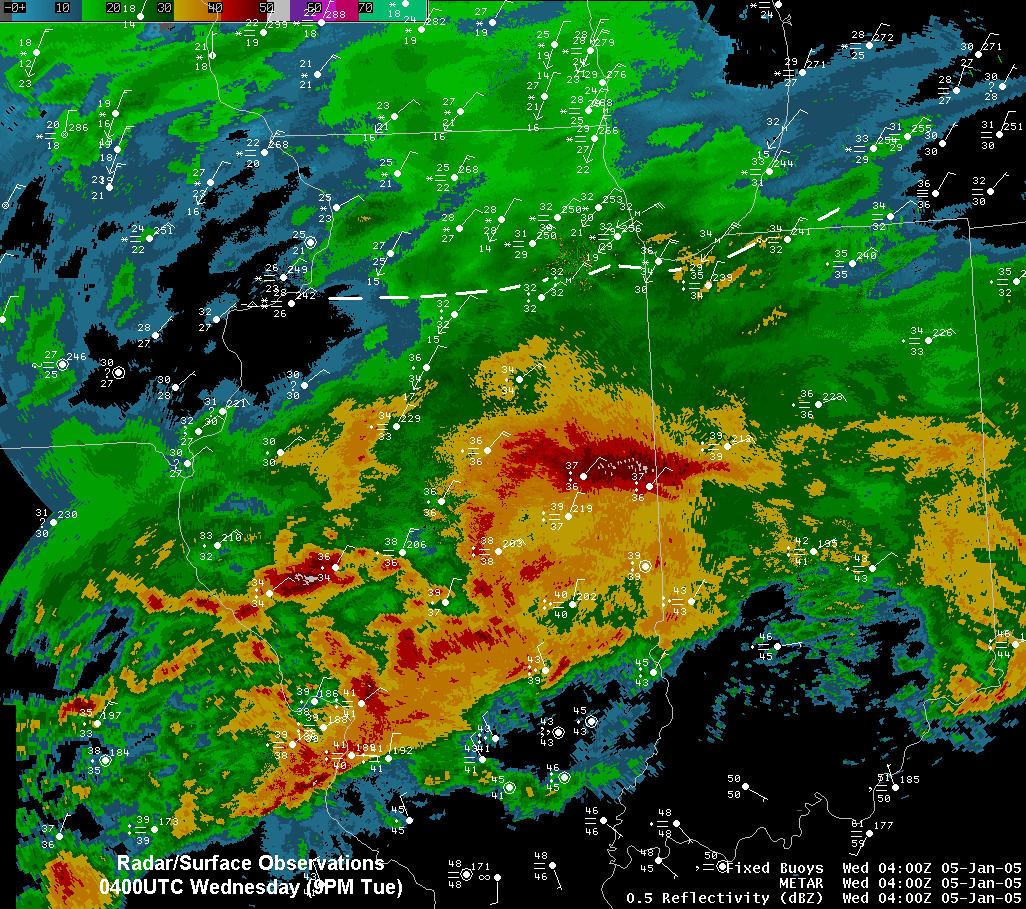
Radar and surface observations from 04 UTC January 5th
By 1200UTC (6AM) of Wednesday observed sounding data at KILX and KDVN illustrated the disparity across the frontal zone. KILX continued to have a strong warm layer while KDVN was completely below 0 deg C. The rather steep lapse rate above 650mb at KILX may also reflect the more convective nature of precipitation in central/southern Illinois.
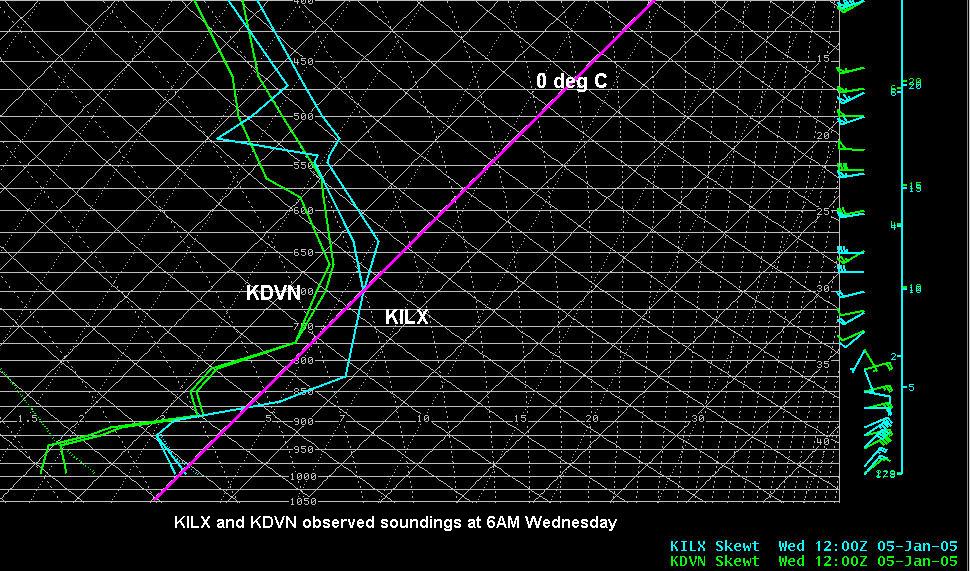
Observed sounding data at ILX and DVN from 12 UTC January 5
IR satellite imagery at 1545UTC (945AM) Wednesday coupled with the 500mb height field shows a piece of the western trough had emerged into the Plains and offered some organizational support to the clouds over the eastern Plains into the Great Lakes. While the main cloud plume had expanded northward the low level thermal field had continued to sag slowly south as cold air steepened to the north. The yellow patch of IR return over North Dakota, northwest Minnesota and into Manitoba is really surface temperatures near -30 deg C.
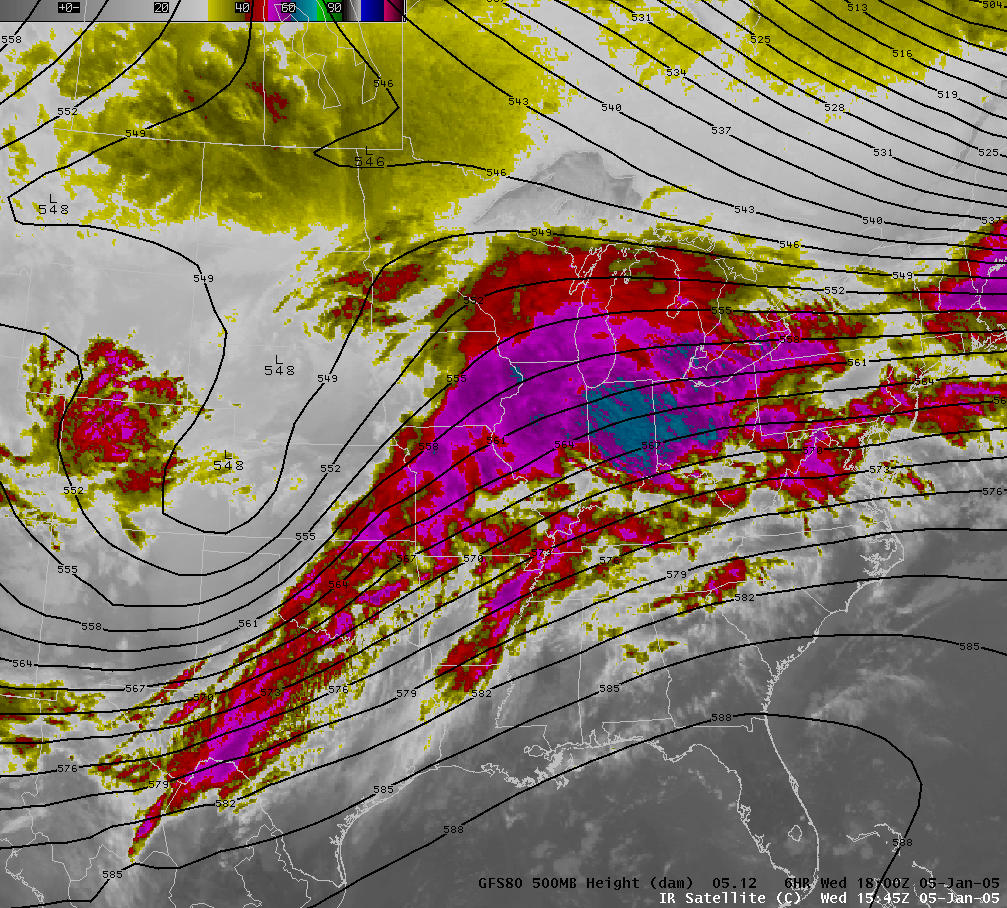
IR satellite imagery at 1545 UTC January 5
To illustrate the cooling that was going on in low levels we can see a comparison of aircraft sampled thermal profiles at ORD. Between 0611UTC and 1819UTC (about 12hrs) the comparison shows most of the cooling had occurred below about 750mb and remained below freezing. Snow was reported during this period.
Comparison of aircraft sampled thermal profiles at ORD
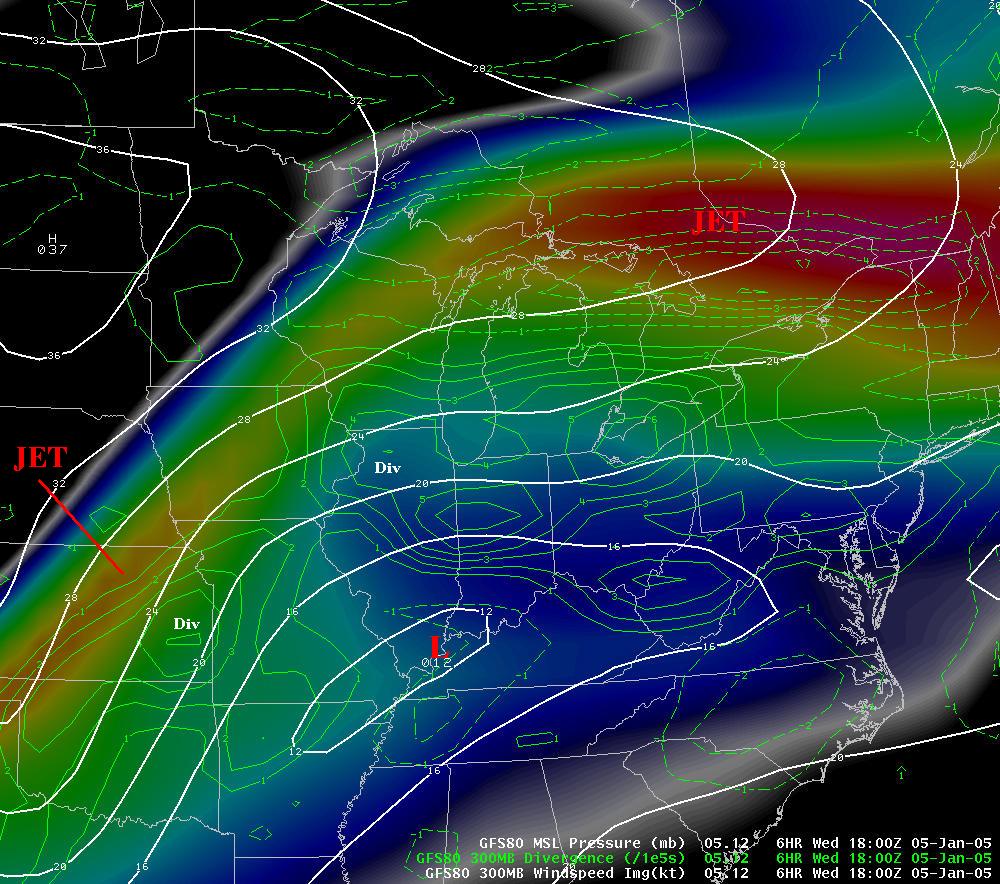
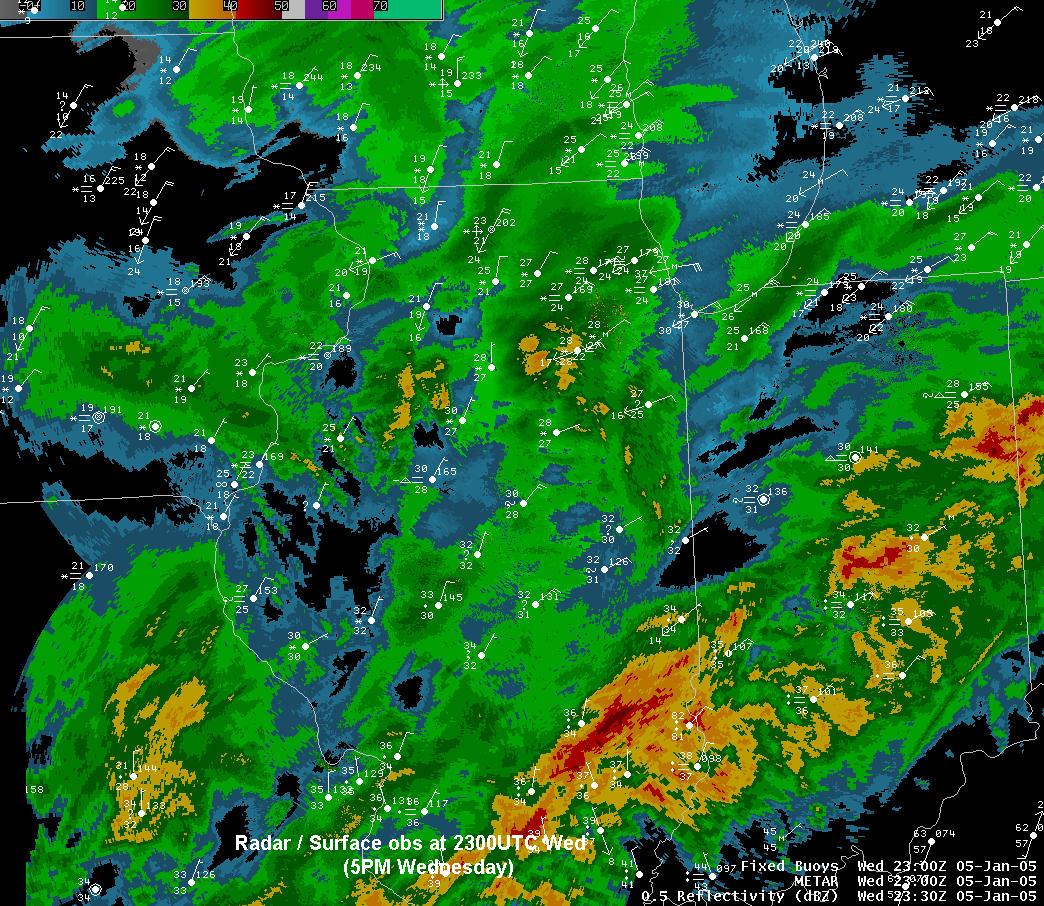
One of the considerations in assessing potential for an event (rain snow or otherwise) is to evaluation contributing forcing mechanisms. The strong thermal field and mixed precipitation regime are one aspect. Another is to determine whether more synoptic scale forcing will come into play. One of the usually suspects is jet related upper divergence with facilitates rising motion through the column. A short term forecast (6hrs) of 300mb winds and associated divergence valid at noon (1800UTC) Wednesday revealed that indeed there was a contribution form this source. A retreating jet from Lake Superior eastward was interacting with another working into southwest Iowa and northwest Missouri. Dynamics between the two would create a pool of ventilating divergence over most of Illinois and Indiana. Further, another pool was evident over eastern Kansas associated with the southern jet. This could be expected to swing northeast during the next 12-18hrs and provide another round of snow/rain etc during the night. The radar/observational composite at 2300UTC of the 5th (Wednesday 5PM) does indeed show pockets of more organized return in southern Wisconsin/northern Illinois and central Iowa.
The final reality check in the series is at 0000UTC of the 6th (Wednesday 6PM) with the KILX/KDVN sounding. Further cooling is evident in both from 12 hours earlier but a warm pocket still remains at KILX.
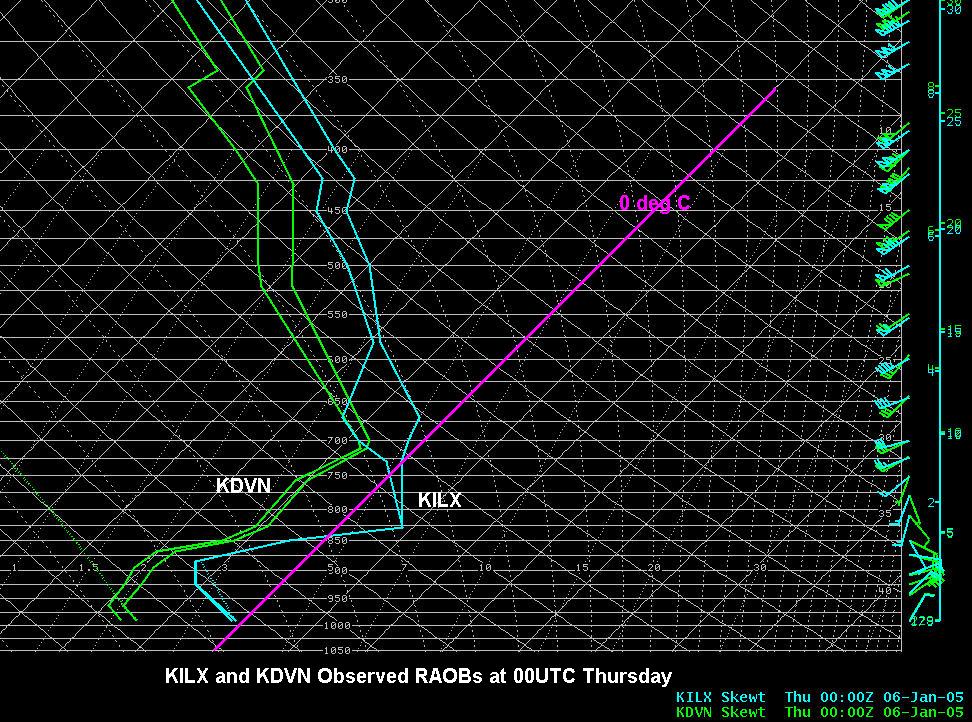
00 UTC sounding of January 6
The previous concern about potential dynamic jet level forcing was coming into play now with the 06/0000UTC initialized fields indicating an even stronger jet streak approaching from the southwest (Missouri) and very well organized divergent pool working across northern Illinois and southern Wisconsin. A side impact from such rising motion in the column would be additional cooling which would shift the rain/snow line further south during the night…which is what occurred.
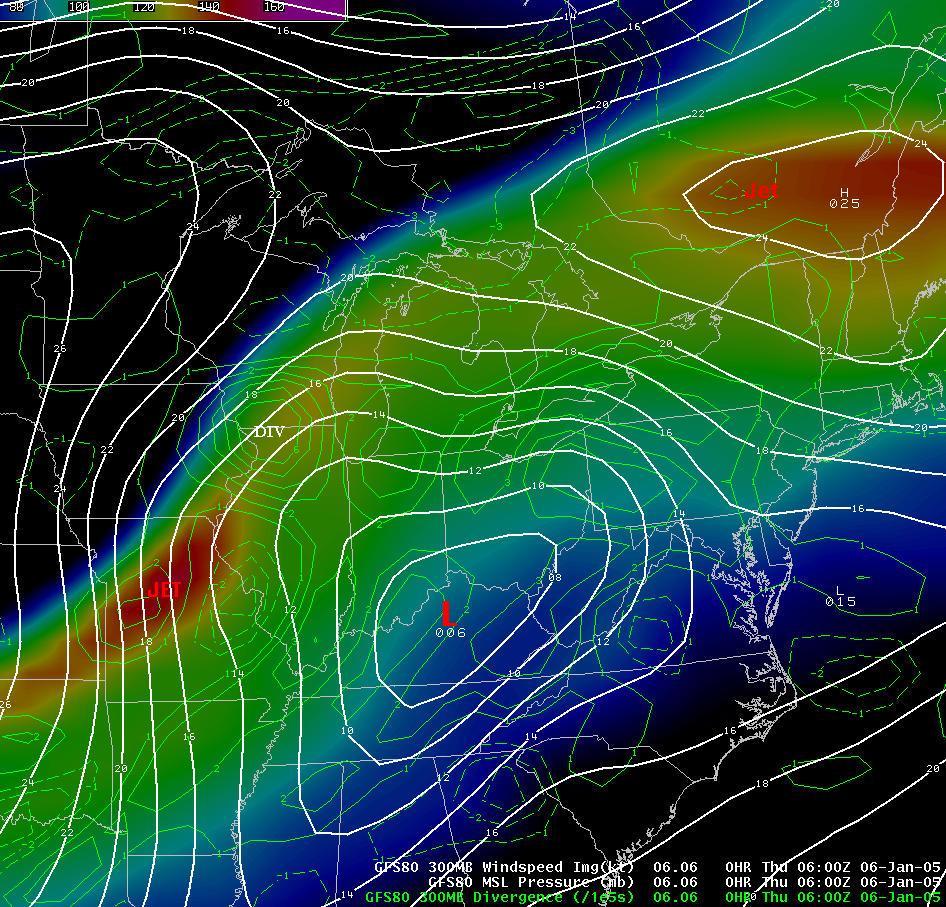
00 UTC jet streak on January 6
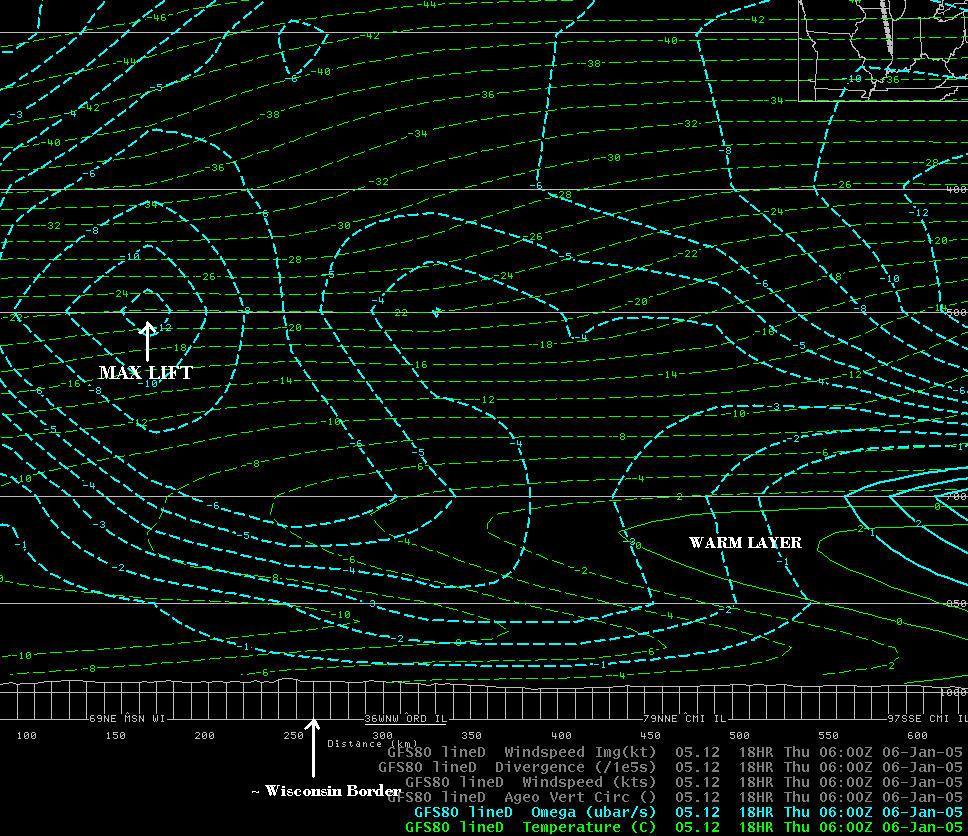
A north-south (forecast) cross section valid at 0600UTC of the 6th gives an appreciation of the vertical structure of both the rising motion field and residual thermal inversion (warm pocket) further south. Even though this image is an 18hr forecast it is quite good and supports the later data which suggested southern Wisconsin would receive a more active snow period during the night. The reality of it all is seen in the composite radar/observation display at 0900UTC of the 6th (Thursday 3AM). The circle highlights the most intense snow.
|
Forecast cross section valid at 06 UTC on the 6th |
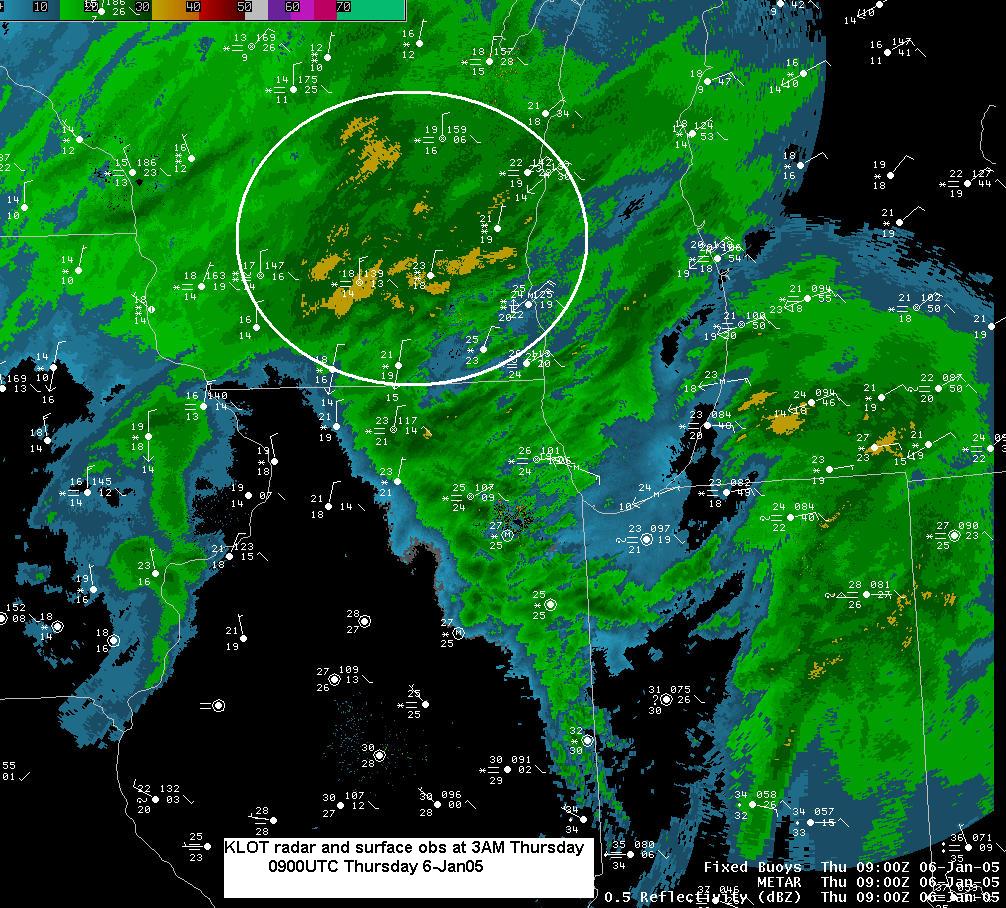 Composite radar at 09 UTC on the 6th |
Given the complexity of the situation and its long duration model guidance was reasonably good. Low level thermal fields are the key to anticipating mixed or changeable precipitation regimes. Periodic sounding data and continuous aircraft temperature soundings from ORD allow monitoring of structural changes in the lower atmosphere as well as a reality check for model guidance.

