Introduction:
At 715PM on December 8, 2005 a Southwest Airlines jet skidded of a runway at Midway Airport while attempting to land in a snow storm. The plane came to rest at an intersection at the northwest corner of the airport. One person in a car was killed.
The snow storm had begun during the early afternoon and affected all of northeast Illinois and northwest Indiana. Storm total snow of 3 to 6 inches was widespread except for a narrow zone extending from around Midway Airport westward into northern Will County where upwards of 11 inches of snow was recorded. The most intense snow occurred between 5PM and 6PM when the snowfall rate at Midway was nearly 3 inches per hour. A complete summary of Midway observations between 153 PM CST and 830 PM CST details the intensity of snowfall and accumulation on the ground.
Investigation of conditions contributing to the formation of this band and insights as to why the snow intensity peaked just prior to the airline incident reveal a combination of events which came together simultaneously for a short period over this area. It demonstrates how interaction between somewhat independent features can produce an enhanced event when coincident.
Synoptic Environment:
During the day of December 8 a well defined upper level cyclone was moving across the Missouri River into southern Iowa. At 08/1800 UTC this low was near KOMA and featured a well defined jet streak (red) working into central Illinois from southern Missouri. The surface low was well to the south over western Tennessee with an inverted trough extending north into eastern Iowa.
By 09/0000 UTC the upper system was near KUIN while the attendant complex surface low had developed northward into the mid Ohio River valley beneath the mid level jet streak. An inverted trough continued to be present across northeast Illinois in an area of marked diffluence aloft as noted in the 500 mb height analysis.
The thermodynamic environment was represented by RAOB soundings from KDVN and KILX at 9/000 UTC. The zone below 900mb was well capped by an inversion at around 850 mb. This is particularly true at KDVN (yellow). The wind differential between the two site reflect the location of each relative to the system. Moist layer depth at KILX is also shallower than at KDVN. Later satellite images will clarify the observed variations.
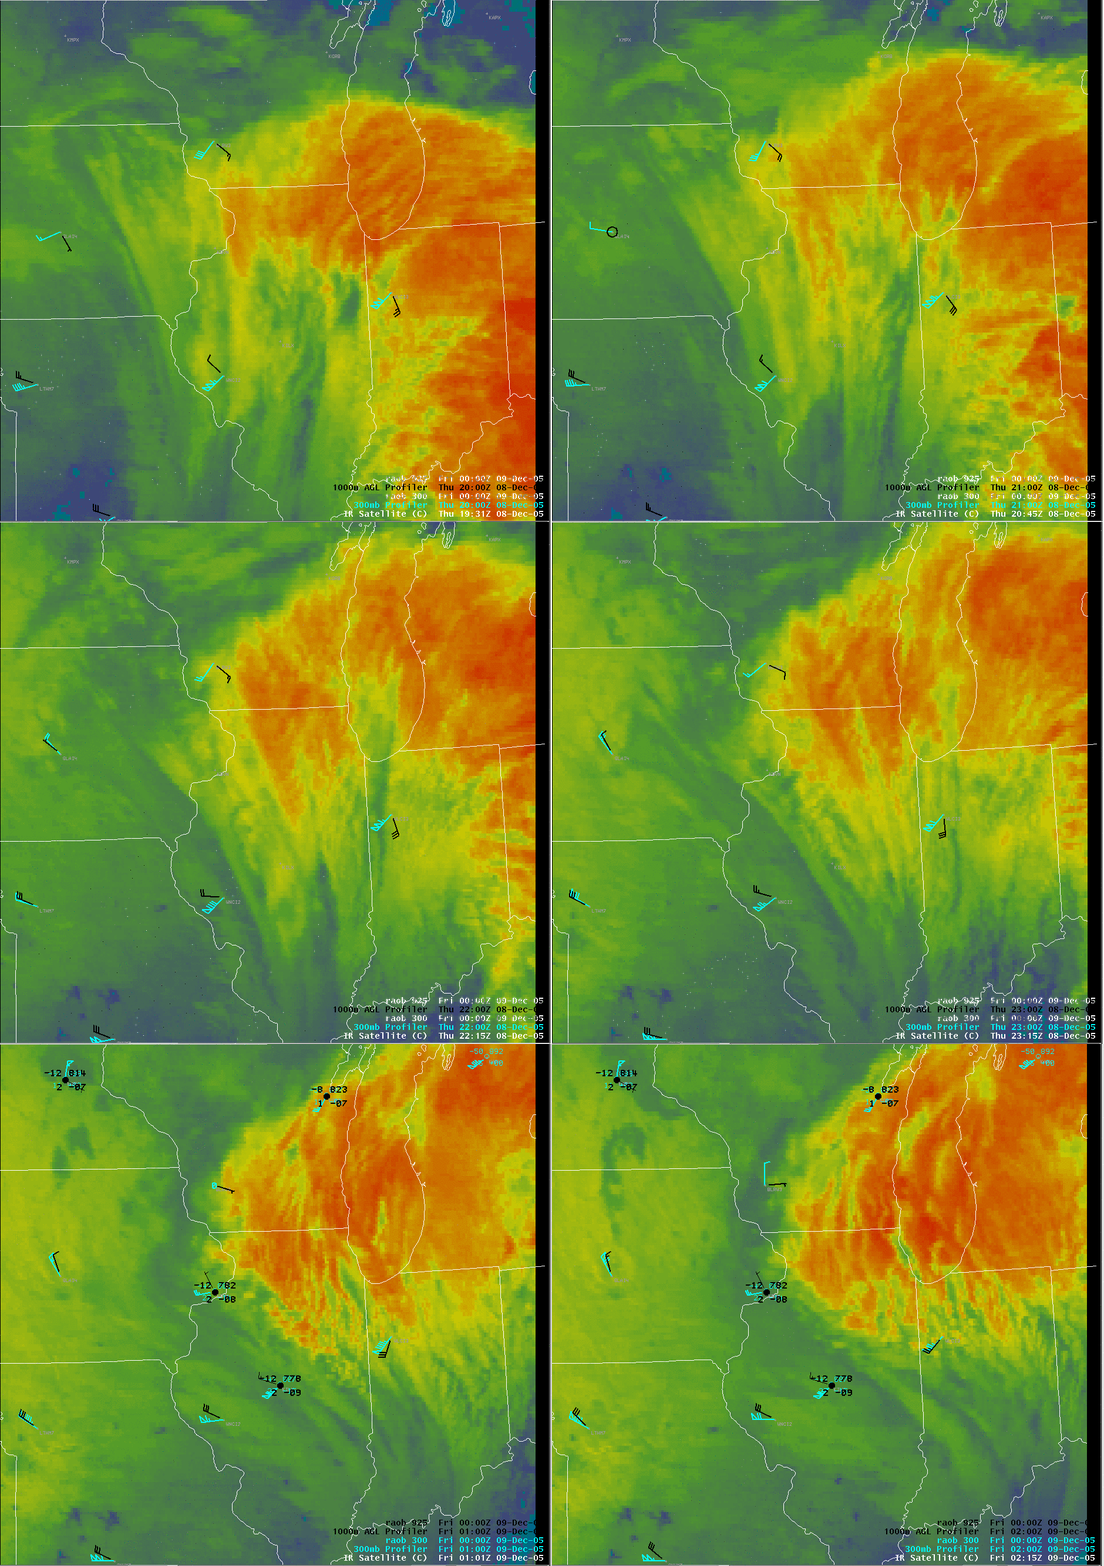
An overview via animation of the satellite imagery between 08/1931 UTC and 09/0215 UTC provide a sense of evolution of the upper air features. Profiler data at 300 mb and 1000 m as well as RAOB data (from 09/0000 UTC) at 300 mb and 925 mb are superimposed. A number of observations can be made from this loop.

An overview via animation of the satellite imagery between 08/1931 UTC and 09/0215 UTC
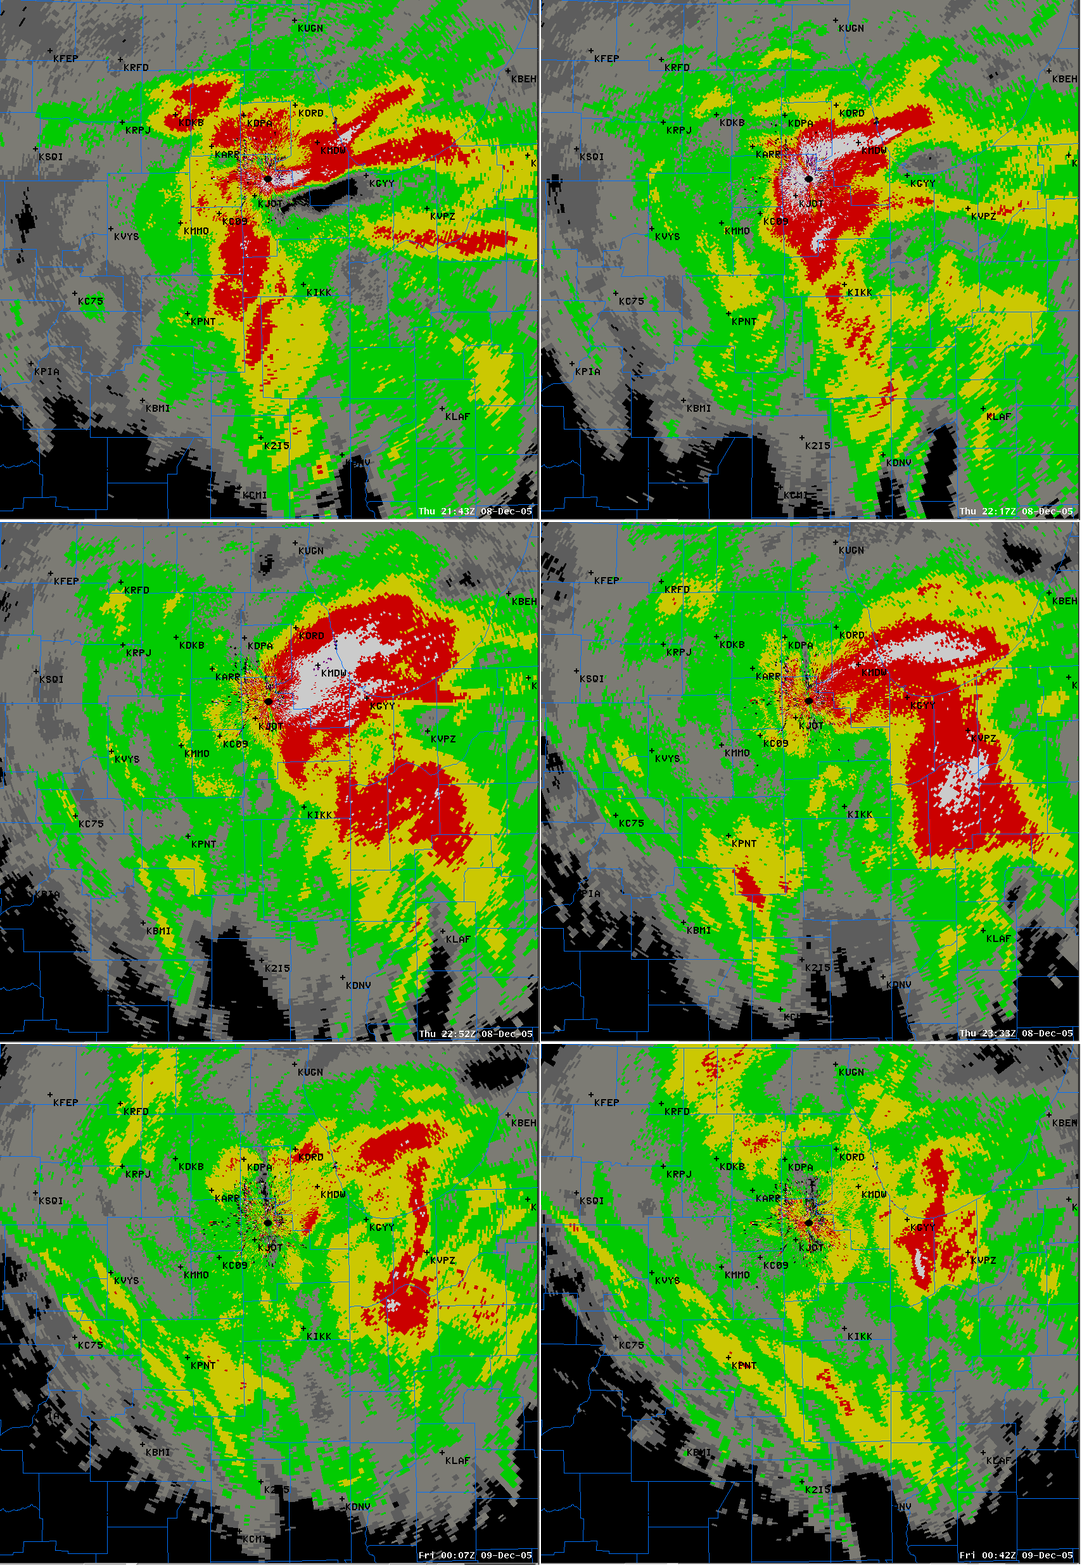
The KLOT radar imagery animated between 08/2143 UTC and 09/0042 UTC provide a clear indication of the evolution of snow bands across the Midway Airport (KMDW) – Will County area. Red values are 25-30bDz, white 30-35dBz.

KLOT radar imagery animated between 08/2143 UTC and 09/0042 UTC
The motion clearly reflects the satellite indication of a trend toward negative tilt of the system. The E-W enhanced reflectivity band from KMDW-northern Will county had developed over southern Will County about and hour prior to the start of the animation. This band has (at least) 3 characteristics: a) it and subsequent bands died out before making it north of central Cook County; b) it interacted with another enhanced band…with a N-S orientation…which approached from the southwest; and c) subsequent echo bands continued to move into or toward the southern Cook-northern Will county area during the latter part of this sequence.
Given the revelations of the reflectivity animation one can readily see why the maxima of snowfall occurred where it did. Let us now investigate some of the details.
Mesoscale Factors:
Against the backdrop of the synoptic scale forcing above, smaller scale conditions were instrumental in focusing snowfall. In is not uncommon in enhanced events of any type to find a number of coincident processes or alignments which interact to produce the observed conditions.
Using the 08/2100 UTC RUC40 as the source of analysis and short term forecast, we first examine the 2100 UTC low level [defined here as 900-850mb layer average] atmospheric state. In response to the upper level vortex moving into southwest Iowa a tongue of enhanced saturated theta-e air was being drawn into northeast Illinois and northwest Indiana. It can be seen as the yellow-red-green shaded image portion of the analysis. Overlaid on this thermodynamic field is the corresponding layer averaged ageostrophic wind, wind divergence and 3-hr pressure falls.
2100 UTC low level atmospheric state
An axis of convergence (negative divergence) from KLAF in western Indiana to just south of MDW. The maxima of pressure falls is virtually coincident…just south of KMDW. The pressure fall pattern is potentially important for two reasons: a) it infers the area of strongest warm advection aloft (warmer air is less dense) and b) it induces a mass adjustment which can be reflected in subsequent convergence.
At 2200 UTC the ‘best’ theta-e air extends from KMDW to the south and east. The 3-hour pressure fall maxima aligns very well with the convergence axis over Kankakee and Will Counties. Note (and compare with 2100 UTC) the response in the ageostrophic winds. They now, at 2200 UTC, strongly reflect the location of the convergence axis. Comparing these developing fields to the actual radar imagery and remembering the radar returns likely reflect a slope to these processes above the beam, offers a realistic relationship between the diagnosed processes and observed return.
2200 UTC 900-850 mb layer
The next hour, 2300 UTC, finds the same alignment of forcing…just shifted a tad further north. The ageostrophic component of the 900-850mb wind field is now solidly confluent and convergent across southern Cook County into northern Will County. Radar returns prior to this point and subsequent to 2300 UTC (for a couple hours) reflect the convergent nature of echoes approaching KMDW from the south and east.
2300 UTC 900-850 mb layer
By 09/0000 UTC we see the moist theta-e air beginning to retreat to the east while the convergence zone sits right over KMDW. The pressure fall center is also slipping to the east. Just one hour later, at 09/0100 UTC, the ageostrophic wind pattern has lost its convergent nature while the convergent axis edges off to the north.
The greatest snowfall rate at MDW occurred between 2300 UTC and 0000 UTC.
Observations during this late afternoon high intensity snowfall period also noted the ‘large’ size of the snowflakes. Often this can be an indication that lake effect snow processes are involved. Proximity ACARS temperature profiles at KMDW and KORD (O’Hare Int’l Airport) show the traditional benchmark 850mb temperature at around -5 degC. Surface lake water temperatures were around +3 deg C making the 8 deg C difference shy of the traditional -13deg C standard. Easterly winds at MDW were also no more than 15kts in the boundary layer. The direction suggests a very restrictive fetch over water. While some enhancement from Lake Michigan cannot be totally dismissed there is evidence that another mechanism was more influential.
In addition, the KORD profile reveals a very marked veering signature between about 800 mb and 600 mb (outlined) suggesting a zone of strong warm advection. This is occurring exactly within the temperature zone (-12C to -18C) where snowflake growth can be maximized. In fact the plane was ascending from O’Hare toward the south adding further credence to the sampling near the heaviest snow [ The green line in the ’bulleye’ at the upper left of the image is the plane track. The center of the bullseye is O’Hare]
KORD profile
Part of the synoptic environment was characterized by the trend, at this time, for the upper trough to realign itself in a negative tilt. This was driven by the strong {130-150kt) upper jet working through the Ohio Valley. The IR satellite image of this at 09/000 UTC also clearly shows a series of SSE-NNW striations moving northeastward across northeast Illinois. (refer to movie clip).
Closer examination of these bands adds another dimension to the story. An IR satellite image at 2125UTC combined with 300mb profiler and raob (0000 UTC) data offers an insight to the magnitude of the lateral wind shear within this system. Wind speeds of 80-115kt from central Illinois into west central Indiana drop off to 25kts at KDVN. At this time a series of cloud bands is approaching MDW.
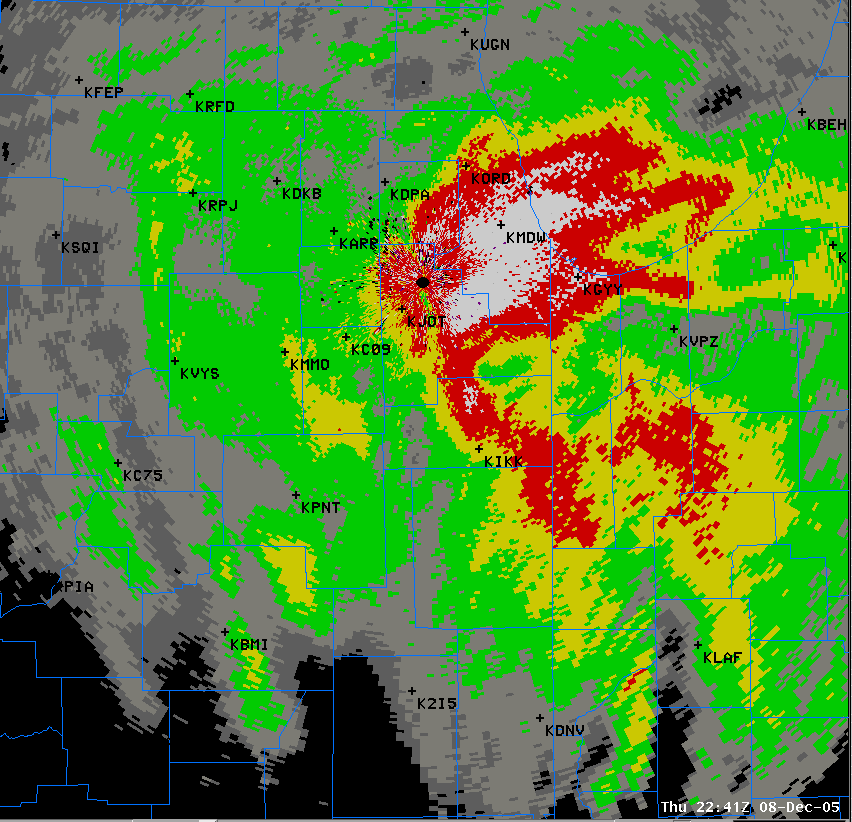
By 2301 UTC one of these bands (A-A’) was over western Will County. Correspondingly the WSR-88D reflectivity image at 2241UTC showed an enhanced SSE-NNW area moving east toward the prepositioned zone over MDW. The radar return appears to be a reflection of the feature seen in the satellite imagery.
IR Satellite image at 2301z |
 Radar image at 2241z |
During the next 45 minutes the band noted as A-A’ in the 2301 UTC image expands and cloud tops cool. By 2345 UTC cloud tops have cooled 2-3 deg C from 2301 UTC and become better defined. During this interval snowfall intensity maximized at MDW. The 2321 UTC radar image distinctly shows the axis of enhanced reflectivity over MDW extending westward toward the radar site.
Proximity in time and space of satellite cloud top cooling and expansion, corresponding movement of radar returns and resultant increase in snow intensity over the target area strongly suggests that increased cloud depth and seeding from higher synoptically related cloud bands was instrumental in creating enhanced snowfall.
Concluding Thoughts:
Enhanced banded snowfall is not an uncommon feature of winter storms. Often it is attributed to slantwise convective processes (CSI). There was no clear evidence of that here. Other processes can result in similar focusing of snowfall. These can include, among others, lake enhancement, terrain, barrier jets and ageostrophic circulations related to low level jets. Proximity aircraft derived thermal profiles via ACARS from KORD and KMDW suggest lake effect processe were negligible due to the lack of temperature contrast between air and water....and implied short fetch over water due to wind direction.
The case of December 8, 2005 was notable in that the enhanced banding occurred over a major airport and was a contributing factor in a fatal aircraft incident by Southwest Airlines. Intense snowfall of up to 3” per hour in a period of about 1 hour prior to the incident may have impacted the ability of the airport to maintain runway composure.
In a purely meteorological sense this event highlighted the ability of the atmosphere to combine multiple processes and circumstances into a scenario which produced marked albeit small zone of magnified snowfall from MDW into northern Will County.
The evidence suggests the following contributing factors:
It appears then that the juxtaposition in time and space of processes noted in #3 and #5 were highly instrumental in creating the observed band of snow which fell across southern Cook and northern Will counties during the late afternoon and evening of December 8, 2005.