|
Damaging Winds at Rockford and Around Chicagoland During the pre-dawn hours of July 5th northern Illinois was buffeted by a line of thunderstorms which caused widespread damage around Rockford and scattered wind damage in scattered areas of the Chicago metro region. While radar signatures offered some classic signals concerning the potential for damaging winds analysis revealed other atmospheric parameters were likely involved in supporting the vigorous observed winds. The most severe damage occurred around Rockford shortly after 4AM CDT with widespread power outages and other related wind damage. The strongest unofficial wind reported was 104 mph. Damage included large trees, power lines and a local TV tower. Over 80,000 people were without power for various durations after the storm. This event occurred at the beginning of a prolonged period of active weather for northern Illinois and much of the Midwest. On this night a band of thunderstorms had moved along the Illinois-Wisconsin border during the evening while another line trailed across eastern Iowa. This second line is seen from the KDVN (Quad Cities) radar at 0820 UTC (320 AM CDT) as it extended from just east of Galena to the Quad Cities region. A sounding launched by the Quad Cities NWS office after midnight (0600 UTC) showed a modestly unstable profile with CAPE values of 2275j/kg and a lifted index of -7. The profile itself had a generally uniform west southwest wind field below 20,000 ft. Three distinct dry pockets were evident as low as 950mb. The boundary layer inversion and lowest two wind observations confirm the convection was elevated (not surface based).
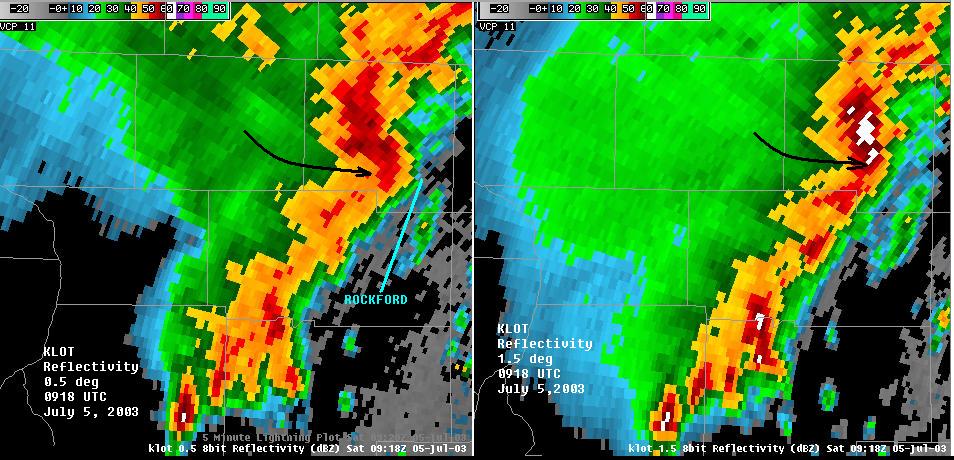
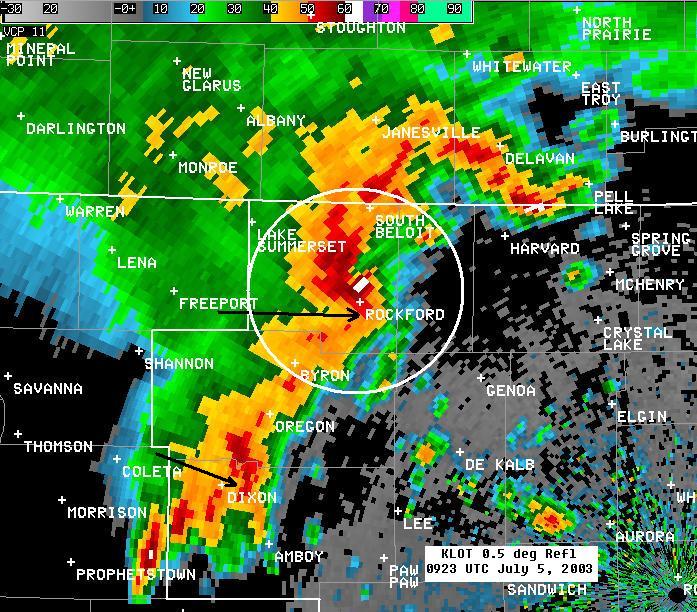
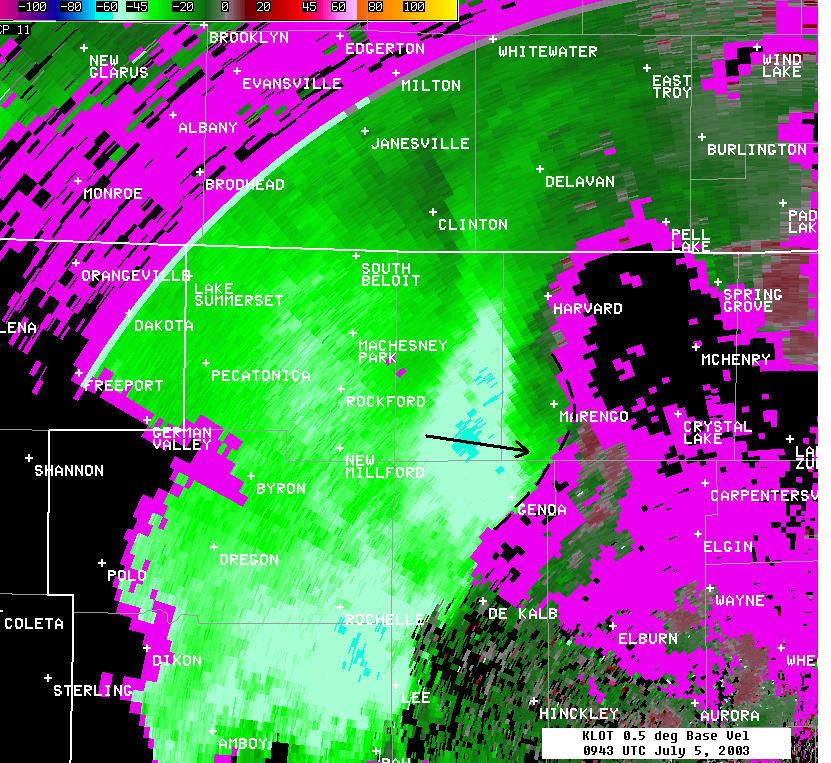
RADAR Reflectivity at 0820 UTC was characterized by a line of embedded thunderstorms none of which, at first glance, appeared to pose a defined threat. This changed shortly as by 0835 UTC wedge of minimum reflectivity had developed in southeast JoDaviess County. Such a notch can suggest a wind acceleration beginning into the rear of the line (rear inflow notch, RIN). The RIN can be induced by any number of dynamic or thermodynamic factors including a changing environment, mid level evaporation (in dry air) and steepening lapse rates. By 0856 UTC the evolution of the RIN with the line becomes clear as a marked bowing structure races through Freeport. The thunderstorm core over central Stephenson County and associated bow are taking on a classic (HP) supercell character where the rain pattern is being driven by the wind field. A view from the KLOT radar at 0908UTC also captures the ‘S’ shape of the supercell. The strongest winds are moving through southwest Winnebago County toward Rockford. The brunt of the storm struck Rockford about the time of the 0918 UTC (418AM CDT) reflectivity image. Slices at 0.5 deg (~5500ft ft agl) and 1.5deg (~11,500 ft agl) are depicted. The bowing segment is readily apparent. We can also note the return at 1.5 deg is much more intense than the lower elevation. The corresponding base velocity image at 0918 UTC reveals a maximum inbound velocity at 0.5 deg of ~71 knots or 82 mph detected just west of Rockford. Further south in northwest Lee county another maxima of near 60 knots is observed but clearly the primary threat is the cell entering Rockford. At 0923 UTC the leading edge of the storm was on the Winnebago-Boone county line moving east at over 60 mph. Further south just east of Dixon in Lee County a similar RIN arc is developing in the reflectivity image. Moving ahead to 0943 UTC the Rockford storm is racing through southern McHenry County producing reported winds to 60 mph along with tree damage. The storm in northeast Lee County also has a RIN signature and bubble of wind maxima in the base velocity. The reflectivity also suggests while there are two bowing segments the convective line is maintaining a solid structure. The line continued its march through the Chicago suburbs with a well defined leading edge and numerous ragged zones trailing. This ragged appearance often reflects areas of active subsidence (eroding clouds) and implied stronger winds. By 1044 UTC (544 AM CDT) the line was moving through the Loop, southern Cook County and eastern Will County. Base velocity at this time show pockets of enhanced winds (red, outbound) extending the length of the leading edge of the line. Scattered wind damage was reported with its passage although not as extensive as in the Rockford vicinity. While this line of storms produced a wide zone of wind damage, clearly the worst and most concentrated damage occurred around Rockford and sporadically eastward through Boone, McHenry and Lake counties. It was associated with the development of a defined supercell entity. Detailed examination of the data indicates the maximum damage coincided with an intensification of the reflectivity over Winnebago and Boone counties.
Environmental Changes In the hours prior to 0600 UTC (0300-0600 UTC) flight level aircraft data from ACARS disclosed a band of strong winds across southern Iowa into northern Illinois. These were along the southern flank of a broader jet which ran from northeast Nebraska into western Wisconsin. It reflect the extent of the higher level wind support available to the convective cells. What was striking, however, was the KDVN sounding at 1200 UTC (likely released close to 1100 UTC). Contrast it to the 0600 UTC sounding which reflected the environment ahead of the destructive convective line. The profile at 1200 UTC incorporated any changes with passage. The column has noticeably dried out and winds have increased significantly with 50 knots observed as low as 800mb. Upstream at the Slater Iowa profiler near Des Moines the winds showed a marked increase around 0600 UTC and this same sequence was repeated at the Blue River profiler site in southwest Wisconsin about the time of the Rockford event. (profiler winds are hourly averages) Continuity of these sources suggests an accelerated wind field worked across eastern Iowa and interacted with the convective line already near the Mississippi River. The rapid development of a RIN and spin up of the supercell east of Galena is too coincidental with the inferred location of this speed maxima to be unrelated. The drying seen in the DVN profile at 1200UTC must be at least partially the result of forced subsidence. In attempting to understand the sequence of events that were observed one must rely on antidotal evidence such as character change in the convection and related increase in threat levels. While environmental winds were modest to begin with (20-35kt) and pockets of dry air likely would have resulted in scattered wind problems. The organization of the Rockford storm as well as its intense nature infers that an additional ingredient in the form of enhanced mid level winds were a probably contributing cause of the significant wind storm which affected Winnebago County and adjoining communities. Subsequent expansion of the cold pool (via evaporation) related to other convection along the line was a factor in extending the destructive wind zone further south. |

