|
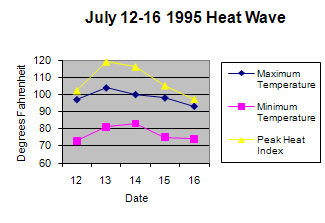
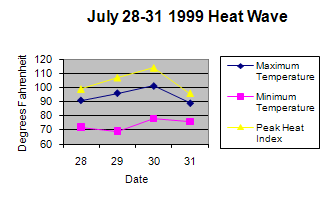
Brief Review of the Extreme Heat Episode in Chicago During the latter few days of July 1999 an unusually intense heat episode occurred over northern Illinois including the Chicago metropolitan area. It was the most intense heat to affect the region since the tragic episode of July 13, 1995 when over 600 persons died due to heat related factors. In that case daytime temperatures peaked at 105 degrees with heat index values approaching 120. In the July 29-31 case actual air temperatures did not climb to record levels but the humidity, as measured by dew point and indirectly by the heat index (HI), remained at extreme levels for an extended period. A persistent west wind through this period negated any development of a lake breeze. In fact, with a west wind heat from the 'city' (meaning the Loop area) was blown toward the lake shore making the coastal observation site at Miegs field the highest consistent heat index location! In addition, Midway airport is located in a heavily populated portion of south Chicago. Due to widespread pavement and other heat retaining surfaces temperatures and heat indices here often are the highest (peak) measured in the area. One of the results of the 1995 heat event was the development of close communication ties between the NWS and the City of Chicago to keep them abreast of significant weather occurrences. Because of physical and societal differences in the heavily populated urban city, heat related concerns are a high priority. Criteria were developed specifically for the City of Chicago which, when exceeded, would trigger responses from city officials and planners. In the case of July 29-31 these criteria were well exceeded. Temperature and heat index values for July 29th reveals the extent of the intensifying heat and it's relation to the more urbanized areas. Data from airport sites in and around the more populated areas of Chicago show a heat index value rising above 100 degrees around noon and staying there for the most part through midnight. The peak was 120 at Midway at 3PM. In contrast locations away from the city such as Aurora, DuPage and Rockford (airports) also had heat indices above 100 shortly after noon but they fell back in more of a diurnal cycle after 8PM. Peak readings at these sites were also lower than near the city. Dew point temperatures remained excessively high through the evening, climbing to 82 degrees at Midway at midnight, reflecting the more stable airmass near the surface! The 82 degree dew point was the highest ever recorded at a Chicago reporting station. Two additional factors made the onset of this heat event notable. The first is that during the predawn to mid morning hours of July 29th dense fog covered much of the suburbs outside of the city of Chicago. Only after this burned off did the mercury rapid rise begin. Second, the airmass became extremely unstable with the intense heating and high dew points. Lifted index values over northwest Illinois were calculated at -16. Positive energy (CAPE) values were measured at over 7000J/kg. These instability parameters are indicative of potentially explosive thunderstorm development. None occurred. Skies remained essentially clear. Aircraft sounding data showed a very steep lapse rate though most of the airmass below about 15000 ft. There is some evidence of weak subsidence within about 2000 ft of the surface. This low level subsidence may have been a key feature during the extreme heat event of July 1995. July 30th continued the string of very high heat indices especially in the urban zones. The temperature chart for this day indicates the HI remained at or above 100 at the Lakefront through the night, the day and past midnight. A little statistical relief was seen at Midway and O'Hare but was of no consequence. Not until 2 AM of the 31st did the Lakefront HI dip below 100 degrees. This marked a duration of 37 continuous hours with a heat index at or above 100 at Meigs Field (Lakefront). A quick comparison with surrounding reporting sites on this day again show a more diurnal cycle to the heat although peak values still reached 115. During the afternoon of the 30th one can see a marked drop in dew points at all reporting stations. This was due to drier air aloft mixing down with daytime heating. This mixing, however, also resulted in a rise in temperature with Midway reaching 104 degrees, two shy of the all time mark set in July 1995. Relief from the extreme HI values finally arrived during the predawn hours of July 31st. While the mercury continued to hover in the mid to upper 80s the dew point had drifted down into the middle 70s. Even through most of this day, however, the HI remained above 90 especially at Midway Airport where it took until after 7 PM that evening to slide below this level. As a comparison, the Heat Index charts for the July 13, July 14 and July 15 1995 heat episode show similar lengthy periods above 100 at O'Hare Airport. What is reflected here was likely exceeded at Midway and Meigs Field. In that case a persistent west wind also made the interior city much hotter than surrounding suburbs. The death toll related to heat during this 3 day event for the City of Chicago will likely exceed 90. This heat episode capped off a month which tied or broke a few other July marks. July 1999 was the 5th hottest July on record with an average of 78.4 degrees, July 1995 was the 8th warmest with an average of 77.6 degrees, and the all time hottest July was 1955 with an average of 81.3 degrees. These marks are all the more significant because a record low temperature of 53 was set on July 12th and factored into the monthly average.
Please see the web address; http://www.nws.noaa.gov/om/heat/index.shtml for additional information on extreme heat events and precautions to take against them. |