Louisville, KY
Weather Forecast Office
 |
| April 11, 2007. New Albany, IN. Duke Marsh |
Forecasts issued by the National Weather Service routinely include a "probability of precipitation" statement (sometimes abbreviated as "POP" or "POPS" in our forecast discussions). For example:
.TUESDAY...MOSTLY CLOUDY WITH A 30 PERCENT CHANCE OF SHOWERS AND THUNDERSTORMS. HIGHS IN THE UPPER 60S.
What does this "30 percent" mean?
Probability of precipitation describes:
So, in the example above, there is a 30% chance that at least 0.01" of rain will fall at the point for which that forecast is valid over the period of time given ("Tuesday" in this case). The time periods given in our forecasts are typically 12-hours long. The "Tuesday" period, for instance, is from 7am EST to 7pm EST (8am to 8pm EDT) on Tuesday. "Tuesday night" would run from 7pm EST (8pm EDT) Tuesday evening to 7am EST (8am EDT) Wednesday morning.
On our web site's homepage, there is a clickable forecast map. When you click on the map, a personal forecast is generated for the spot on which you clicked. The probability of precipitation that is given in the forecast is valid only for that spot (technically a 5 kilometer square grid around that spot). Click on a different location on the forecast map, and you will probably get a slightly different forecast.
Let's look at a graphical example of probability of precipitation.
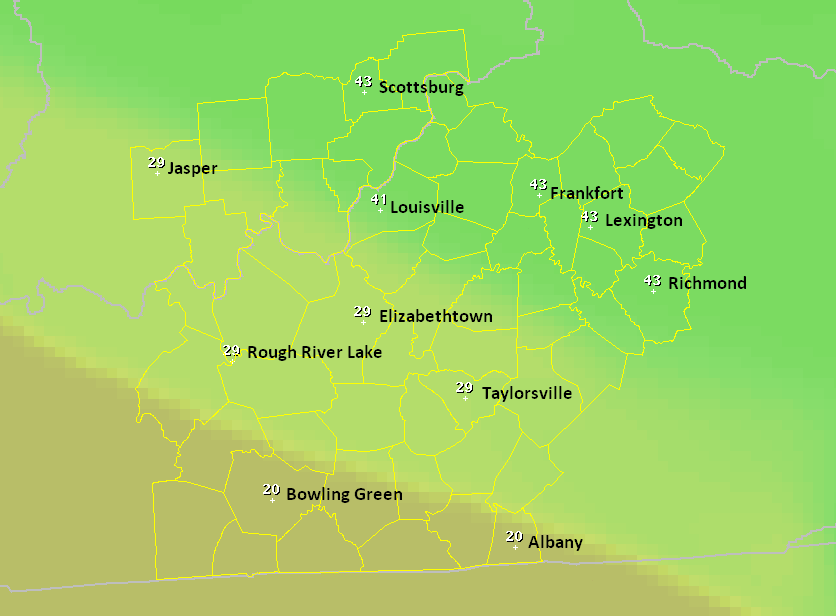 |
This map shows the area that is under the responsibility of the Louisville National Weather Service office. The forecaster has drawn probabilities of precipitation across the region. It is in this way that each click on our clickable forecast map can give a unique forecast to that location. Looking at a point on this graphic will tell us the probability of precipitation at that point. So, for example, there is a 20% chance of precipitation at Bowling Green, a 41% chance of precipitation at Louisville, and a 43% chance of precipitation at Lexington over the 12-hour period that this graphic covers. These graphics are also available on our web site. |
|
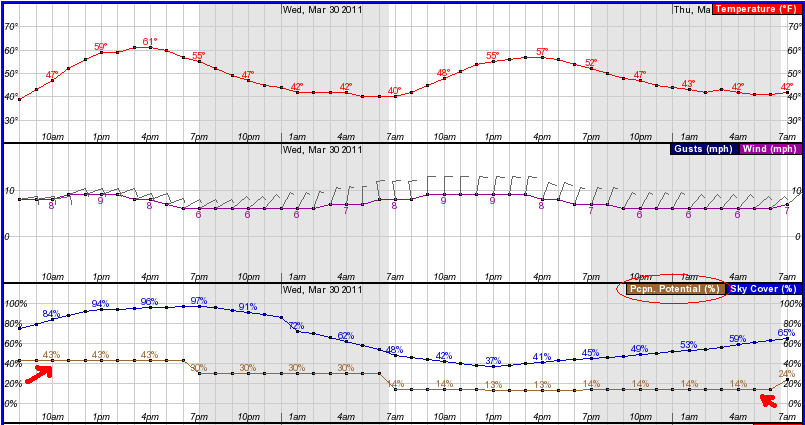
To look at it another way, you can also view precipitation probabilities on a graph. To do this, click on the clickable forecast map, as described above. On the forecast page that appears, scroll down to the bottom, and in the table in the lower right corner of the page click on Hourly Weather Graph. You will then see your forecast displayed on a graph, like the example shown below. |
 |
Current Hazards
Hazardous Weather Outlook
Storm Prediction Center
Submit a Storm Report
Advisory/Warning Criteria
Radar
Fort Knox
Evansville
Fort Campbell
Nashville
Jackson
Wilmington
Latest Forecasts
El Nino and La Nina
Climate Prediction
Central U.S. Weather Stories
1-Stop Winter Forecast
Aviation
Spot Request
Air Quality
Fire Weather
Recreation Forecasts
1-Stop Drought
Event Ready
1-Stop Severe Forecast
Past Weather
Climate Graphs
1-Stop Climate
CoCoRaHS
Local Climate Pages
Tornado History
Past Derby/Oaks/Thunder Weather
Football Weather
Local Information
About the NWS
Forecast Discussion
Items of Interest
Spotter Training
Regional Weather Map
Decision Support Page
Text Products
Science and Technology
Outreach
LMK Warning Area
About Our Office
Station History
Hazardous Weather Outlook
Local Climate Page
Tornado Machine Plans
Weather Enterprise Resources
US Dept of Commerce
National Oceanic and Atmospheric Administration
National Weather Service
Louisville, KY
6201 Theiler Lane
Louisville, KY 40229-1476
502-969-8842
Comments? Questions? Please Contact Us.


 Weather Story
 Weather Map
 Local Radar