Overview
|
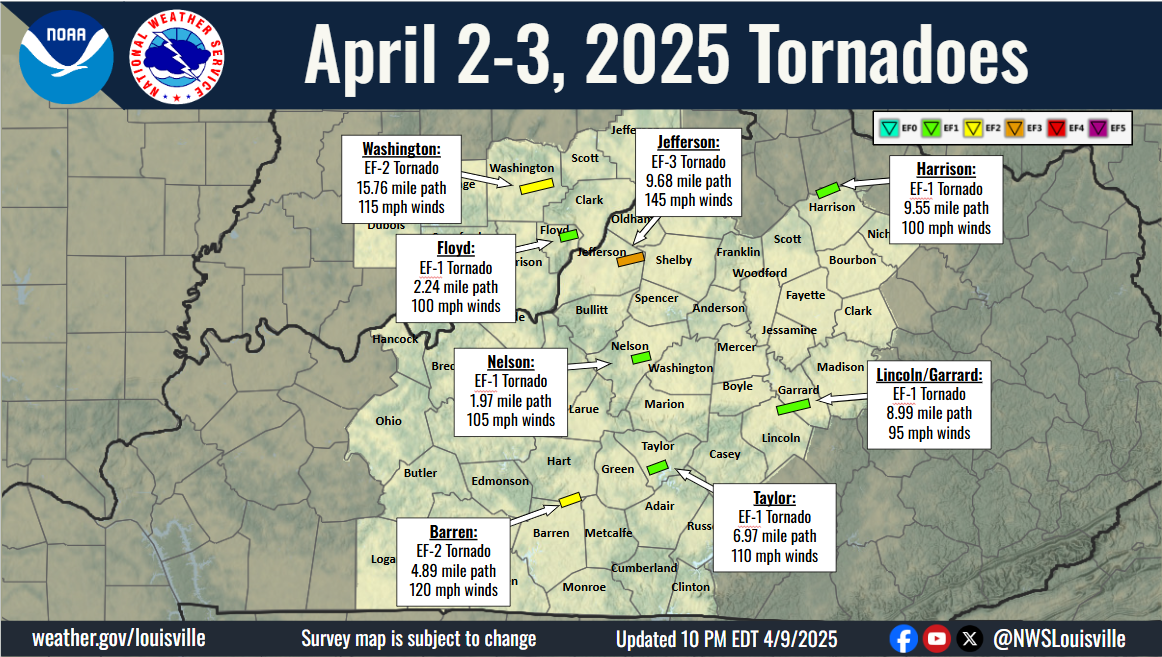
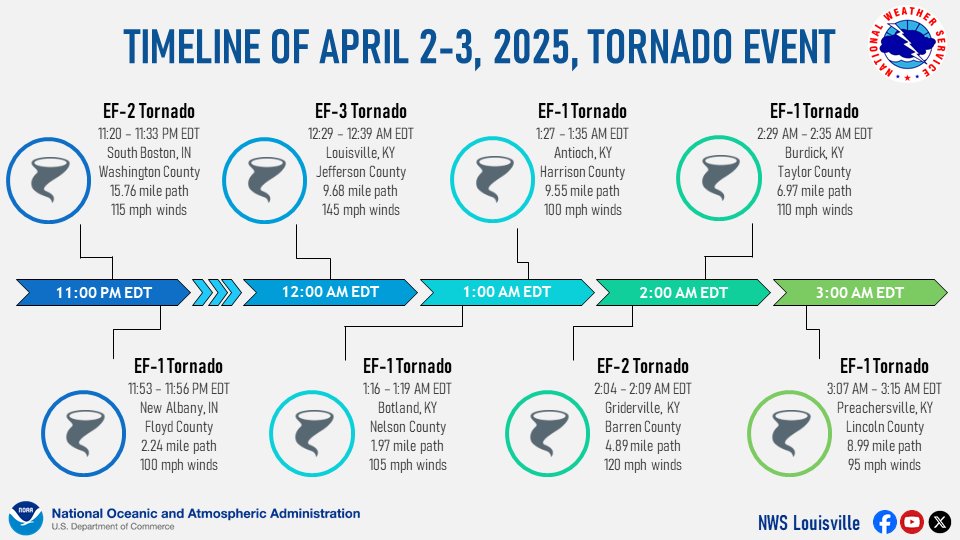
On the night of April 2nd, 2025, a cold front approached the lower Ohio Valley. Along and ahead of the cold front, numerous supercells developed over southern Illinois and western Kentucky. These storms tracked eastward and occasionally grew upscale into a QLCS with bowing segments. Storms lasted all night and into the morning hours, as the cold front began to stall over the lower Ohio Valley. These storms left behind a wake of damage in many counties in southern Indiana and central Kentucky. Over the next few days, waves of showers and storms rode along the cold front bringing lots of rain which lead to widespread flash and areal flooding. Showers and storms came through daily, until the evening of April 6th. Later, this flooding turned into historic and near-record breaking river flooding along many river basins. Overall, 8 tornadoes touched down from late evening into the overnight on April 2nd and 3rd, including one EF-3, two EF-2's, and 5 EF-1's. Many additional pockets of wind damage occurred, as well as widespread areal and flash flooding through late week into the weekend. Some river crests were historic, including a new record crest at Camp Nelson on the Kentucky River and the #2 all time crest at Frankfort. The crest at McAlpine Upper on the Ohio River was #8 all time.
|
|
 |
 |
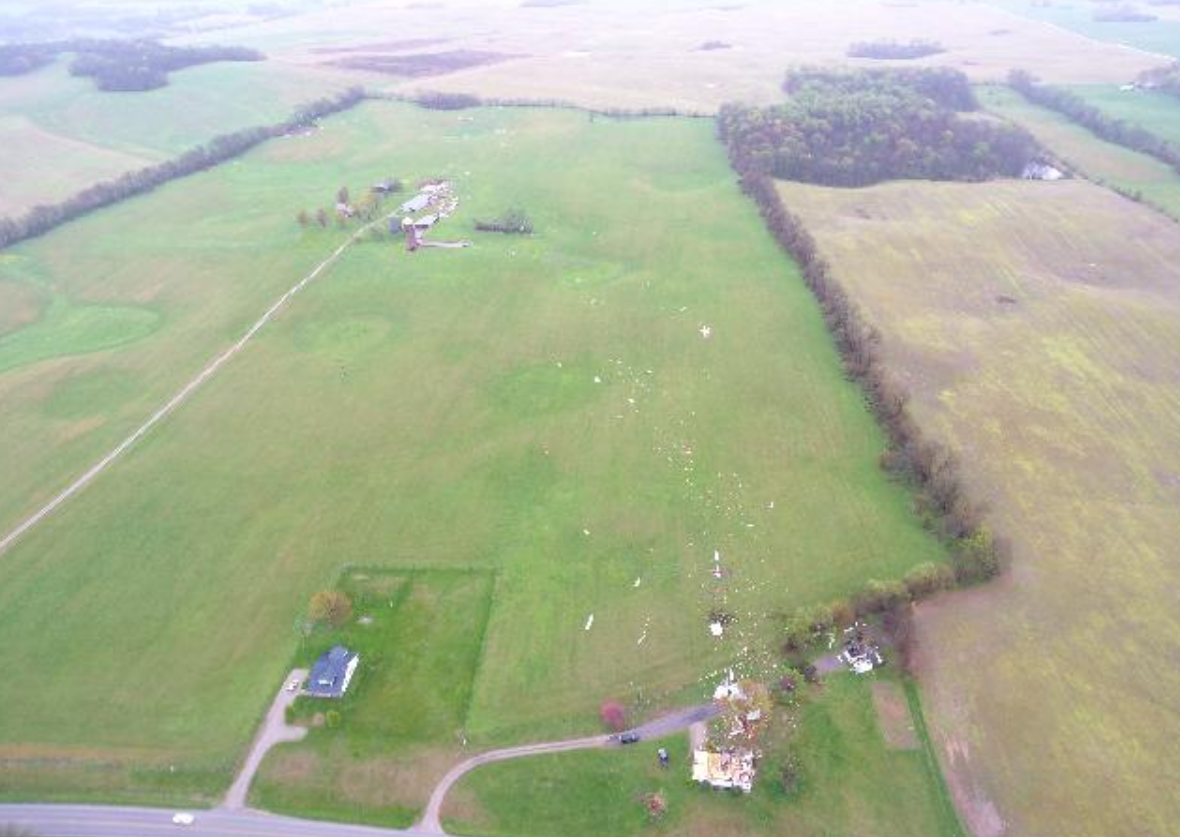 |
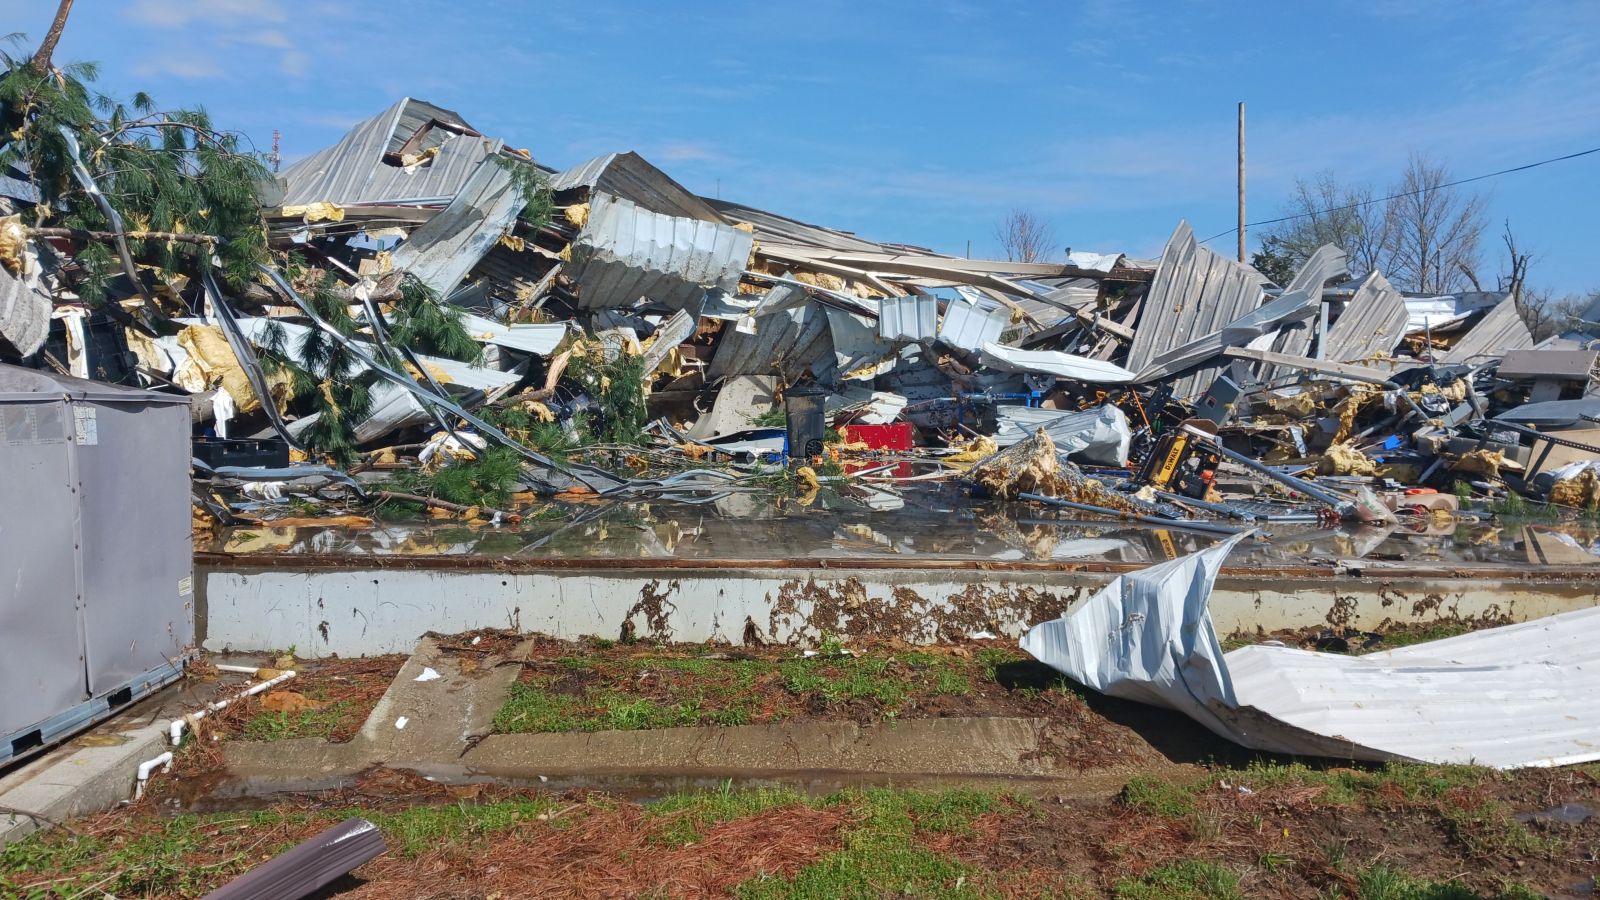
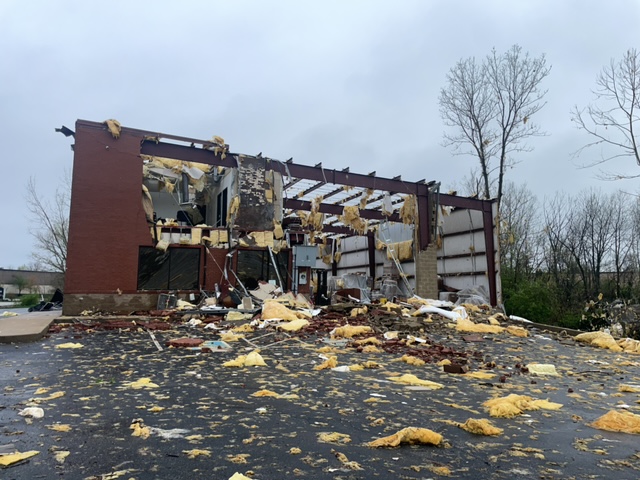
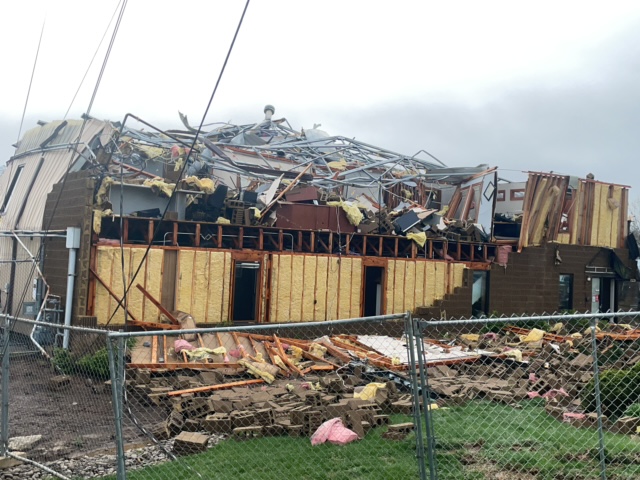
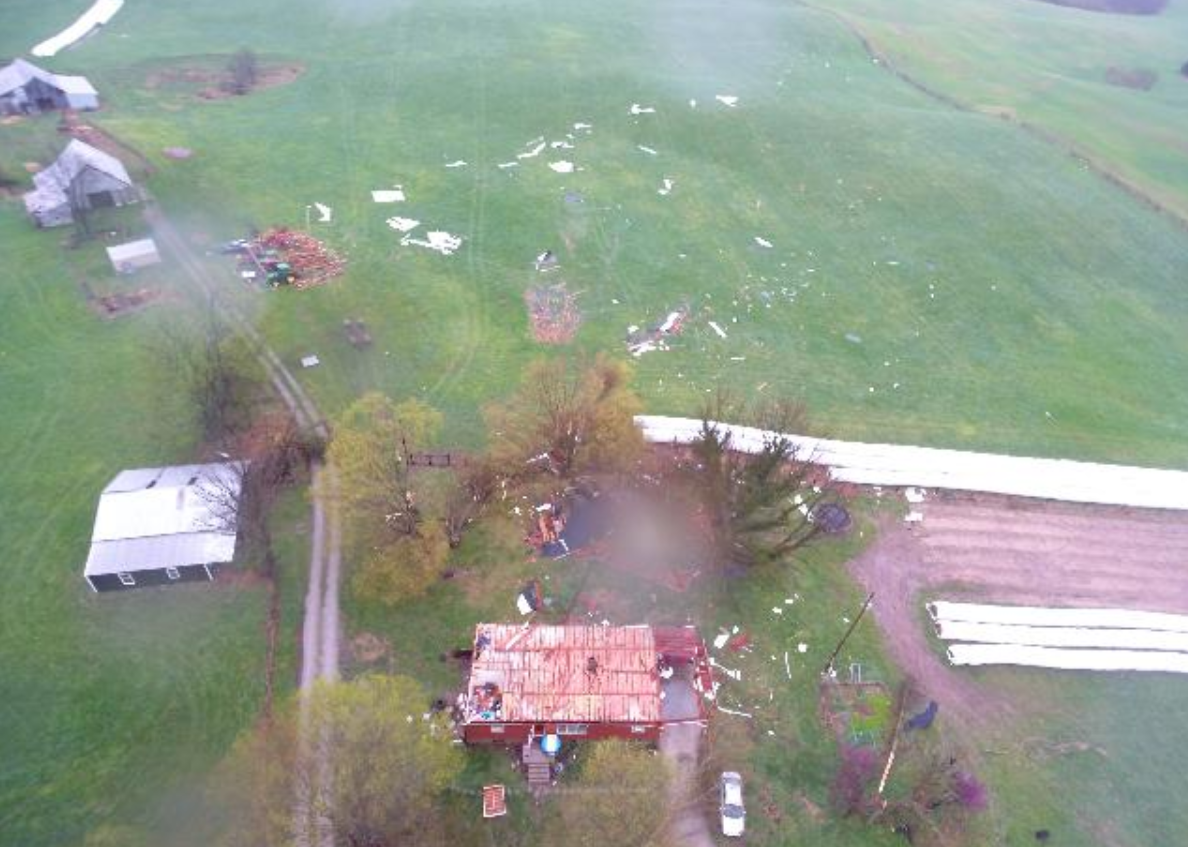
| A destroyed business from the Jeffersontown EF-3 tornado. | A mobile home was thrown and completely destroyed in the Washington county IN EF-2 tornado. | NWS Louisville drone picture of heavy roof damage scattered downwind during the Barren county KY EF-2. |
Tornadoes
|
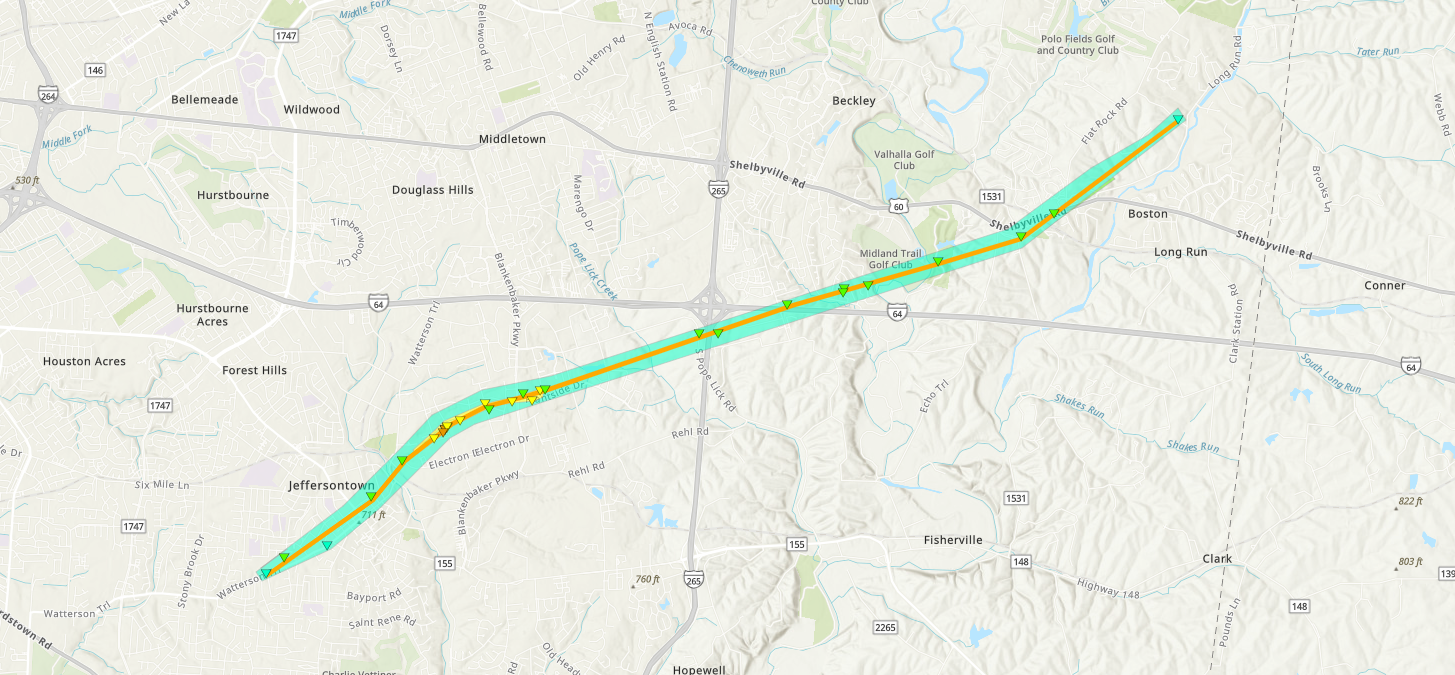
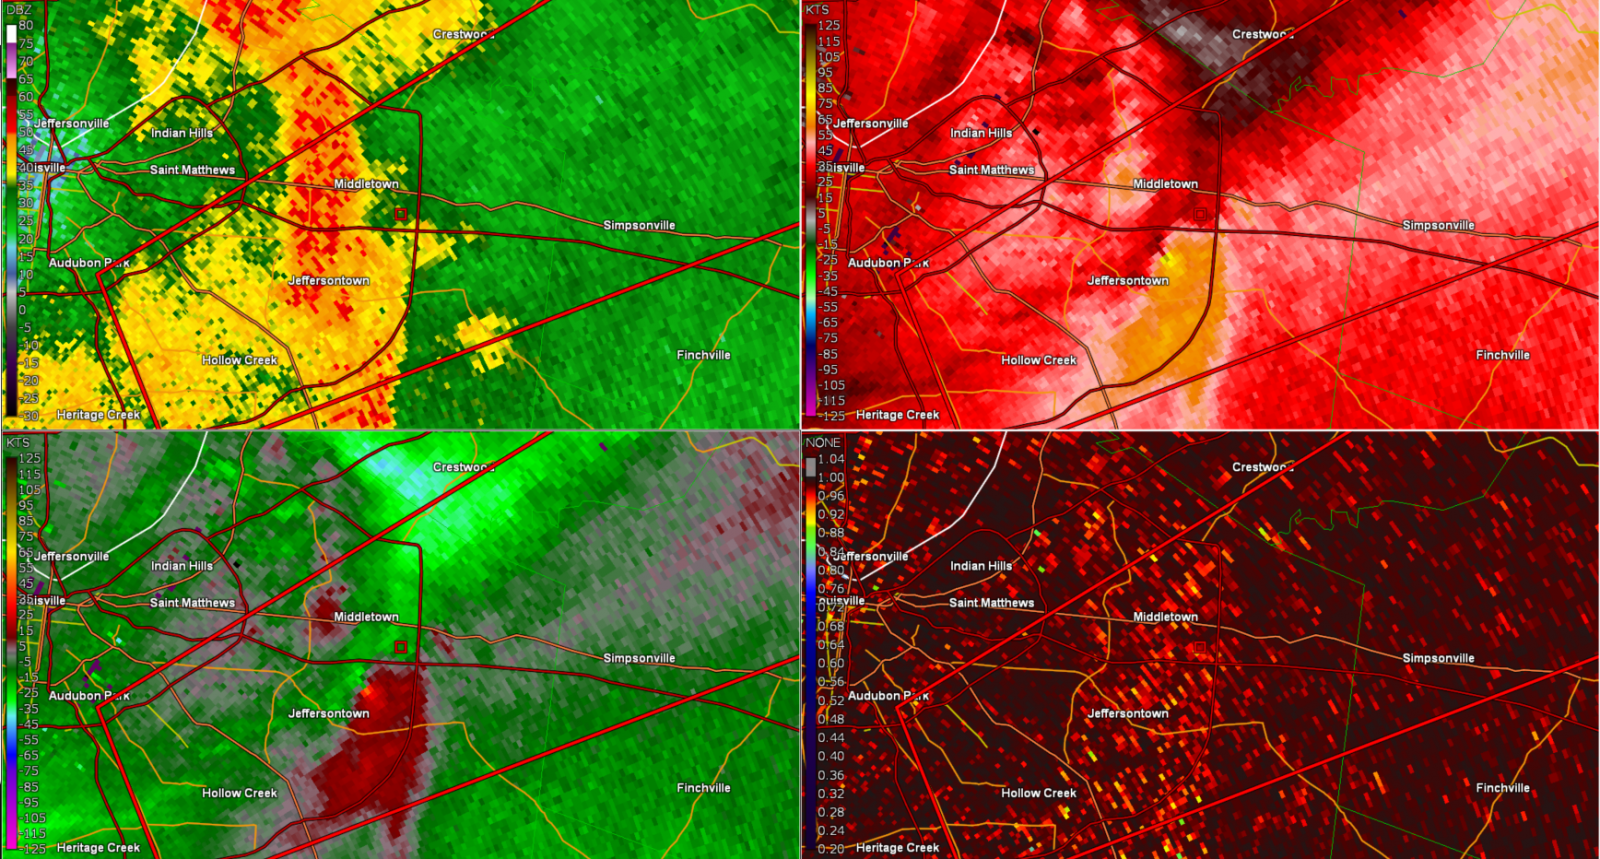
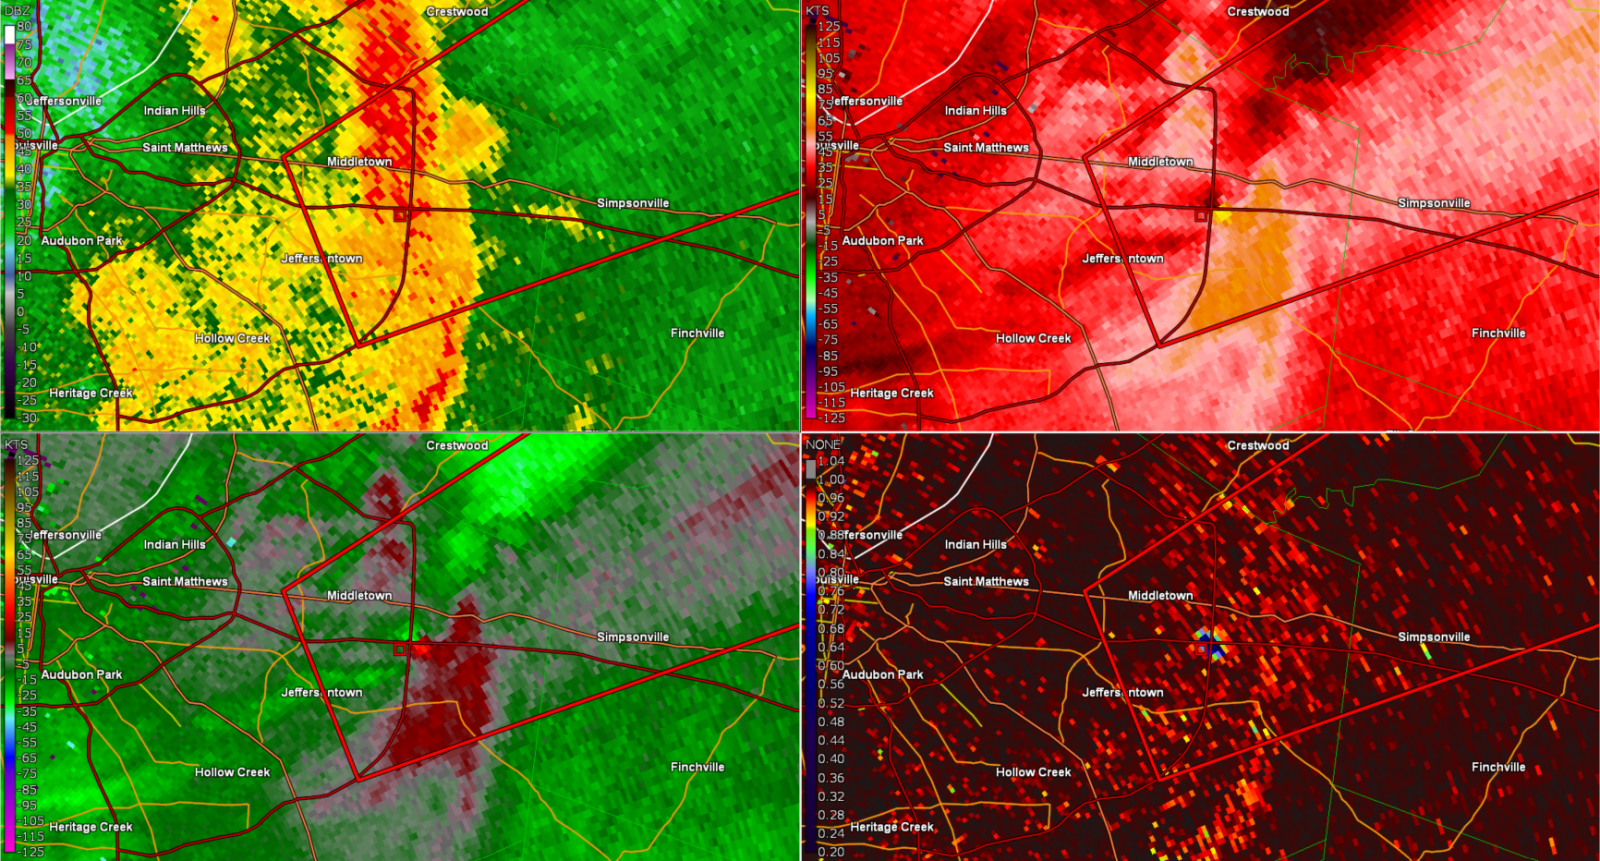
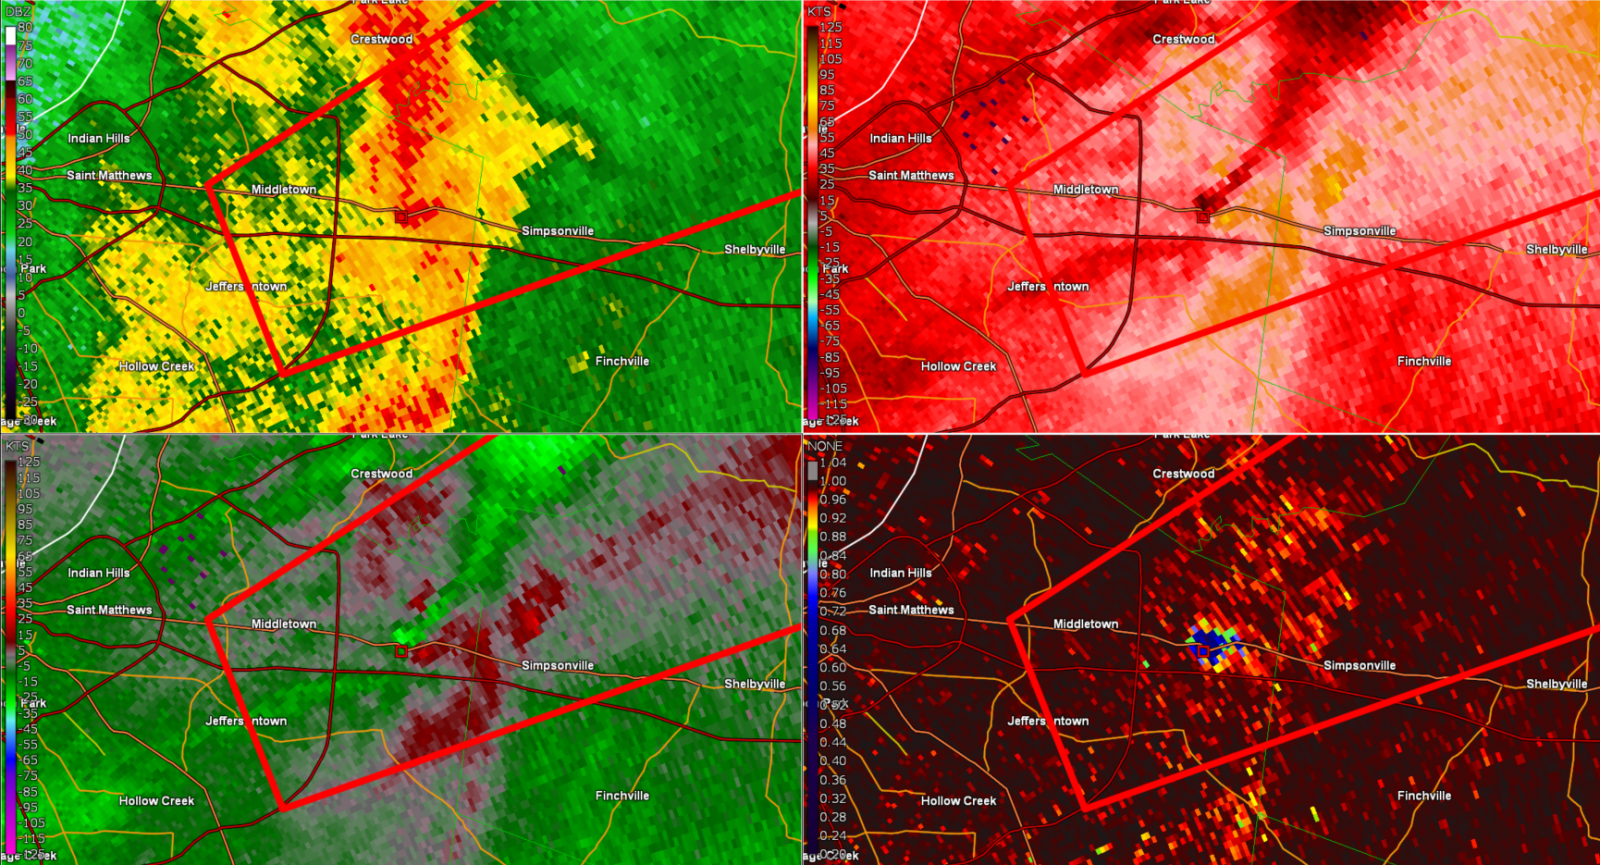
Tornado - East Louisville
|
||||||||||||||||
|
||||||||||||||||
|
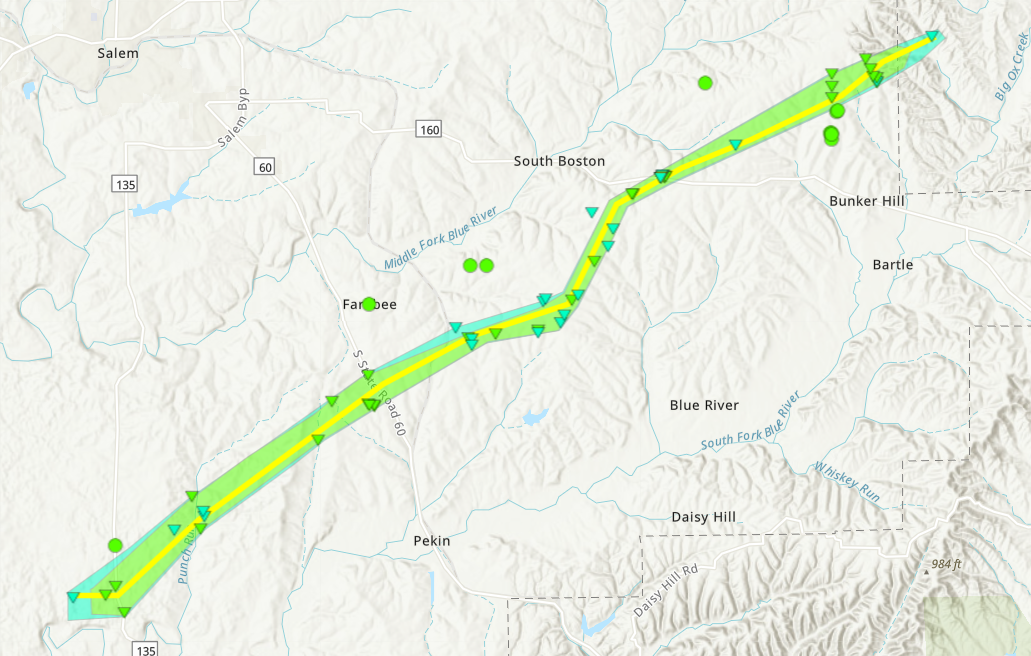
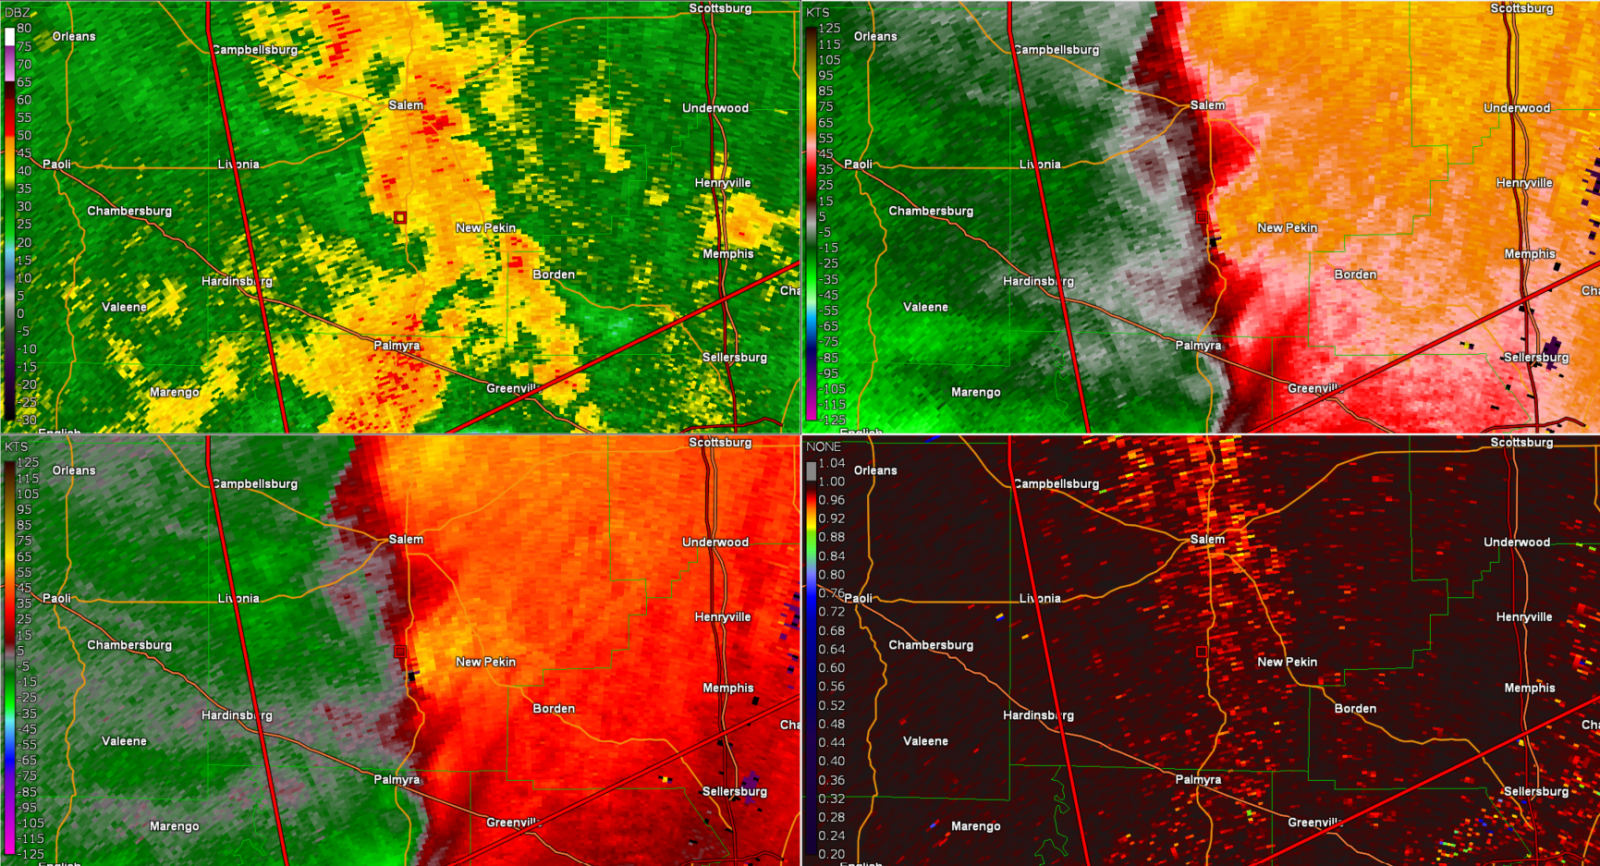
Tornado - Shorts Corner/New Salem
|
||||||||||||||||
|
||||||||||||||||
|
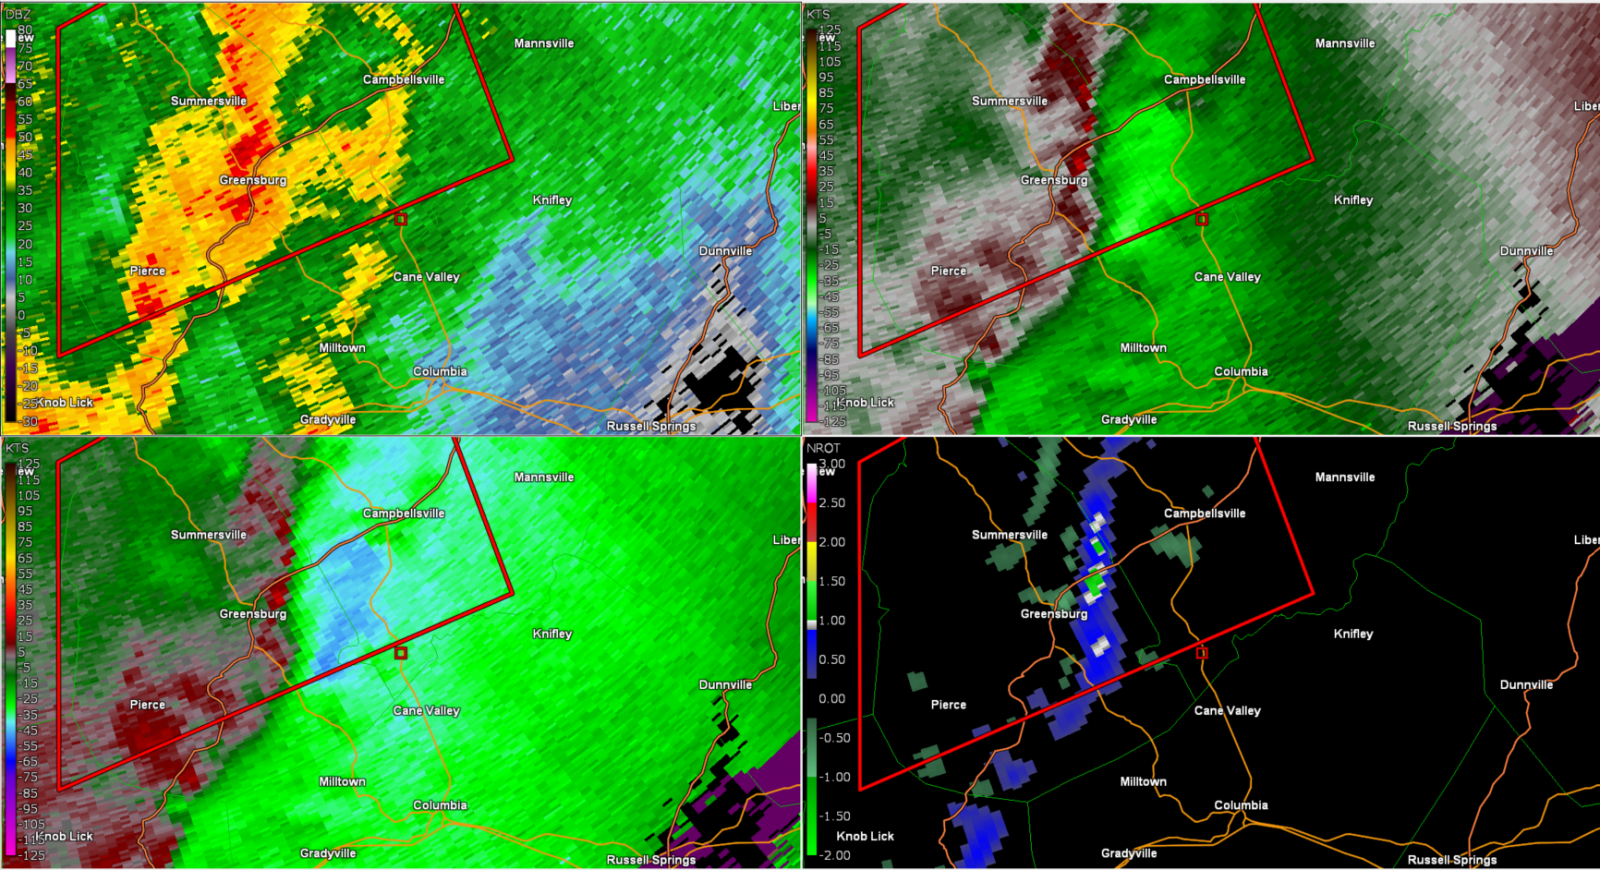
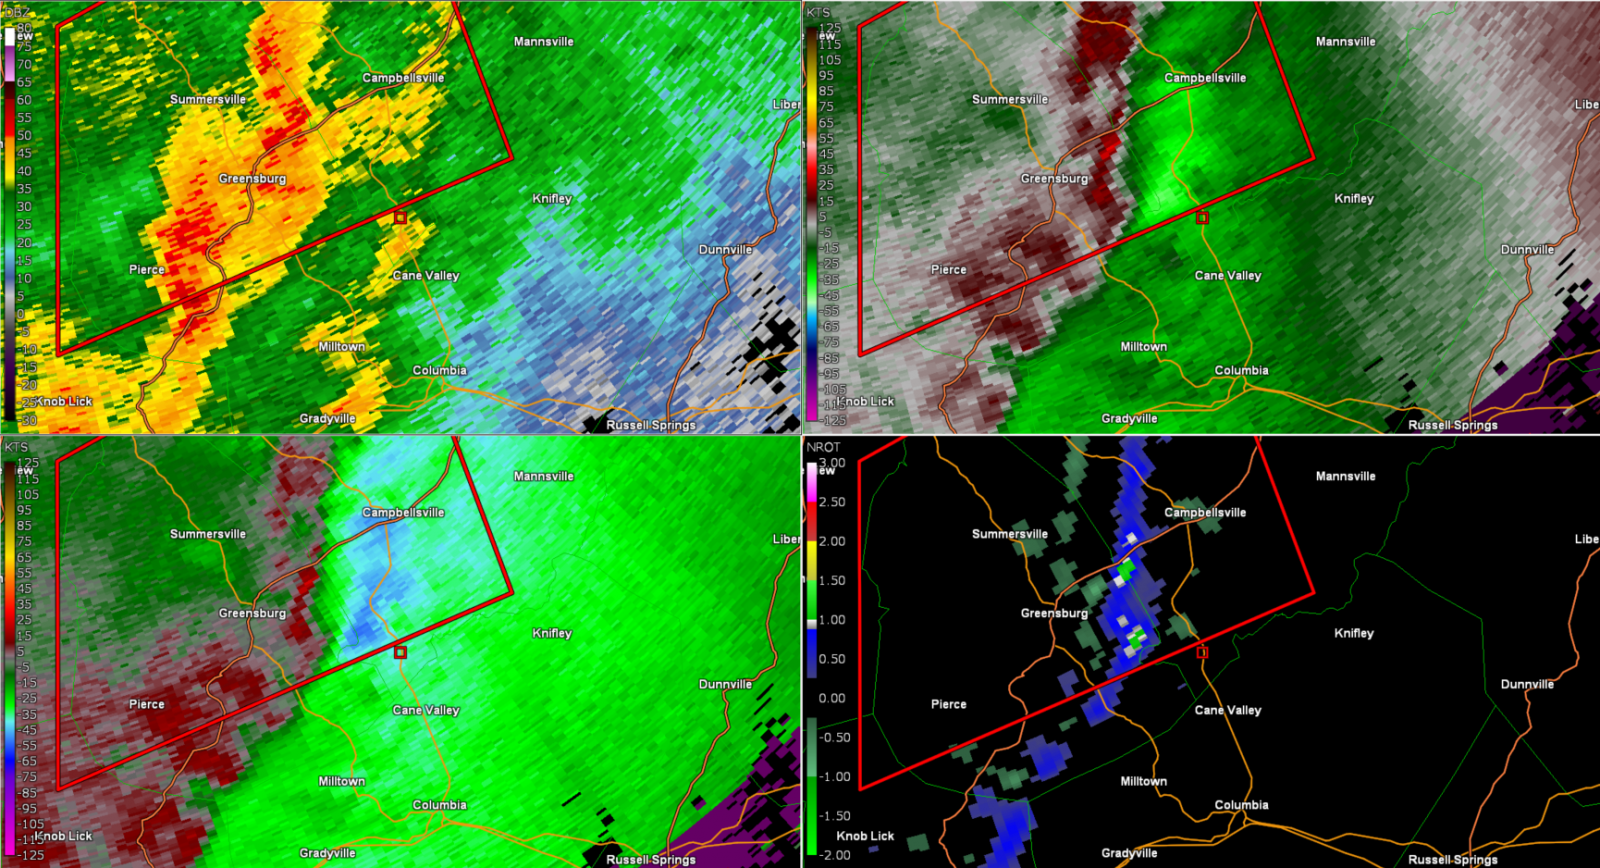
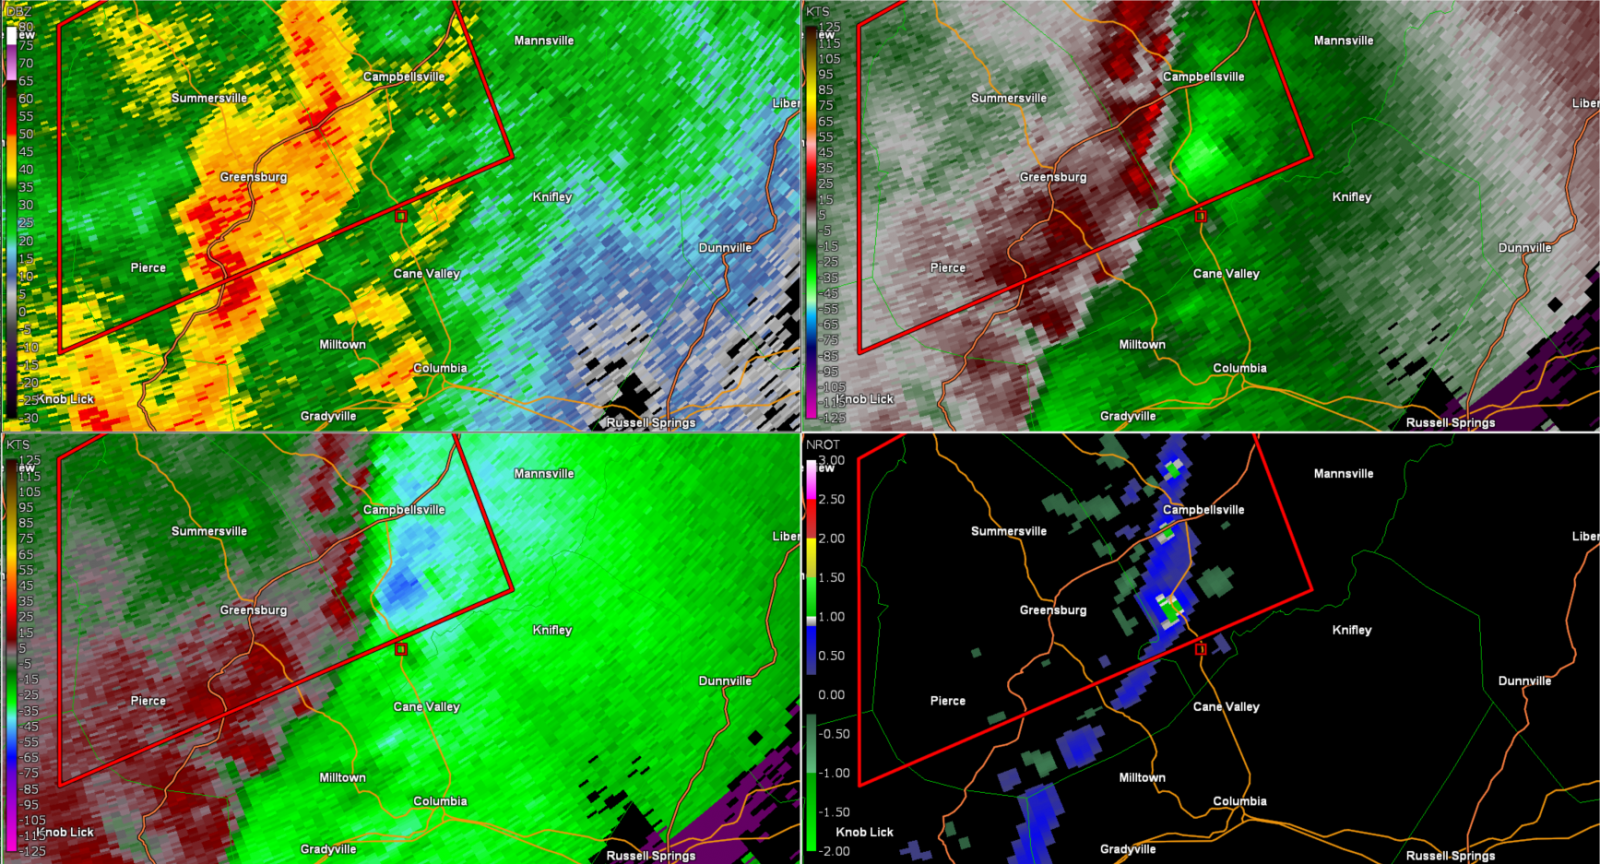
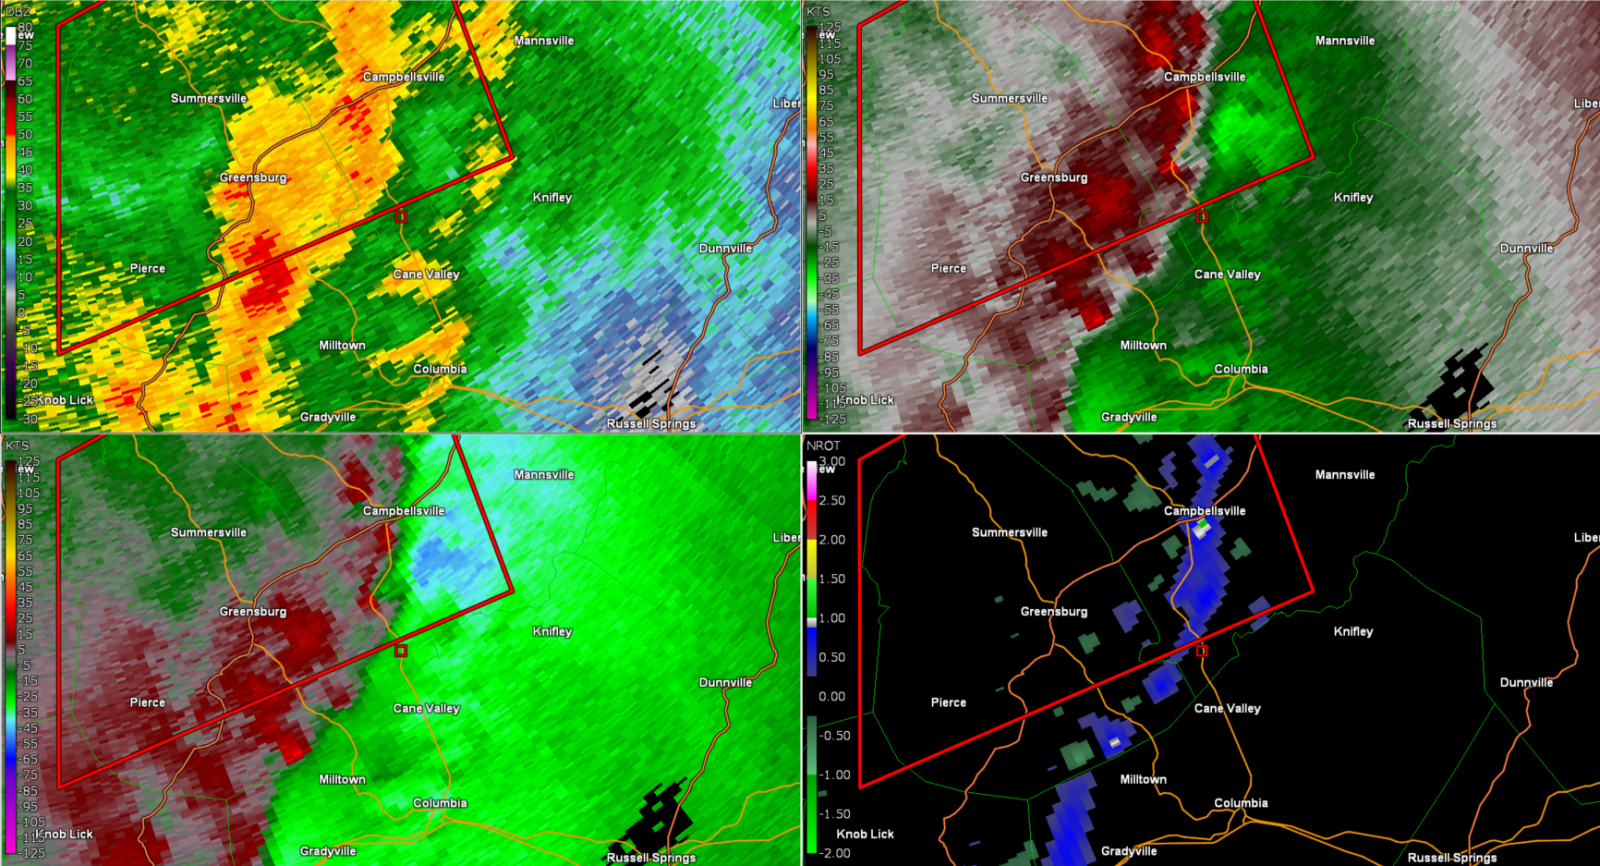
Tornado - Griderville
|
||||||||||||||||
|
||||||||||||||||
|
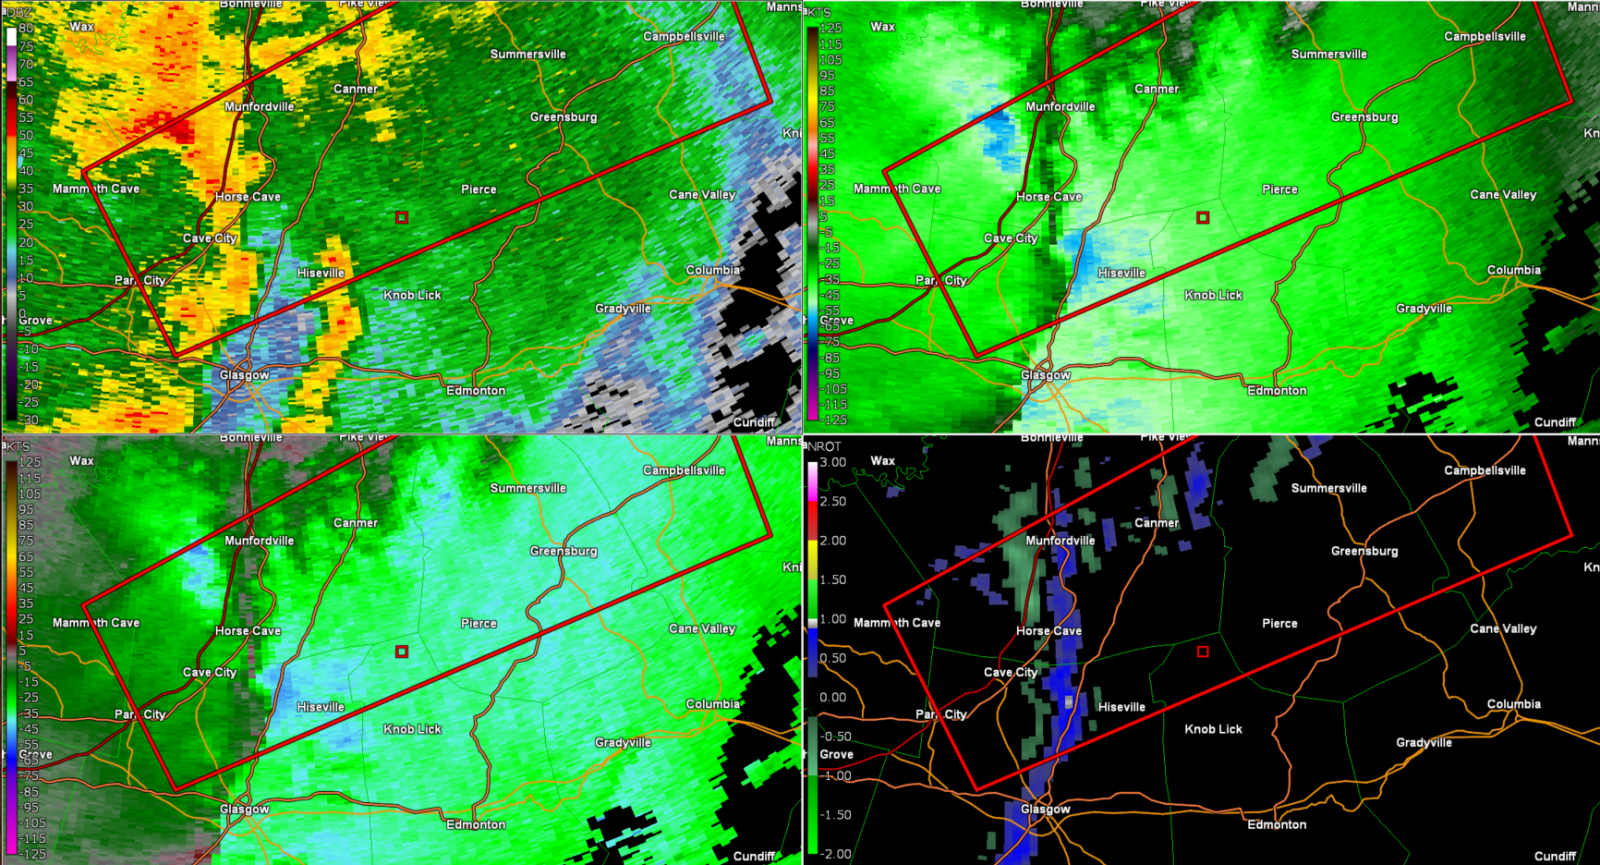
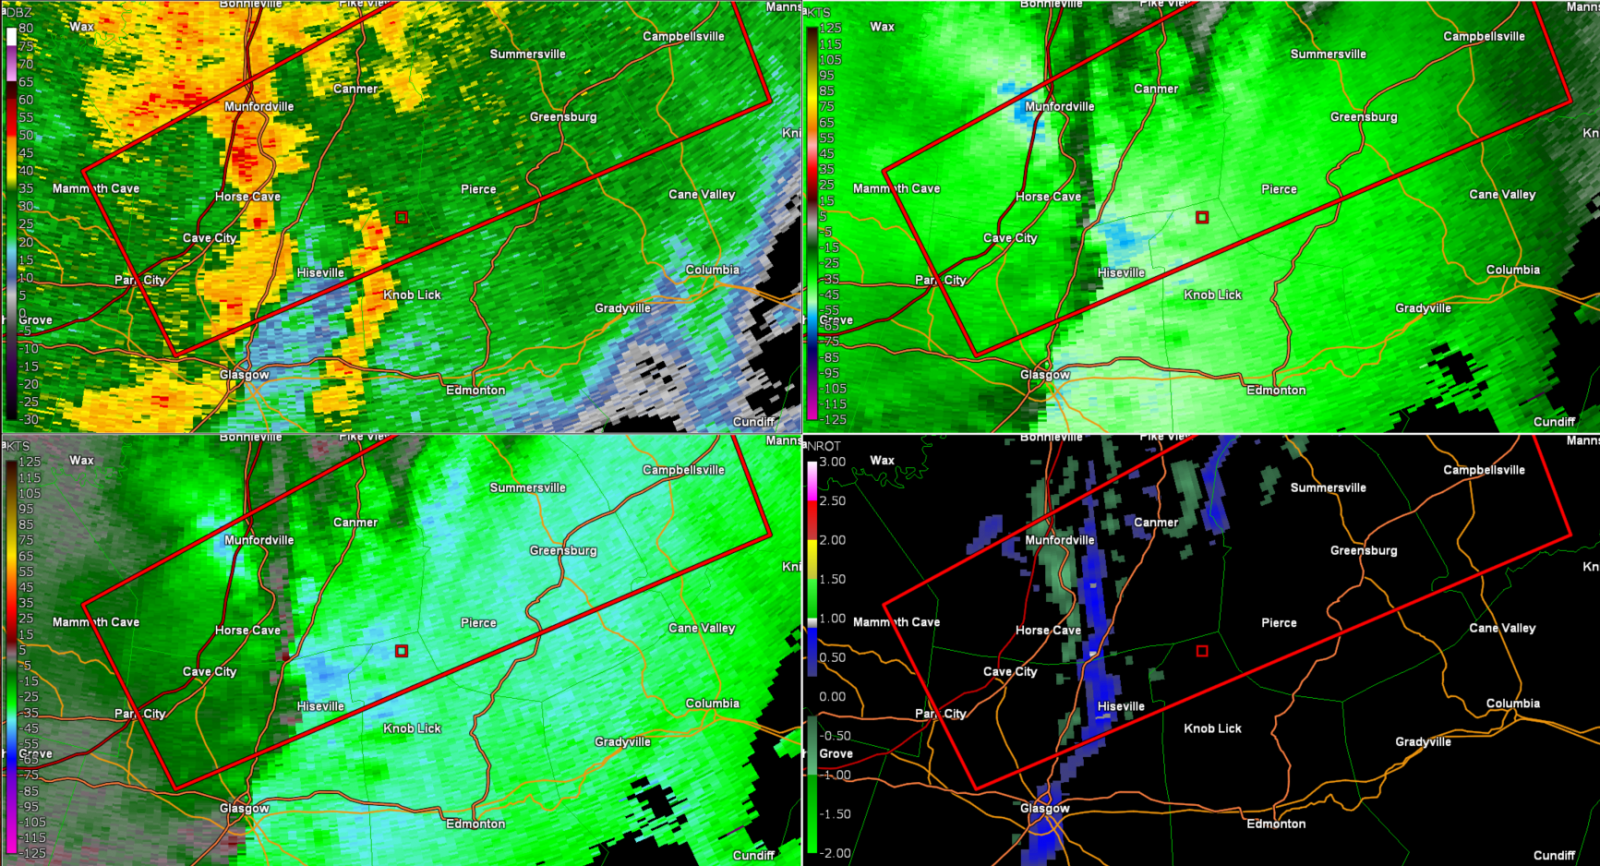
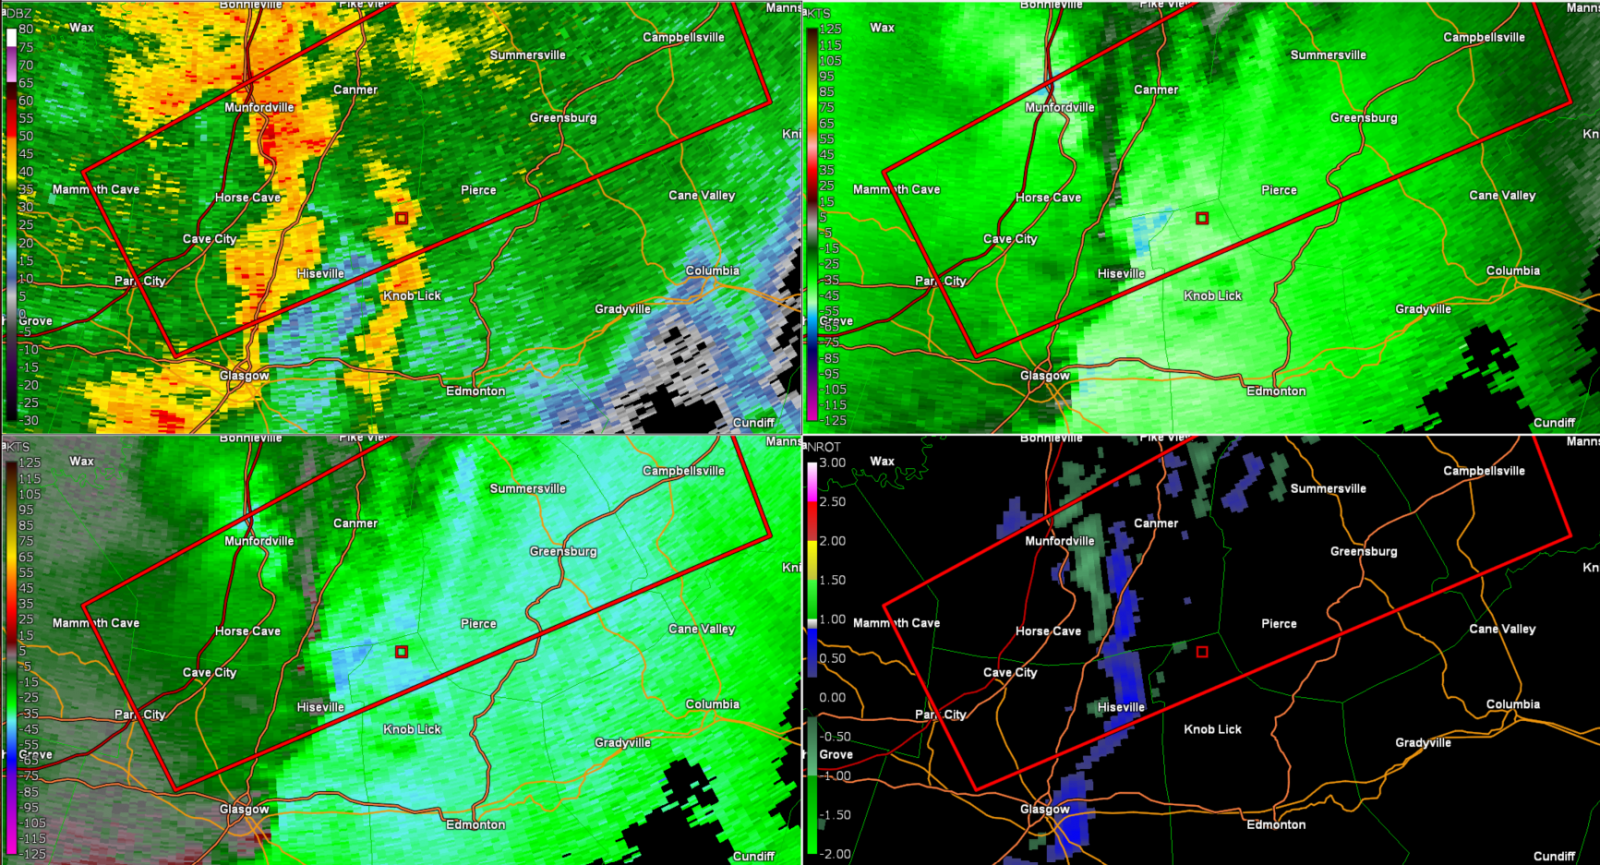
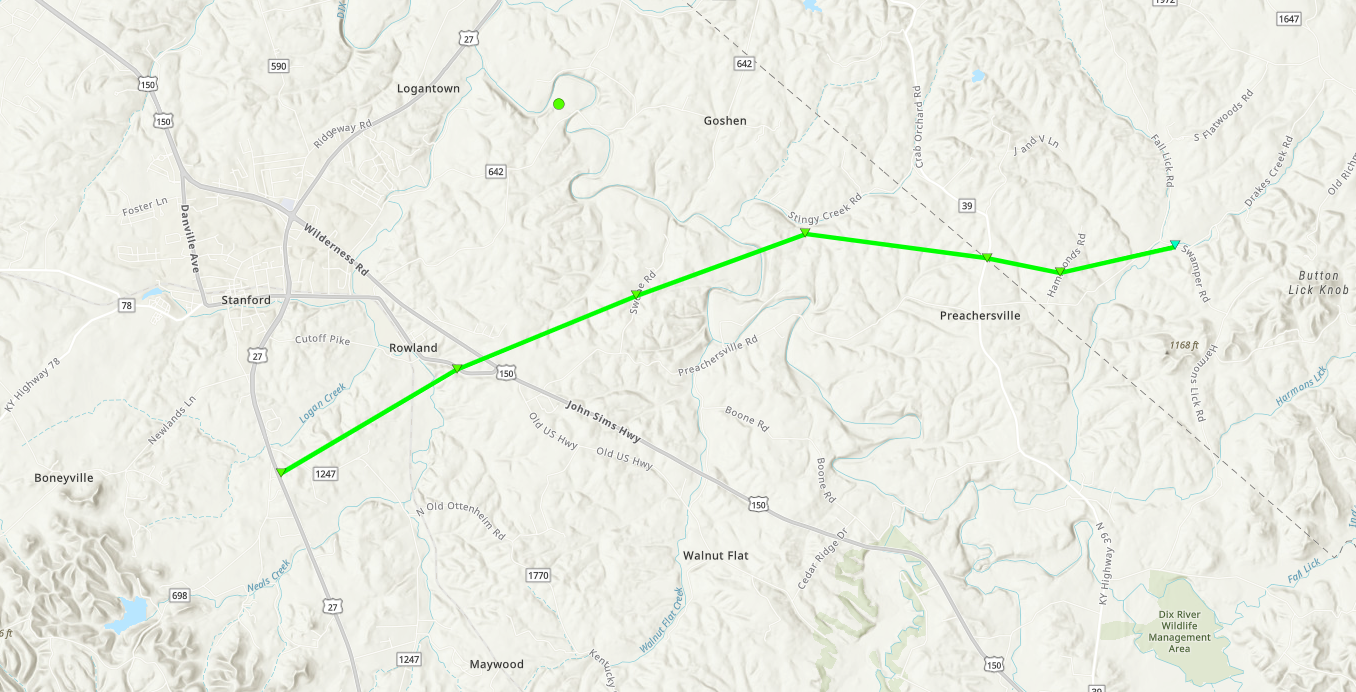
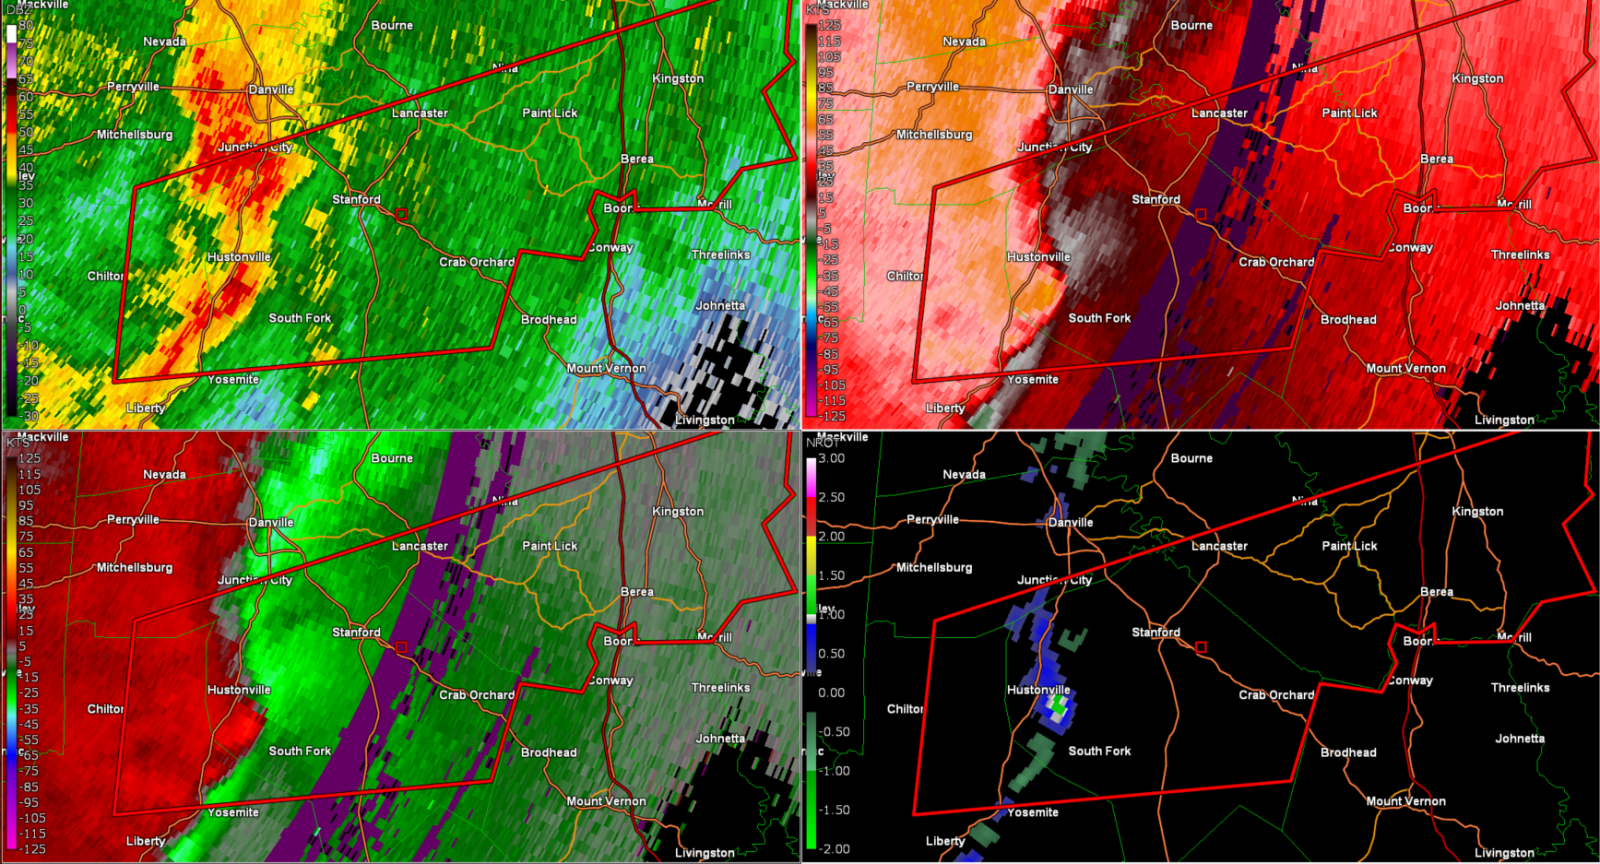
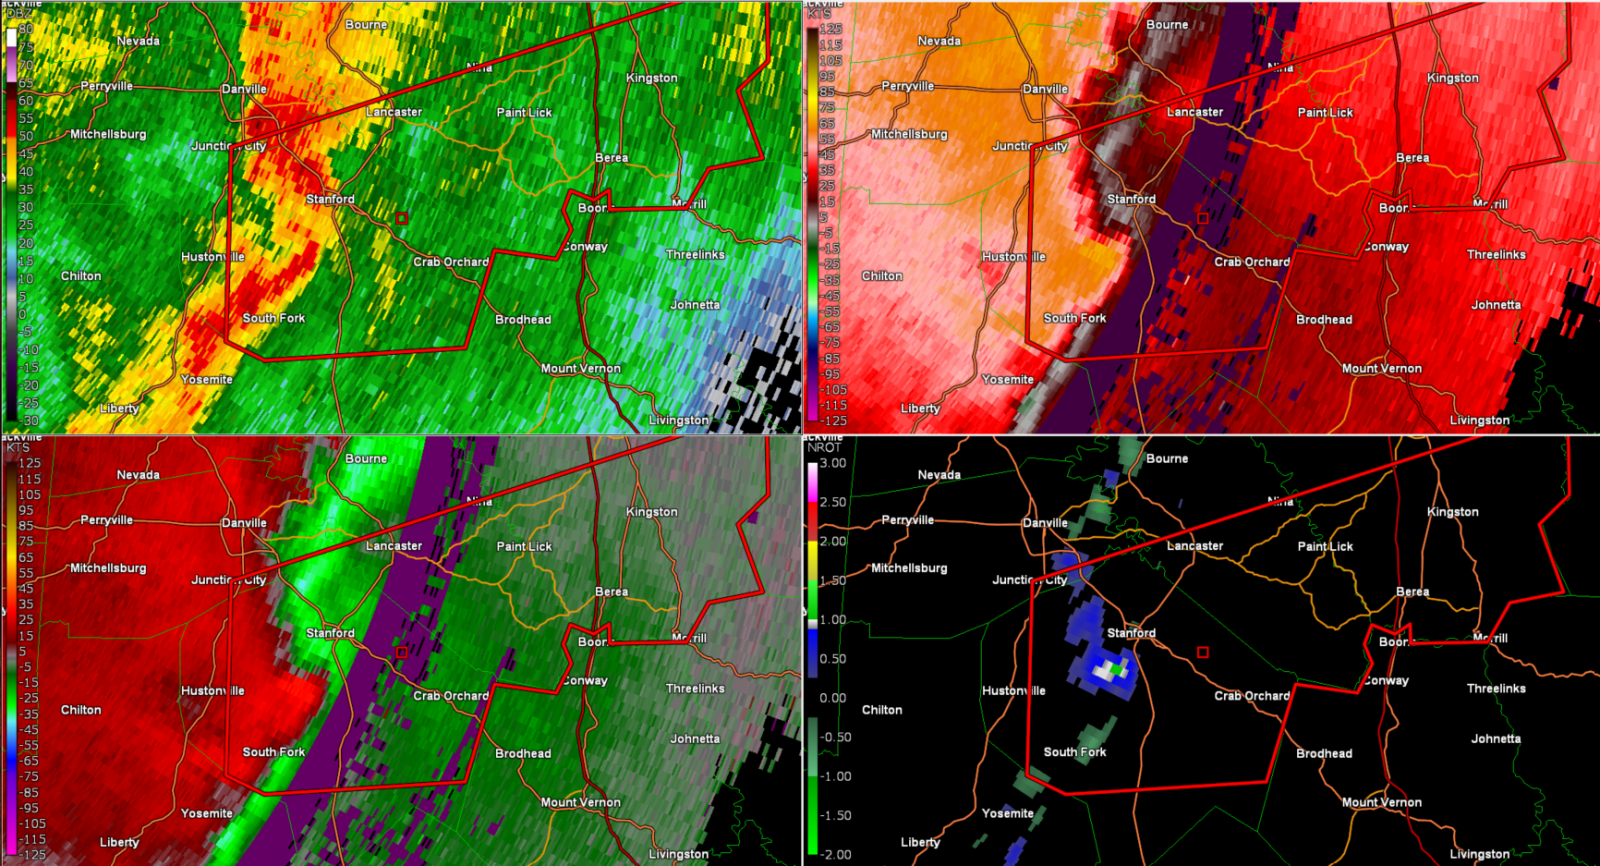
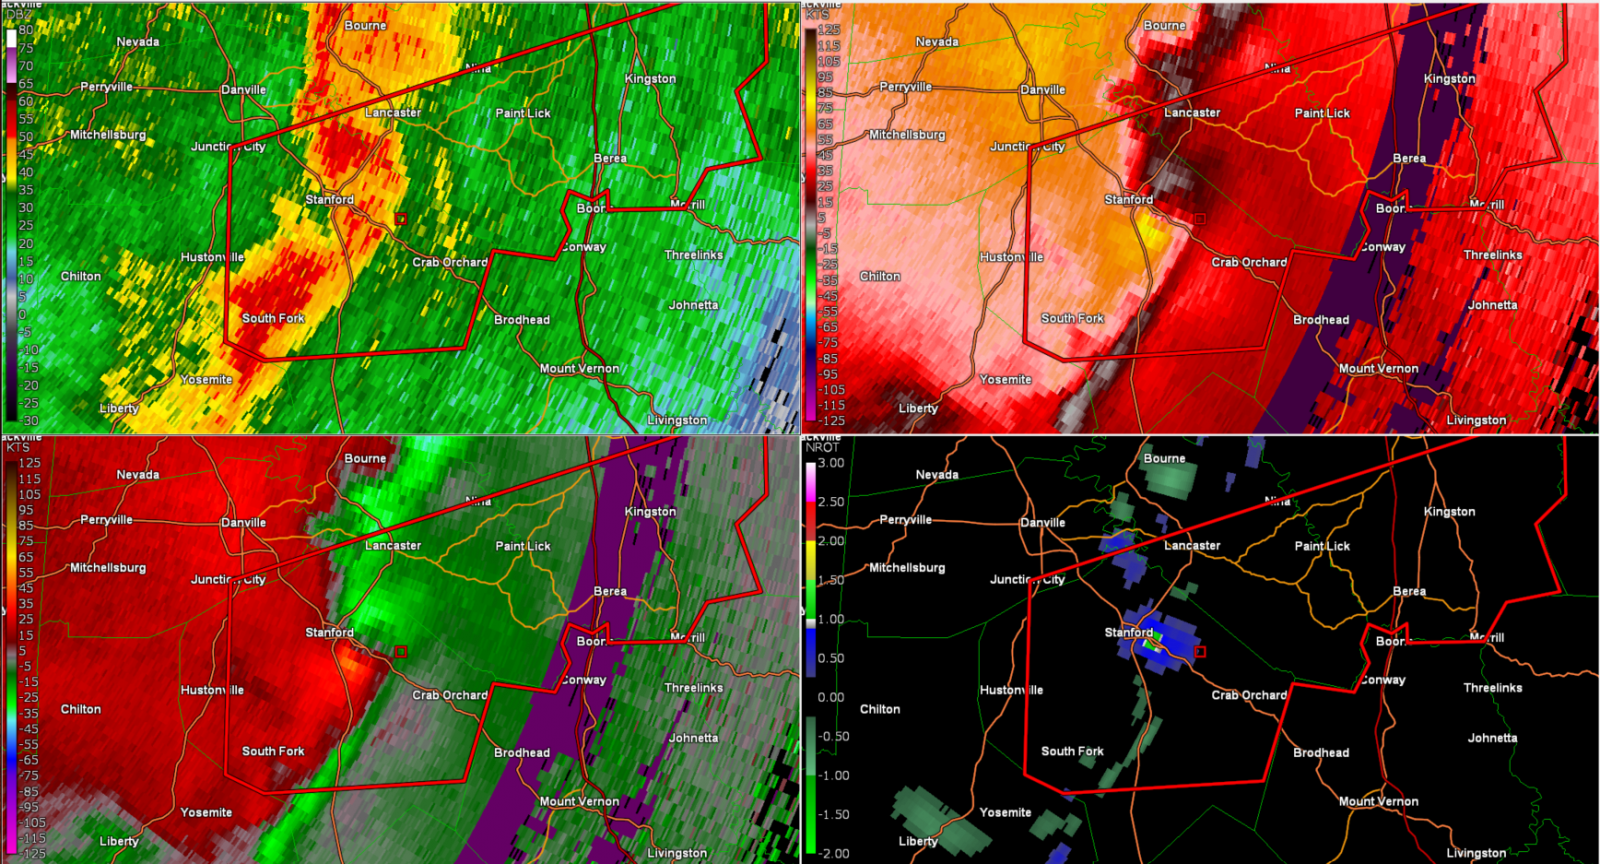
Tornado - Rowland to Preachersville
|
||||||||||||||||
|
||||||||||||||||
|
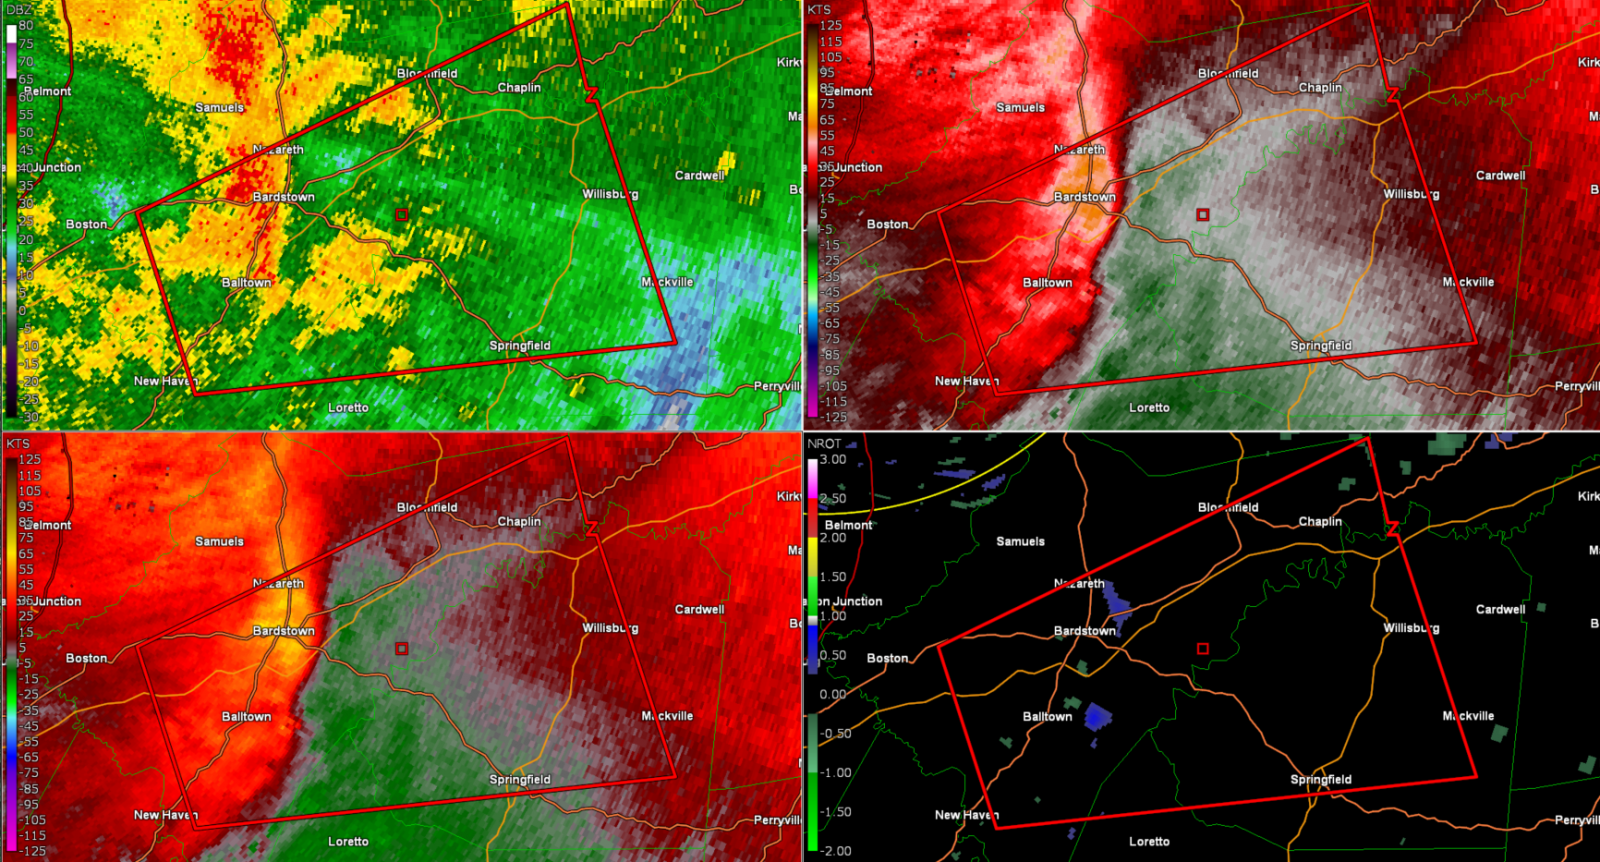
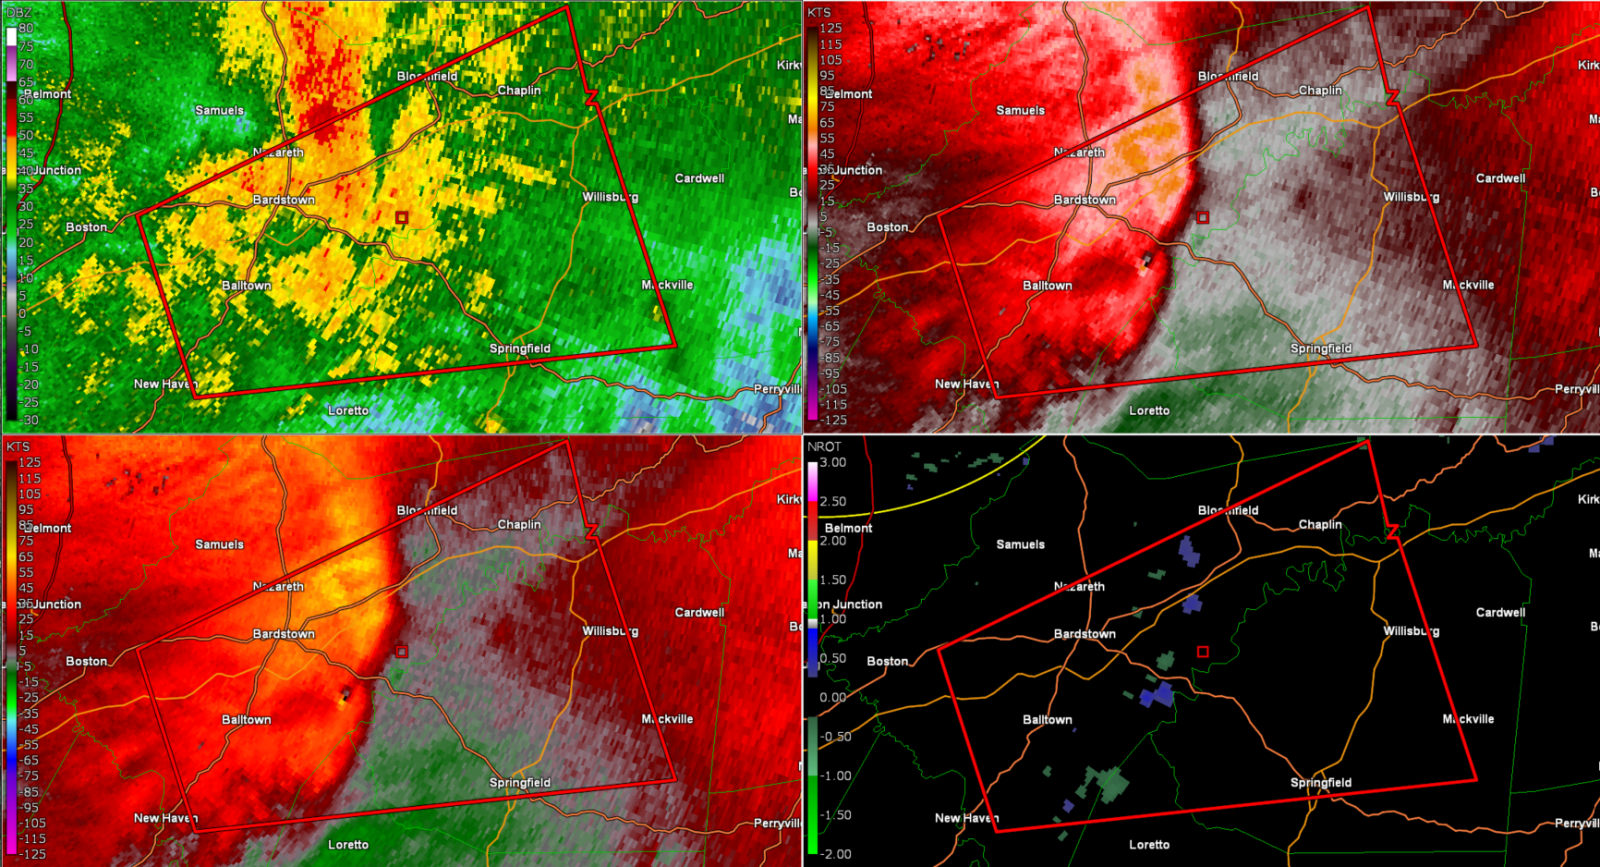
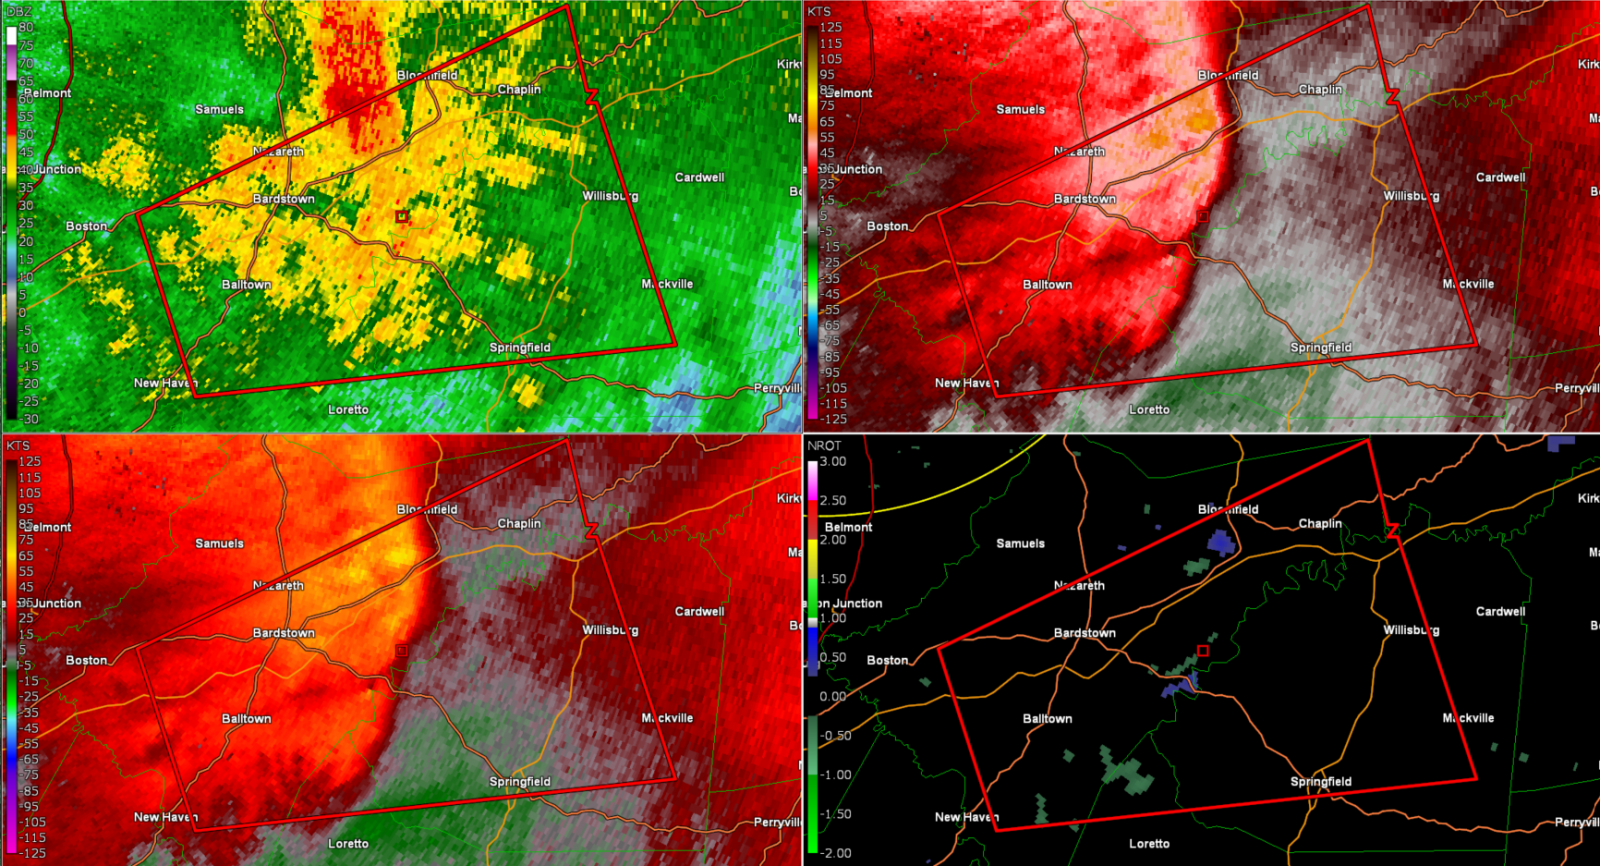
Tornado - Southeast of Bardstown
|
||||||||||||||||
|
||||||||||||||||
|
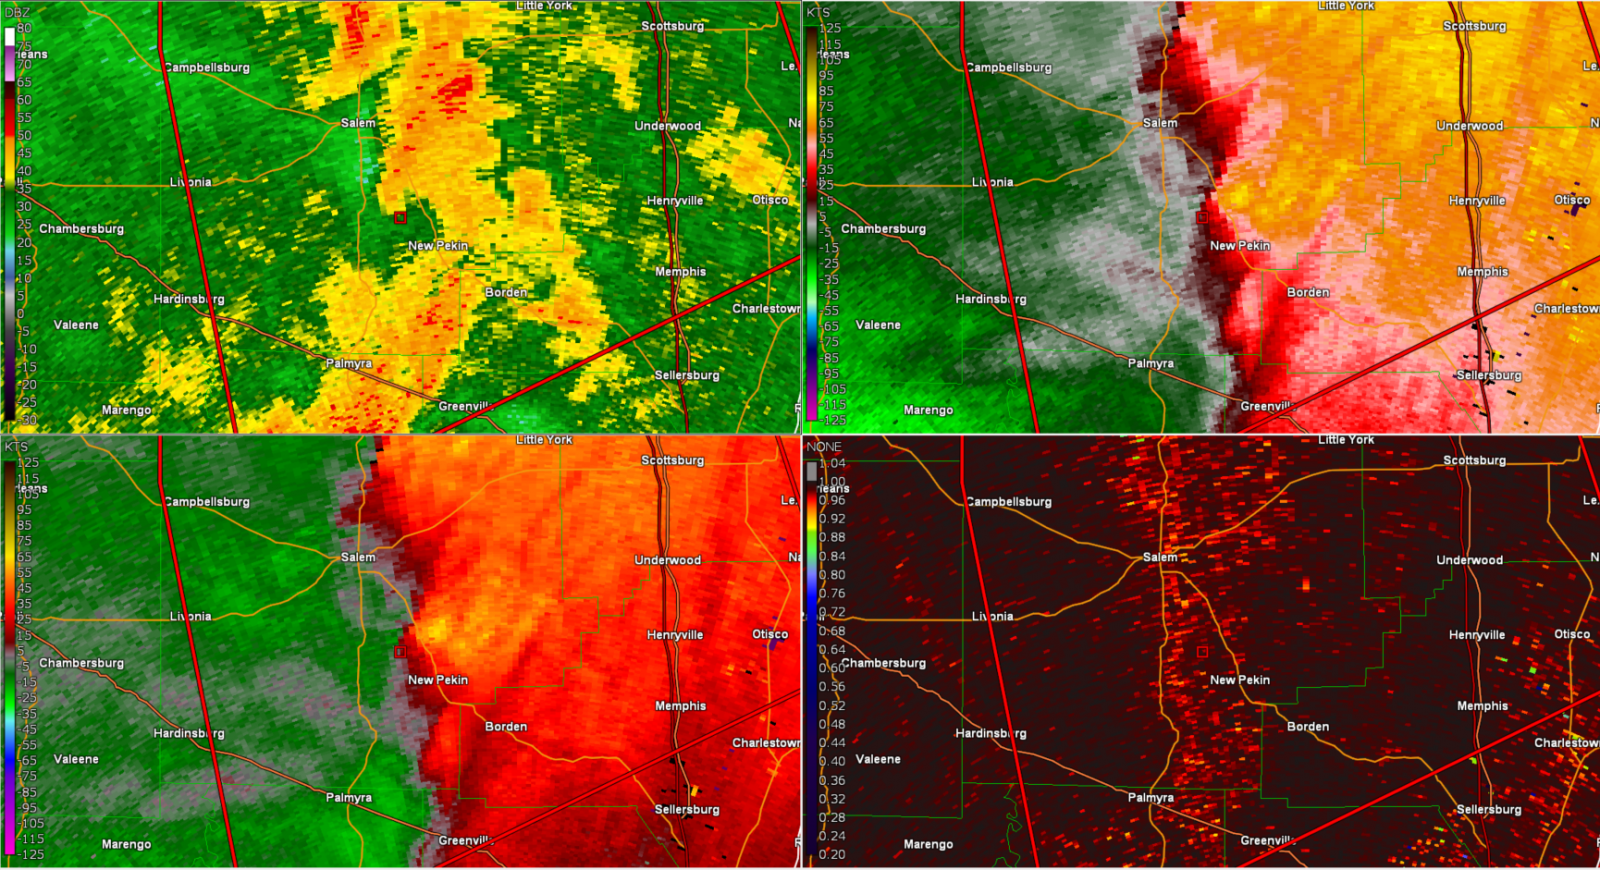
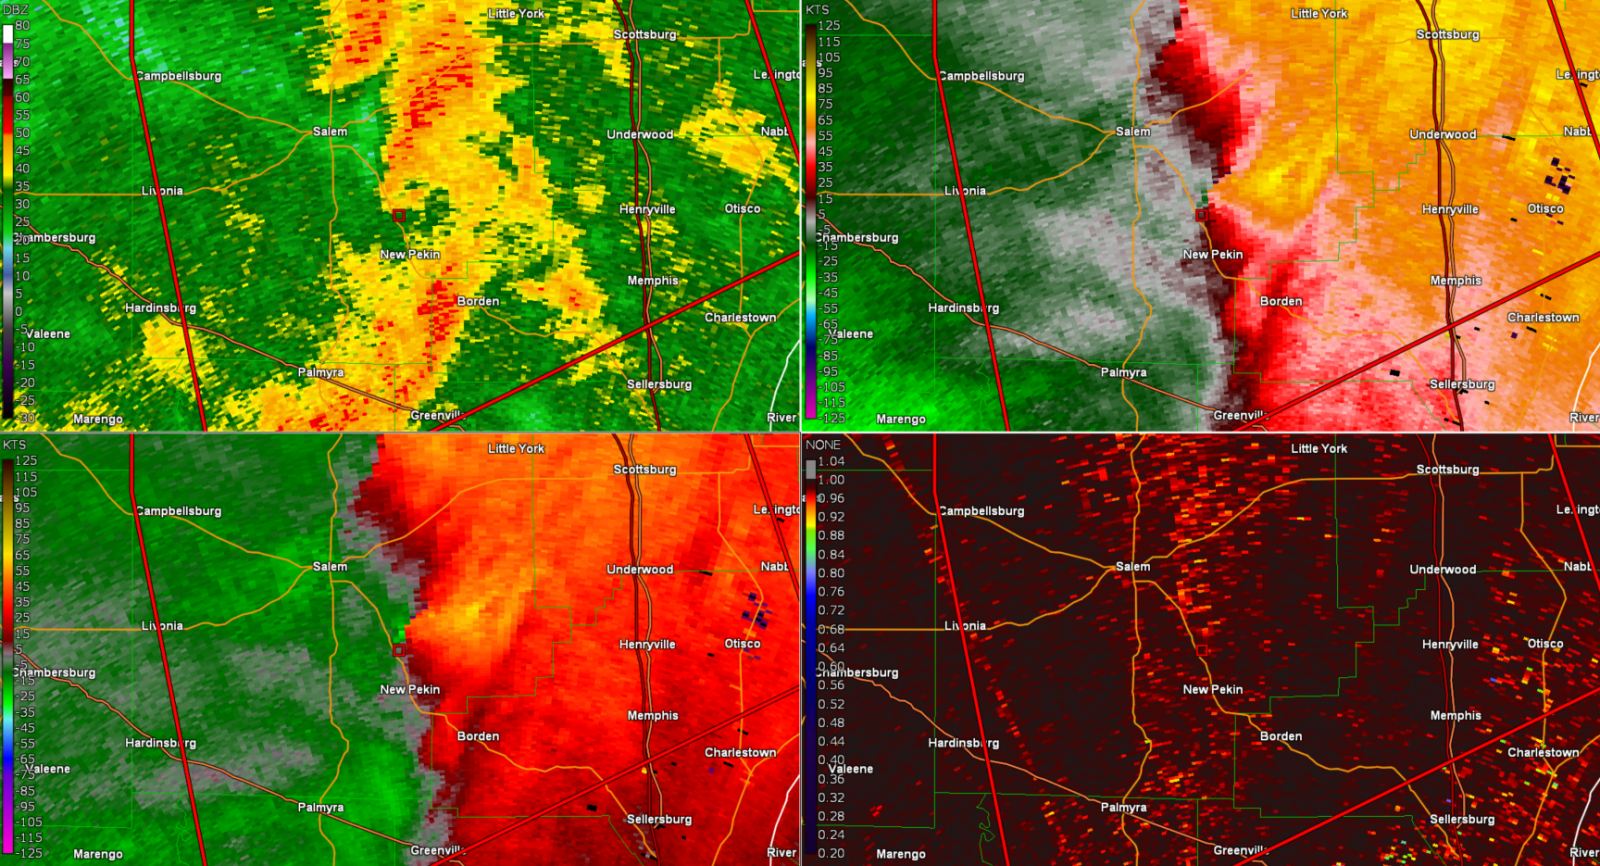
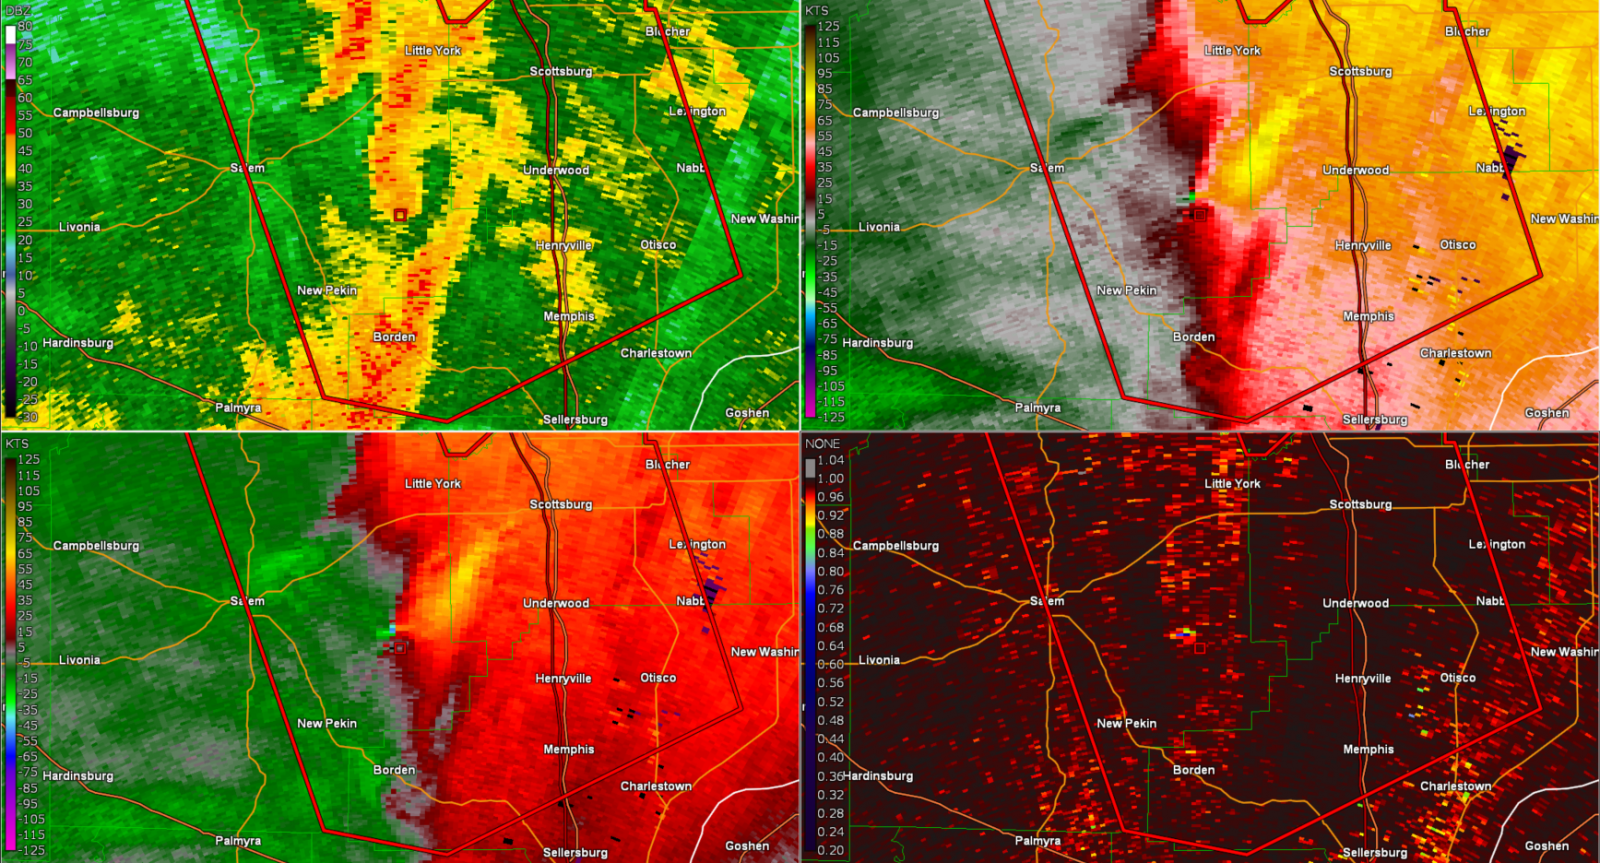
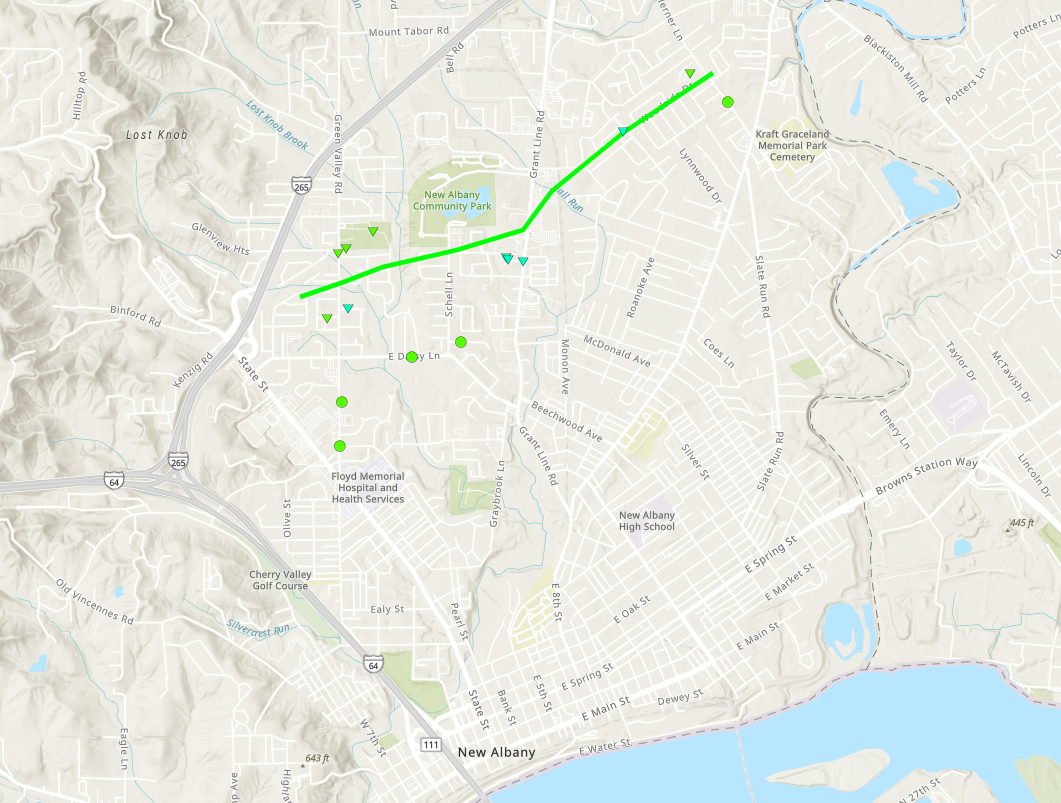
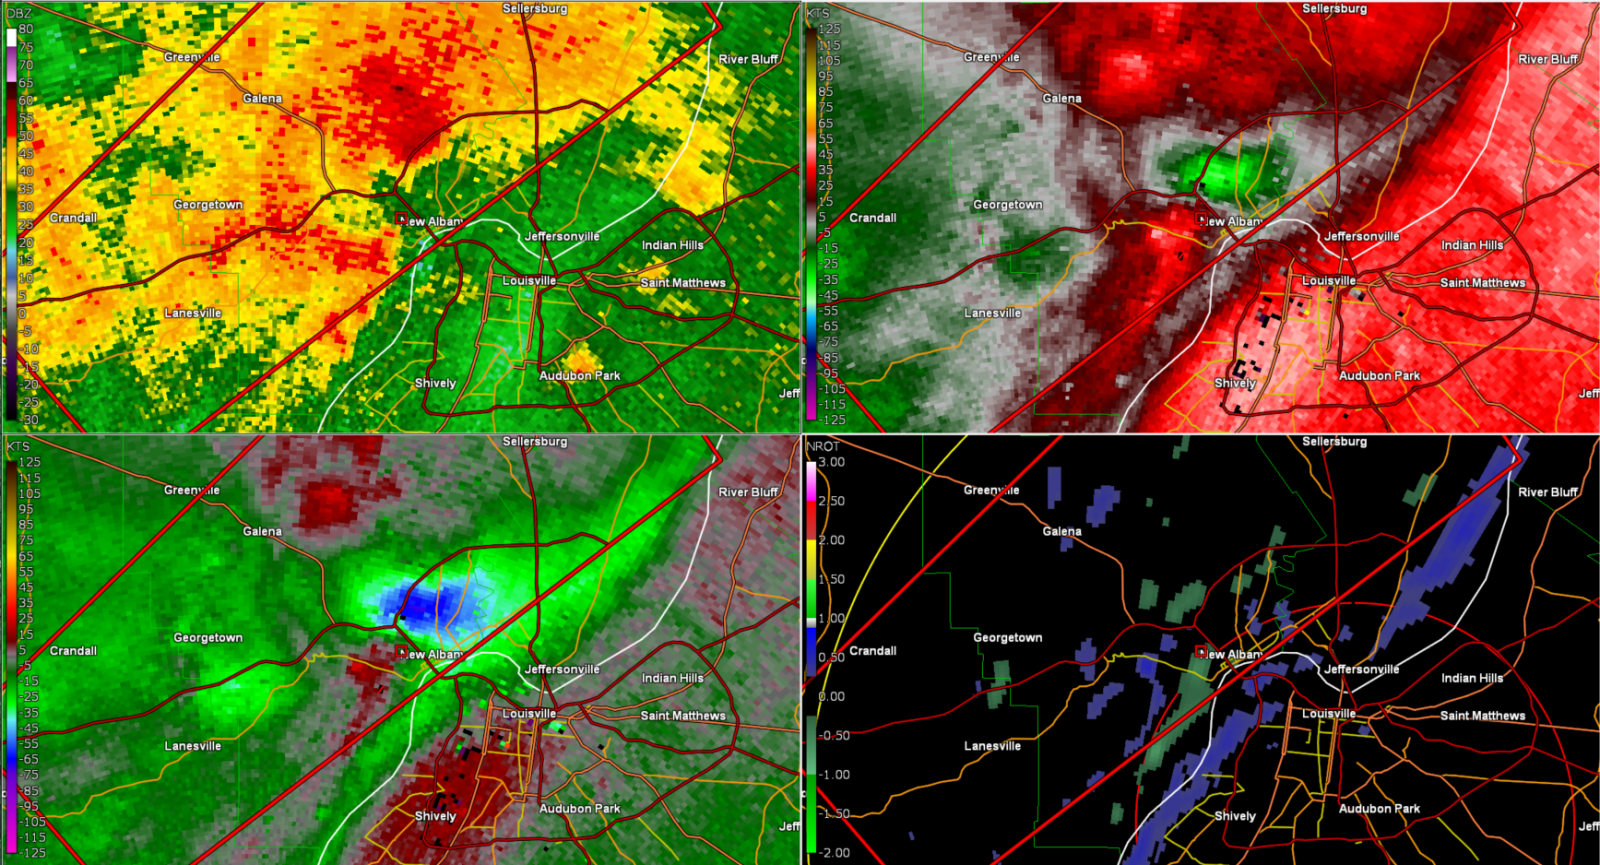
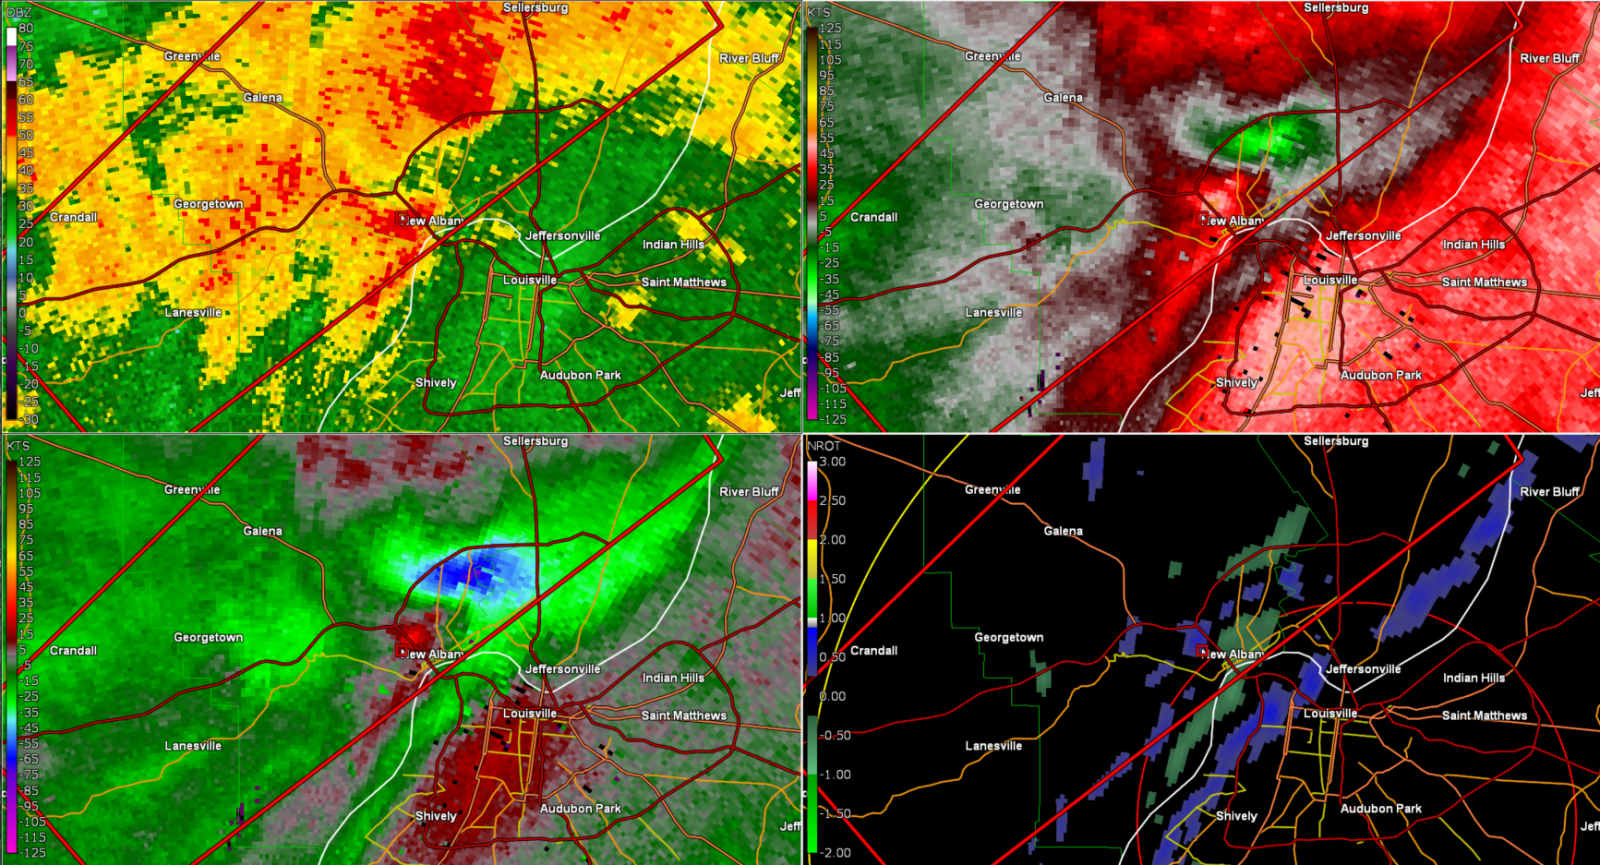
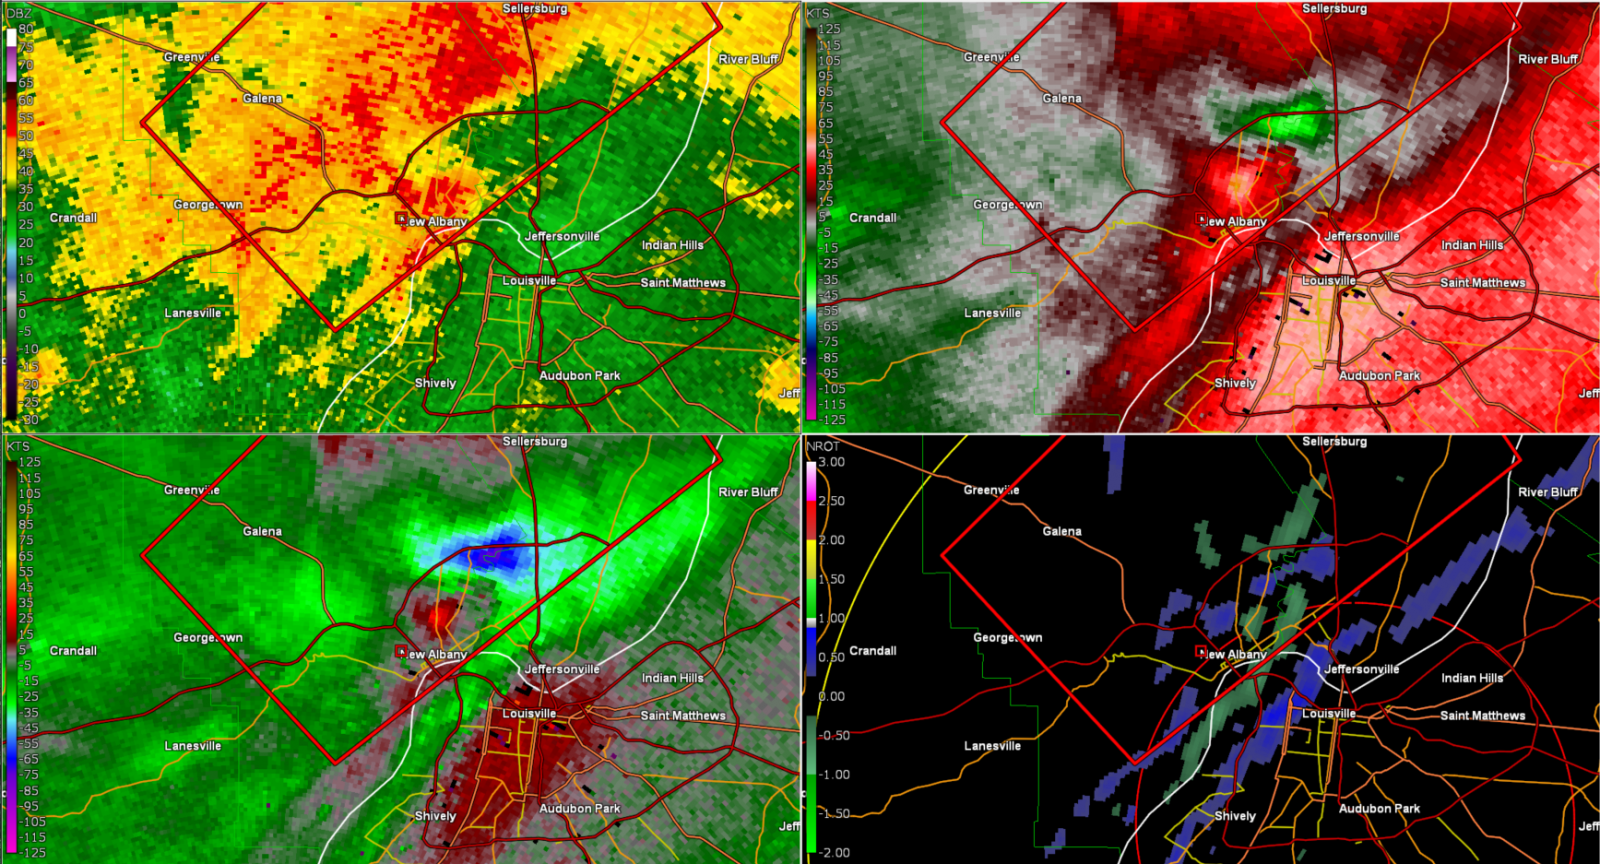
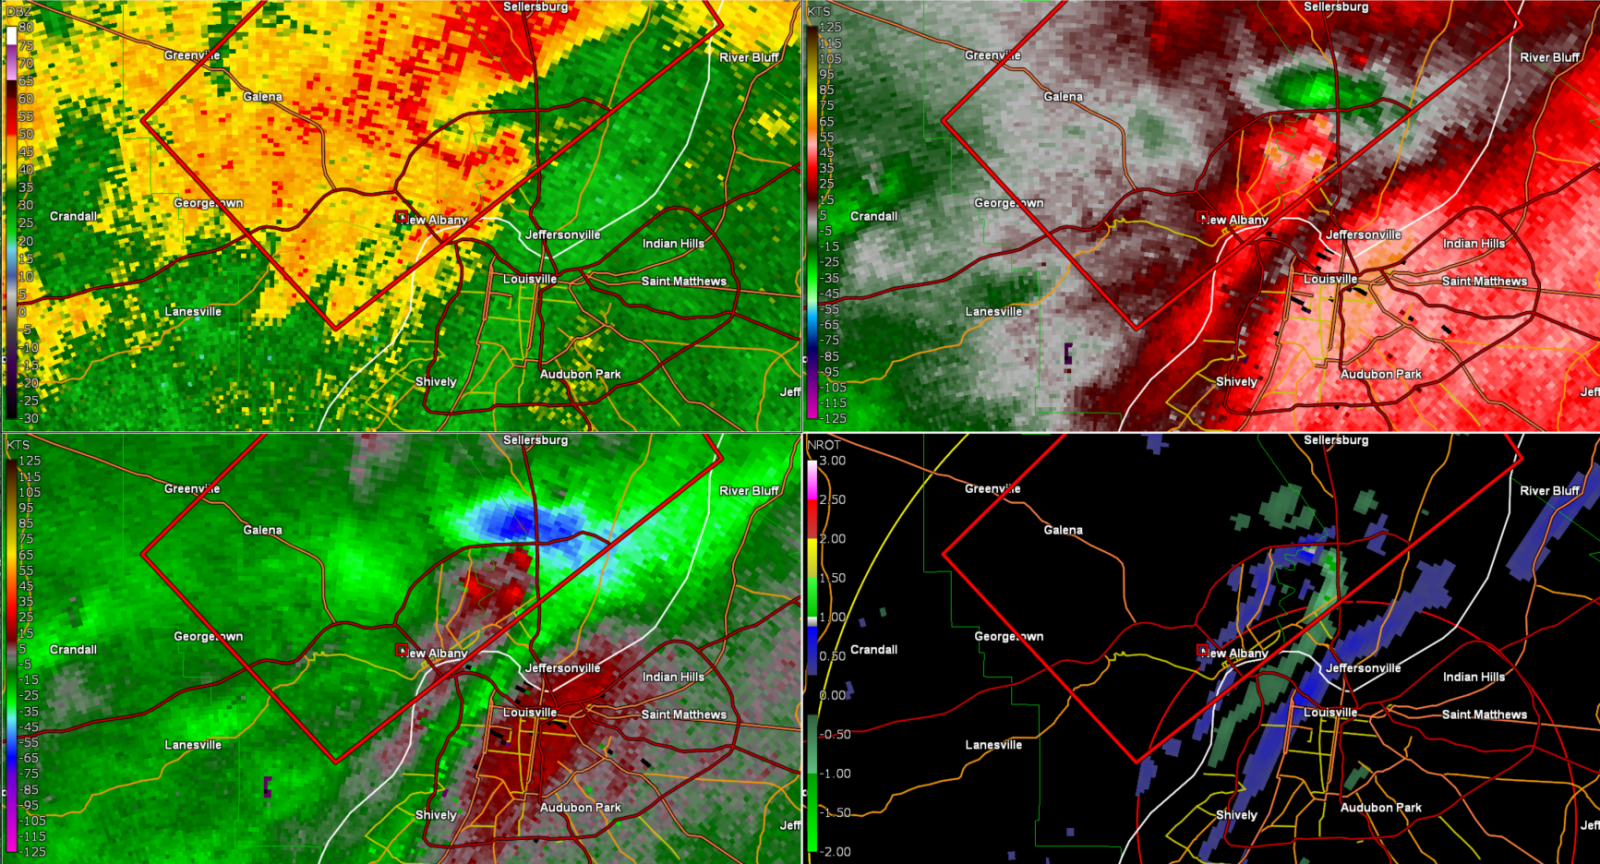
Tornado - New Albany
|
||||||||||||||||
|
||||||||||||||||
|
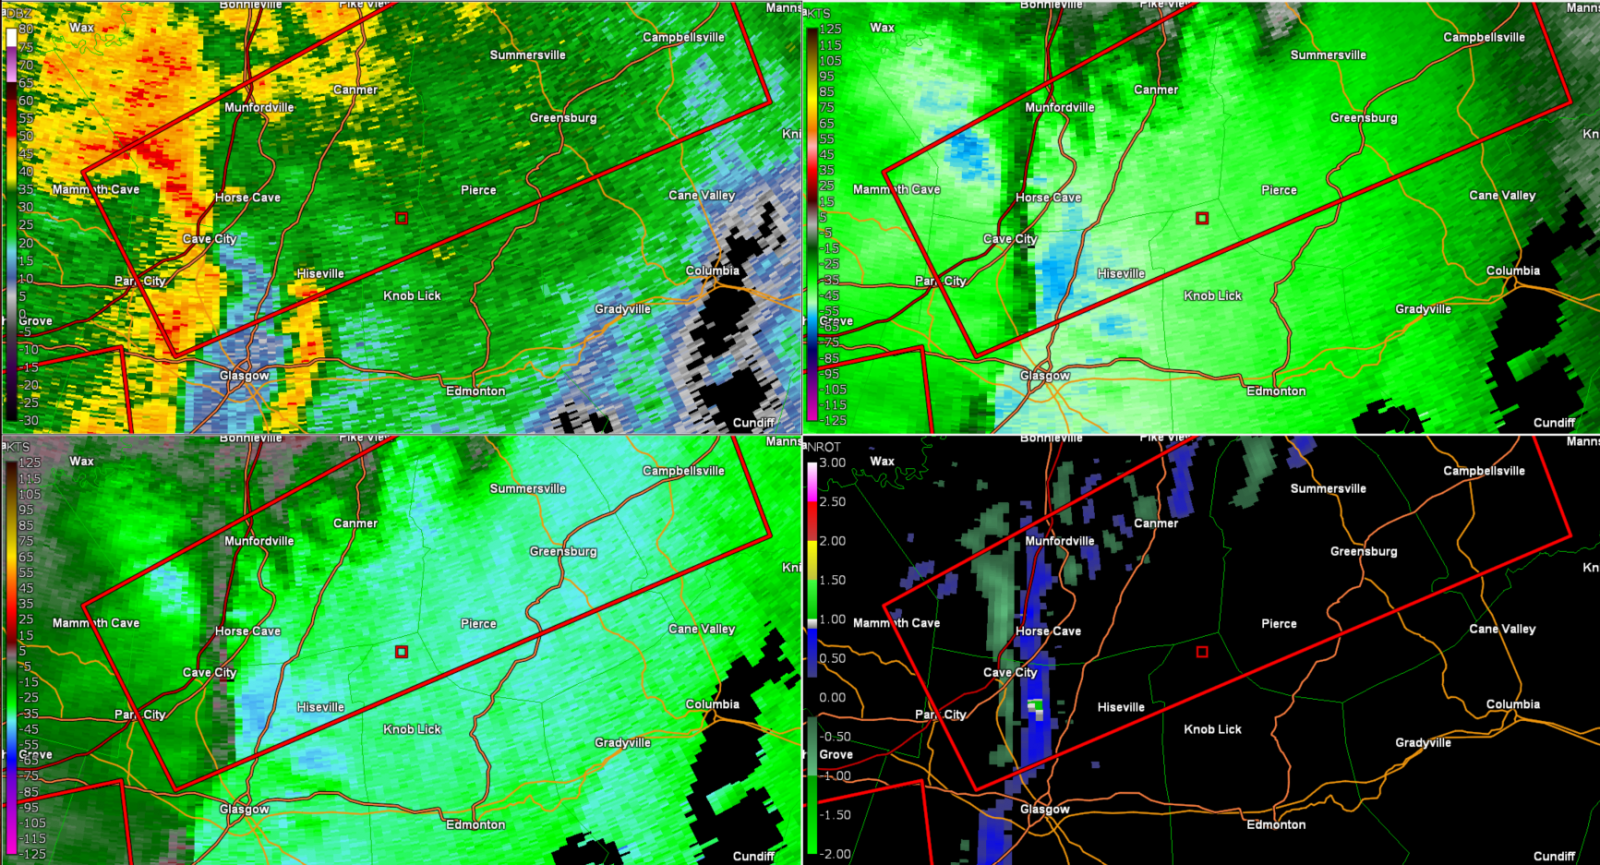
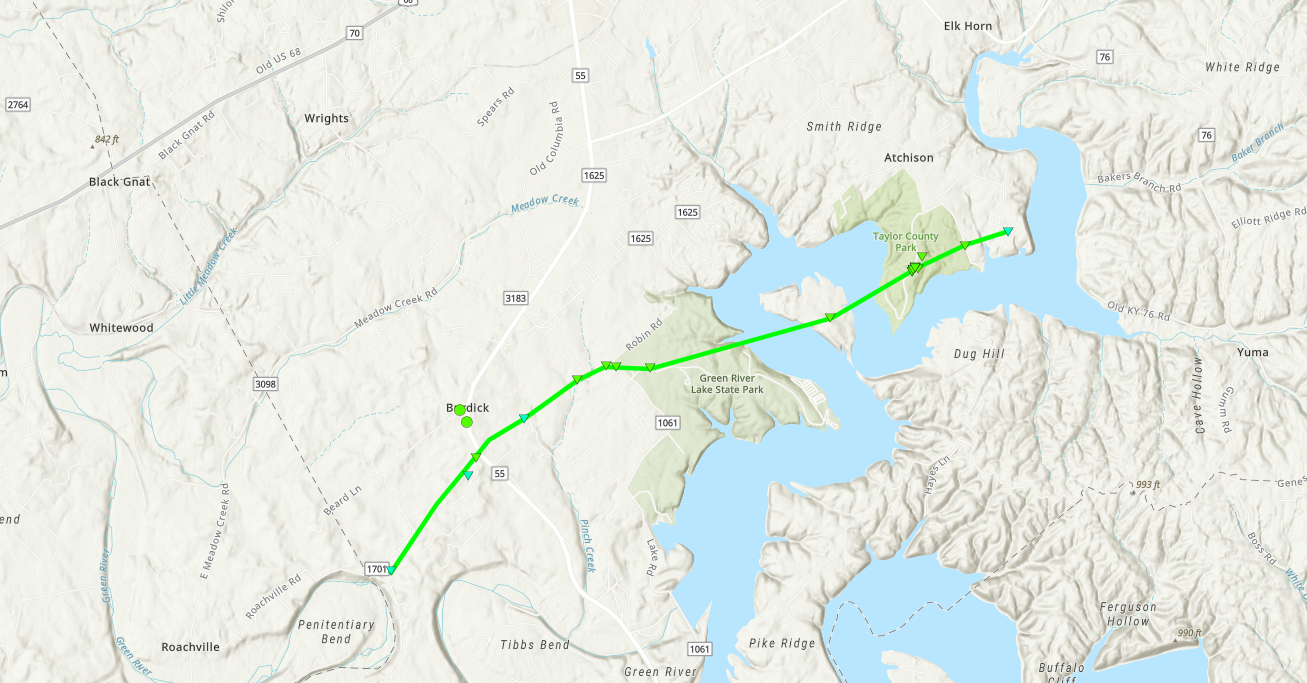
Tornado - Burdick
|
||||||||||||||||
|
||||||||||||||||
|
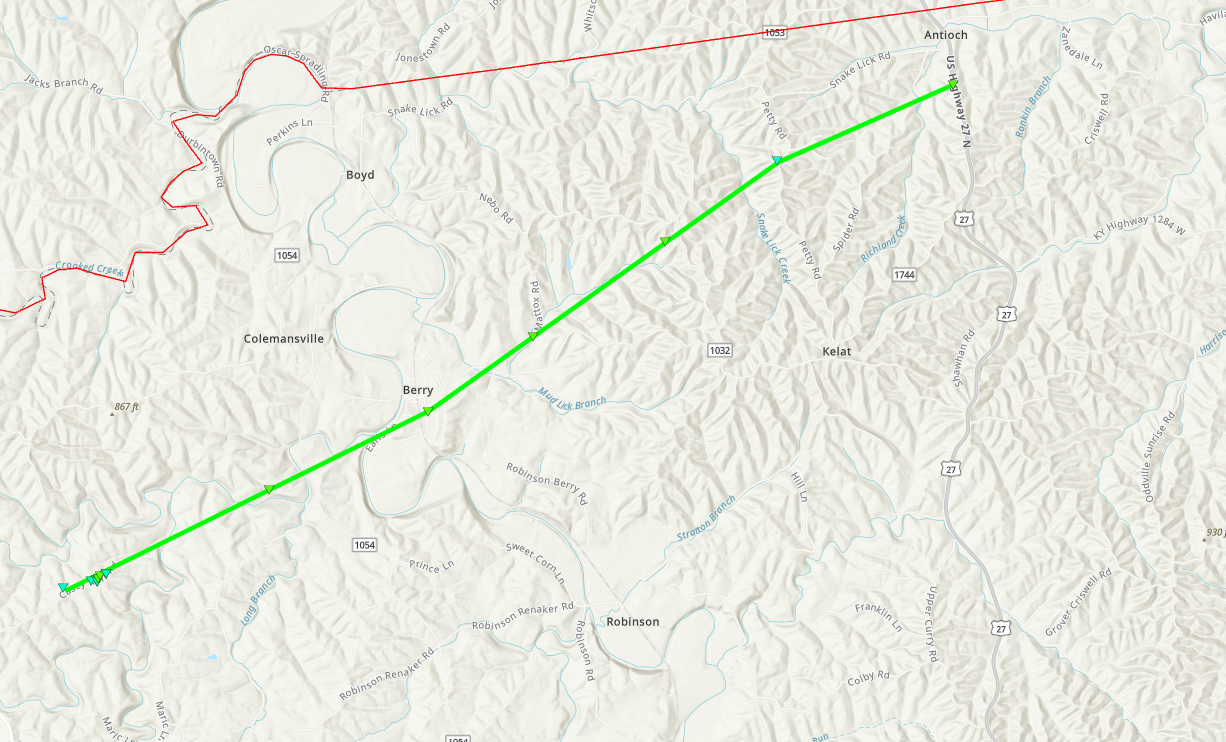
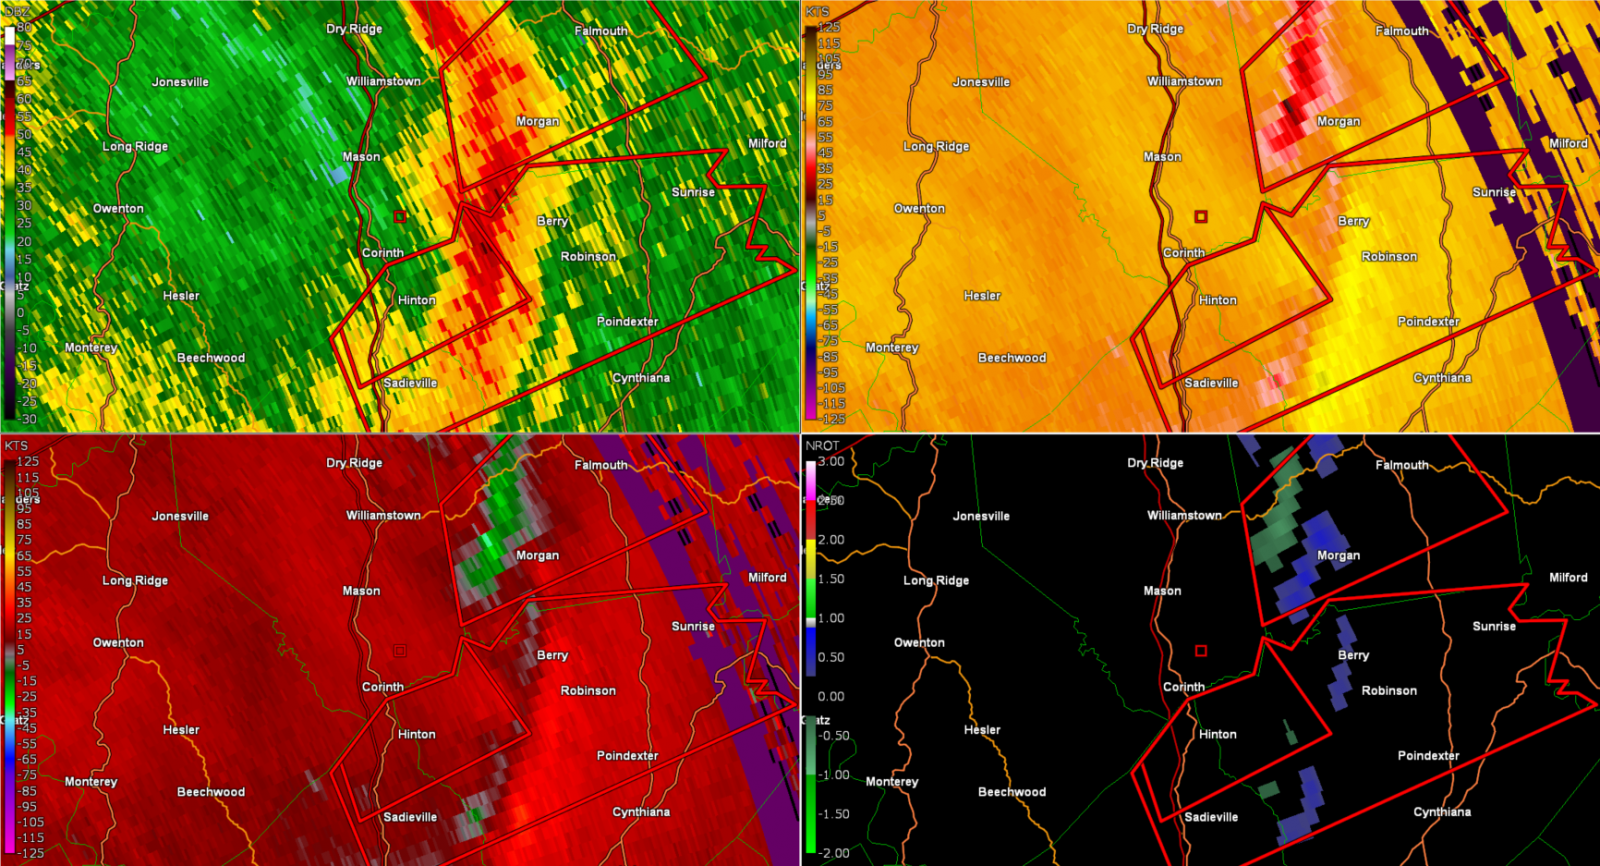
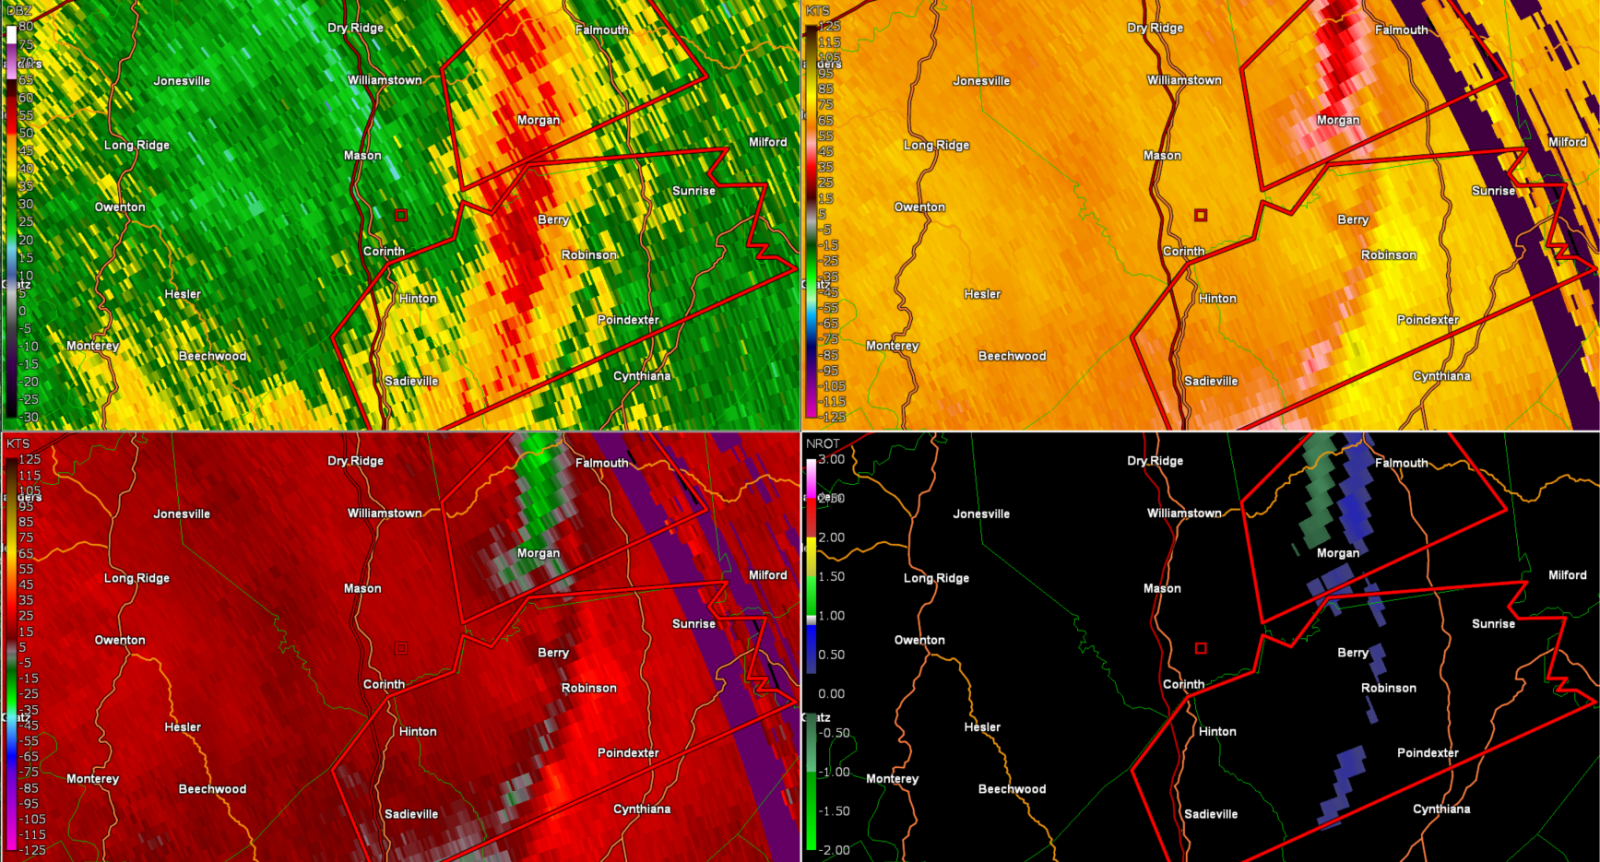
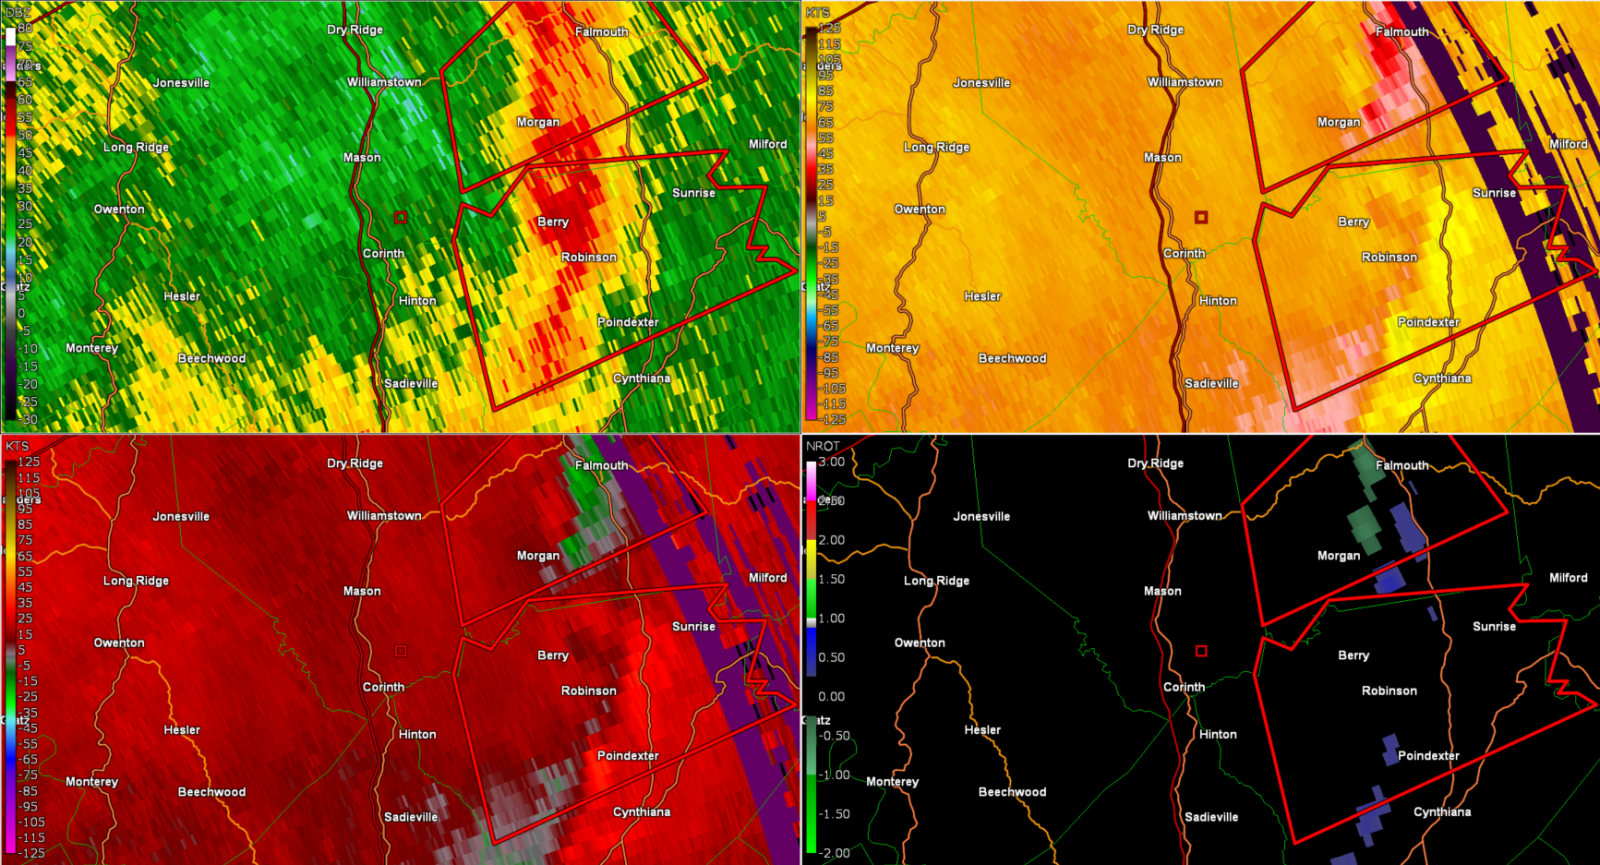
Tornado - Renaker
|
||||||||||||||||
|
||||||||||||||||
The Enhanced Fujita (EF) Scale classifies tornadoes into the following categories:
| EF0 Weak 65-85 mph |
EF1 Moderate 86-110 mph |
EF2 Significant 111-135 mph |
EF3 Severe 136-165 mph |
EF4 Extreme 166-200 mph |
EF5 Catastrophic 200+ mph |
 |
|||||
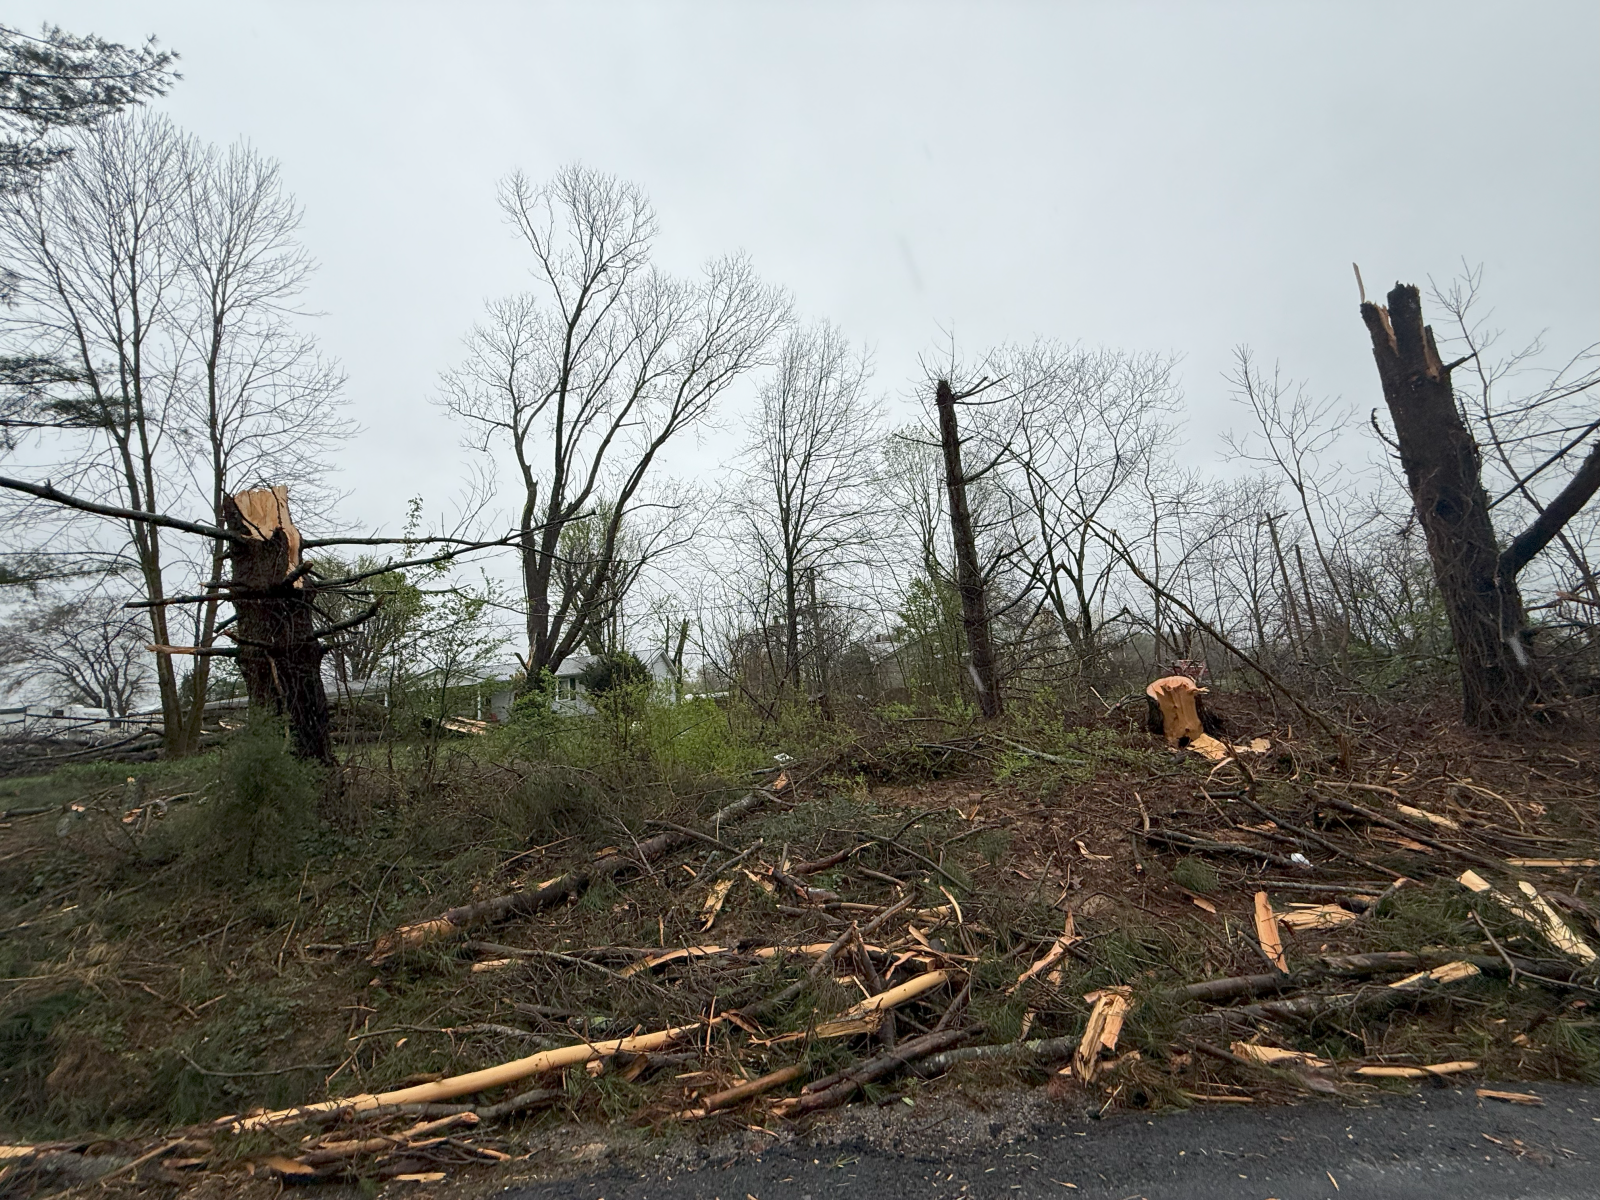
Damage Photos:
 |
 |
 |
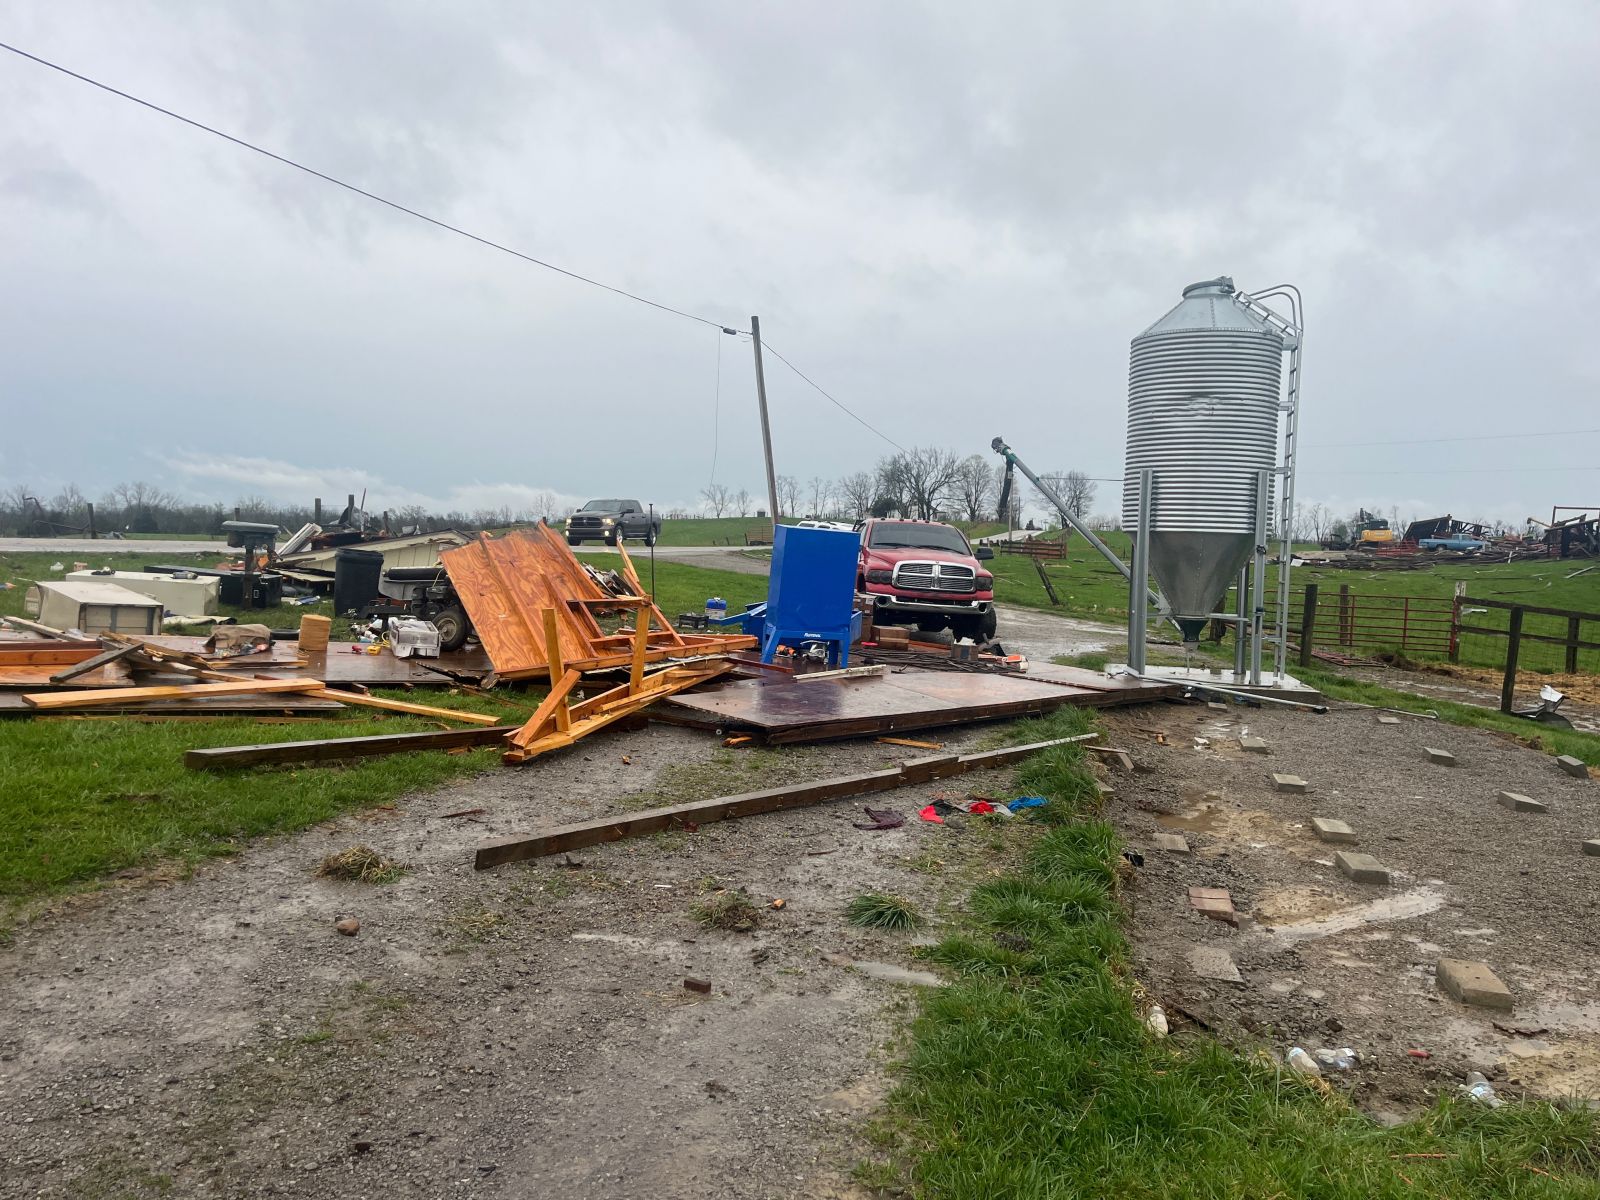 |
| Jeffersontown EF3 Damage | Jeffersontown EF3 Damage | Harrison County EF1 Damage | Lincoln County EF1 Damage |
 |
 |
 |
 |
| Taylor County EF1 Damage | Washington County EF2 Damage | Washington County EF2 Damage | Barren County EF2 Damage |
Flooding
A separate page will be made for the areal and river flooding from this event.
Rain Reports
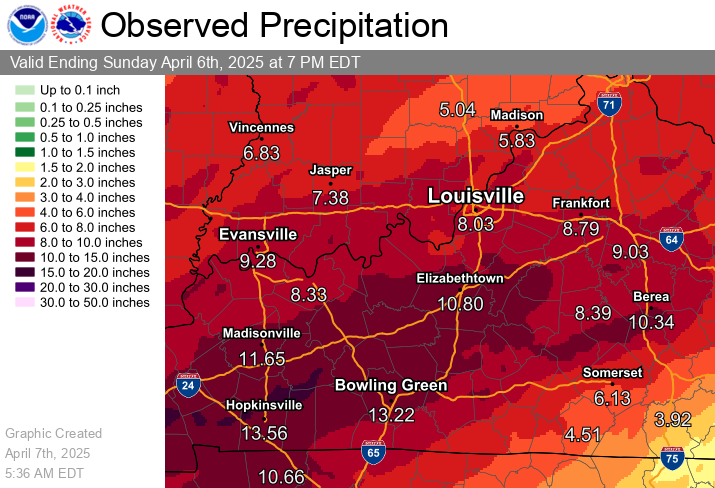 |
| 6 Day Storm Total Rainfall |
Environment
On the night of April 2nd, 2025, a cold front approached the lower Ohio Valley. Along and ahead of the cold front, numerous supercells developed over southern Illinois and western Kentucky. These storms tracked eastward and occasionally grew upscale into a QLCS with bowing segments. Storms lasted all night and into the morning hours, as the cold front began to stall over the lower Ohio Valley. These storms left behind a wake of damage in many counties in southern Indiana and central Kentucky. Over the next few days, waves of showers and storms rode along the cold front bringing lots of rain which lead to widespread flash and areal flooding. Showers and storms came through daily, until the evening of April 6th. Later, this flooding turned into historic and near-record breaking river flooding along many river basins. Here is the storm summary for this event.
 |
 |
 |
| Figure 1: Surface analysis from the evening of April 2nd into the 3rd showed a strong area of low pressure in the upper Midwest to the Great Lakes region. Southern Indiana and central Kentucky were situated in a broad "warm sector" between the retreating warm front well to our north, and an approaching cold front from the west. Warm, moist, and breezy conditions on April 2 ahead of the event resulted from this setup. | Figure 2: 850 mb analysis on the evening of April 2nd into the 3rd revealed strong low level moisture transport associated with a 50-75 knot low level jet. These strong low level winds and deep Gulf moisture moving into our area provided the ingredients for strengthening and turning winds with height, as well as added heavy rain potential. Overall, the shear profile strengthened considerably from this feature, and allowed for rotating storms. | Figure 3: 500 mb analysis on the evening of April 2nd into the 3rd revealed an intense mid to upper level jet stream from the southern Plains up into the Great Lakes region. This feature provided strong "forcing" or broad lift over the warm and moist sector, which helped spark severe thunderstorms. The upper jet stream also added to the overall strength of the wind shear profile. Storm motions were ranging between 60 and 70 mph due to the speed of the winds through the atmospheric column! |
Near-storm environment summary:
 |
 |
 |
| Figure 4: Surface Based CAPE, or fuel for thunderstorms, ranged in the 1000 to 1500 J/KG range through much of the event. Given the time of year this level of instability would be characterized as moderate instability. However, given the amount of wind shear it was more than sufficient for strong and rotating updrafts. | Figure 5: Effective Storm Relative Helicity tells how much wind shear the storm is able to ingest. Any of these values over 150-200 M2/S2 are supportive of tornado potential. On this evening, values ranged between 500 and 700 M2/S2! | Figure 6: The Significant Tornado Parameter is a composite parameter that pairs and highlights where instability and shear overlap. Where those two ingredient overlap is where tornado potential can maximize. On this evening, you can see a strong axis of Significant Tornado Parameters nosing into southern Indiana and central Kentucky. Any of these values over .25 are notable, and our values were mostly in the 1 to 3 range through the evening which is more than sufficient for a significant tornado (EF-2 or greater). |
 |
 |
| Figure 7: LCL Height tells the height of the cloud base when an air parcel is forced to rise. Over the southwestern Indiana and central Kentucky LCL heights were near 750 meters, which is conducive for tornadogensis. | Figure 8: 0-3 km Bulk Shear shows the amount of rotation of the winds that helps storms become organized. Over the western portion of the area, Bulk Shear was 50-60kts, which is more than enough support for strong, organized supercells. |
 |
Media use of NWS Web News Stories is encouraged! Please acknowledge the NWS as the source of any news information accessed from this site. |
|


.png)


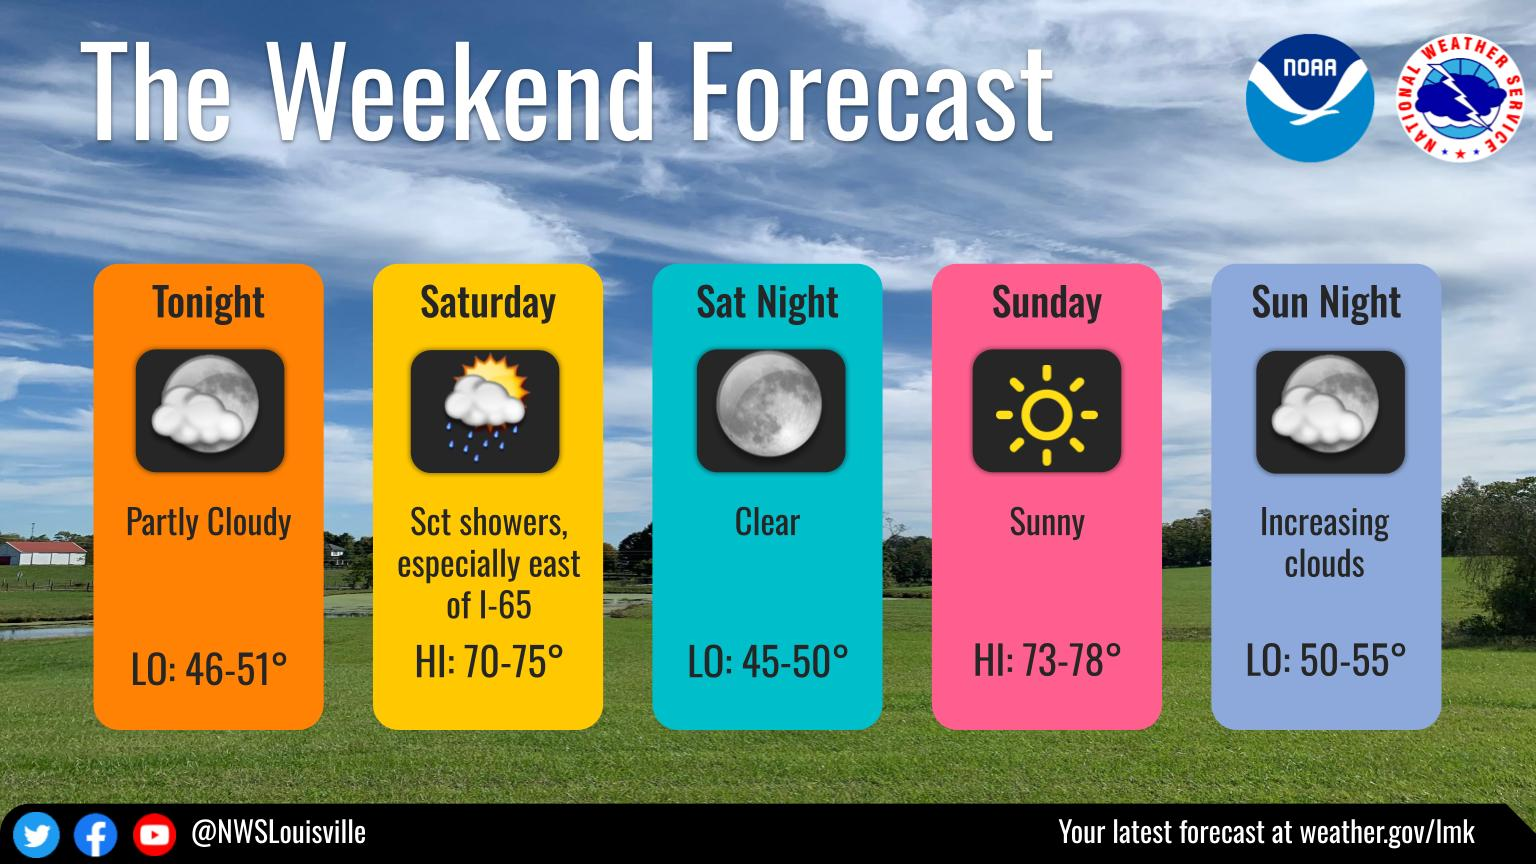 Weather Story
 Weather Map
 Local Radar