Frost/Freeze Information for Louisville, Kentucky
Note that these statistics are for central Louisville. Rural areas will have significantly different statistics, even within Jefferson County.
Records:
Latest spring frost (36°): May 27, 1961
Latest spring freeze (32°): May 10, 1966
Latest spring hard freeze (28°): April 23, 1986
Earliest final spring frost (36°): March 15, 1884
Earliest final spring freeze (32°): March 5, 1927
Earliest final spring hard freeze (28°): February 12, 2011
Earliest fall frost (36°): September 25, 1950
Earliest fall freeze (32°): October 3, 1974
Earliest fall hard freeze (28°): October 10, 1964
Latest first fall frost (36°): November 23, 1902
Latest first fall freeze (32°): December 5, 1885
Latest first fall hard freeze (28°): December 13, 1939
Longest growing season: 257 days in 1884
Shortest growing season: 166 days in 1976
Normals:

Midwest Regional Climate Center Freeze Date Tool
Areawide Frost/Freeze Information
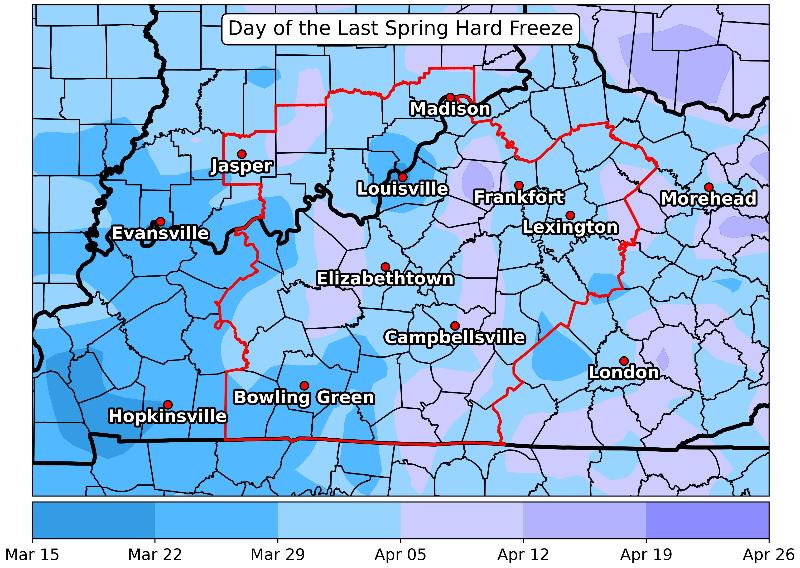
Below is a series of maps showing average first and last dates for selected temperature thresholds. Data were taken from about fifty area observing sites. The data used were from each site's entire period of record (often stretching back into the 19th Century), and thus are averages rather than normals. Due to the limited number of points for which data are available, there is some "bullseyeing" on the map. These maps are for general information purposes only. For more precise information for your exact location, consult the Kentucky Climate Center or the Indiana State Climate Office.
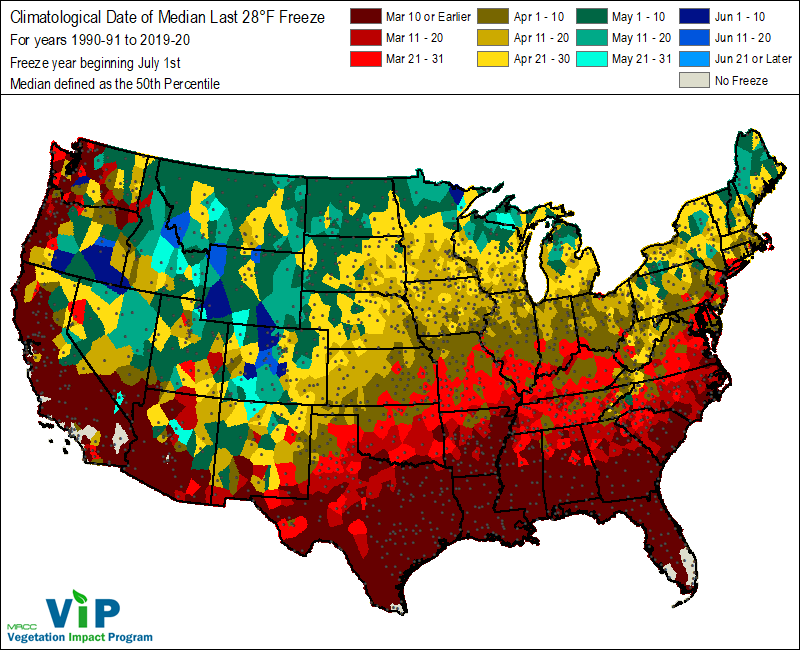
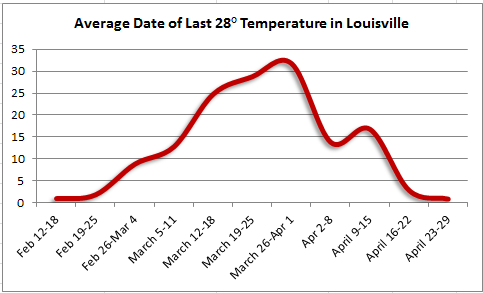
 Last 28 degree temperature in the spring
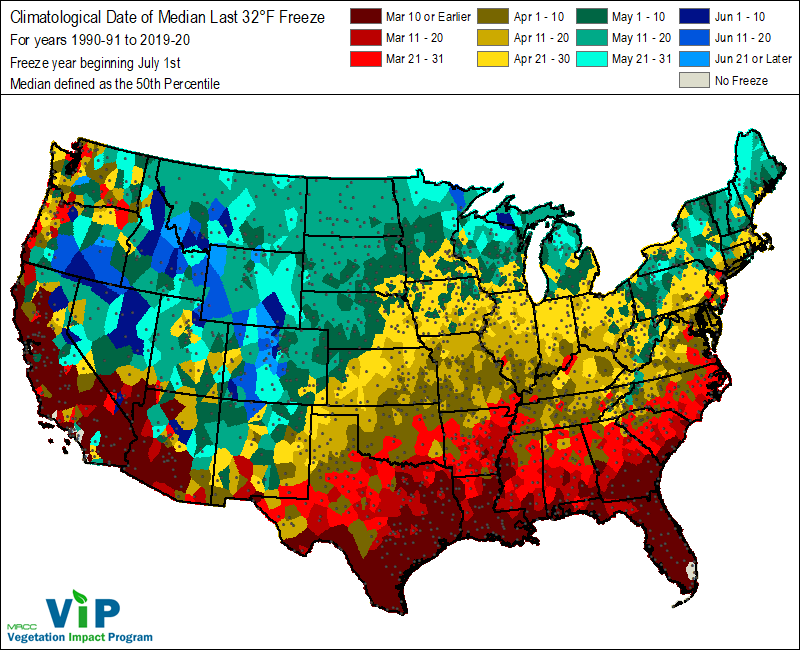
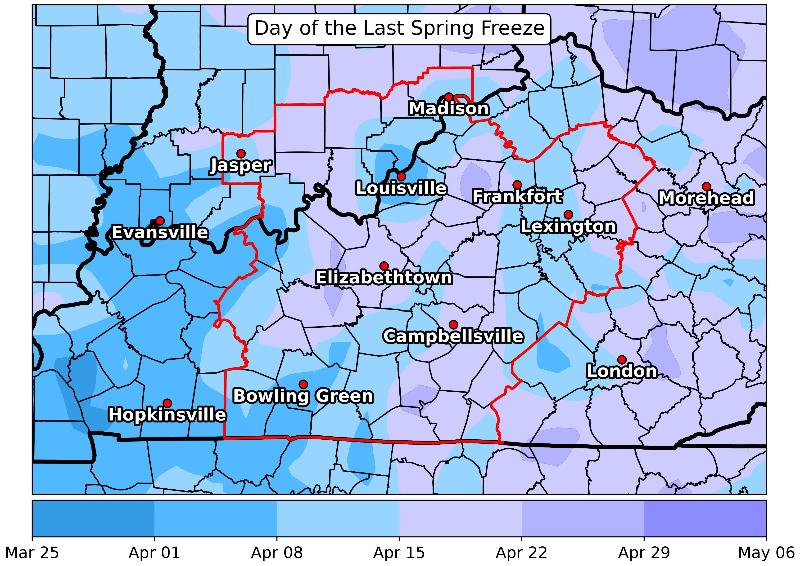
Last 32 degree temperature in the spring
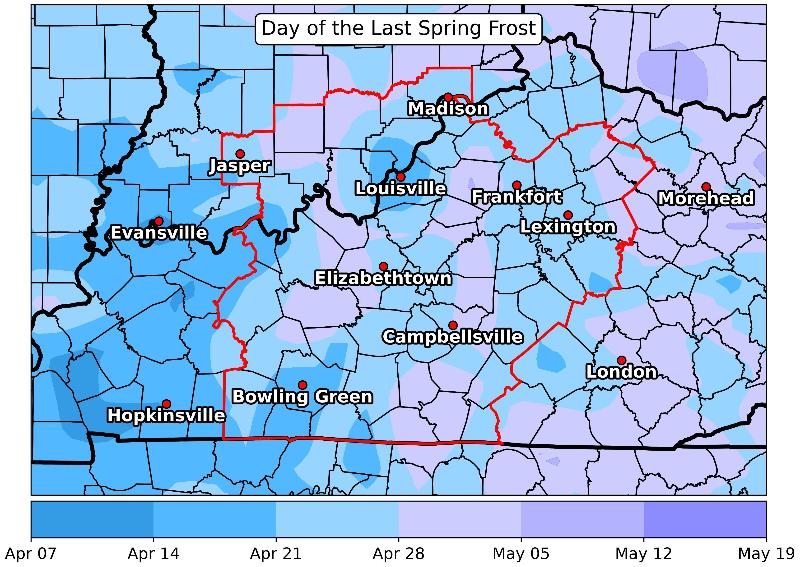
Last 36 degree temperature in the spring
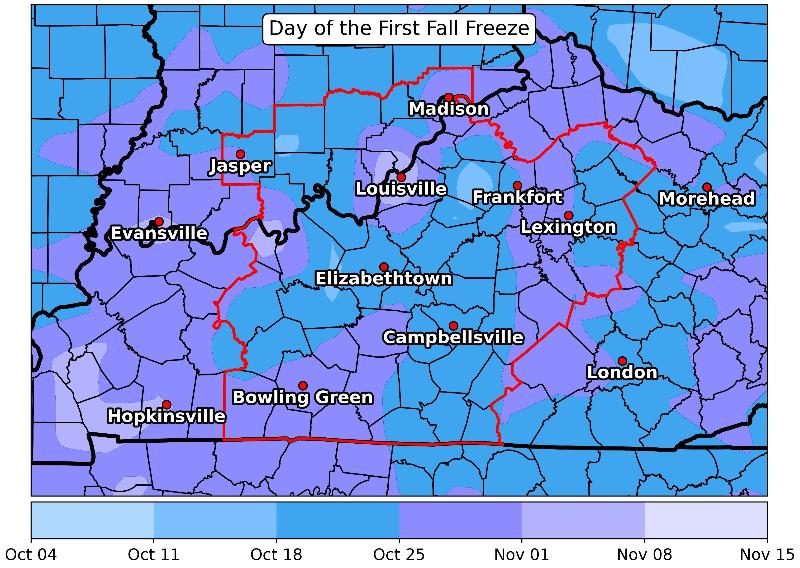
First 36 degree temperature in the fall
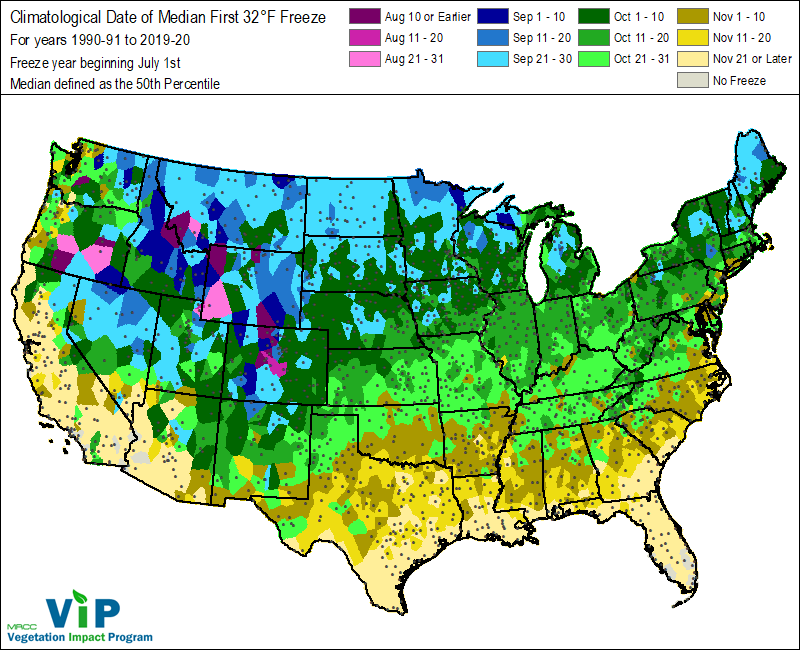
First 32 degree temperature in the fall
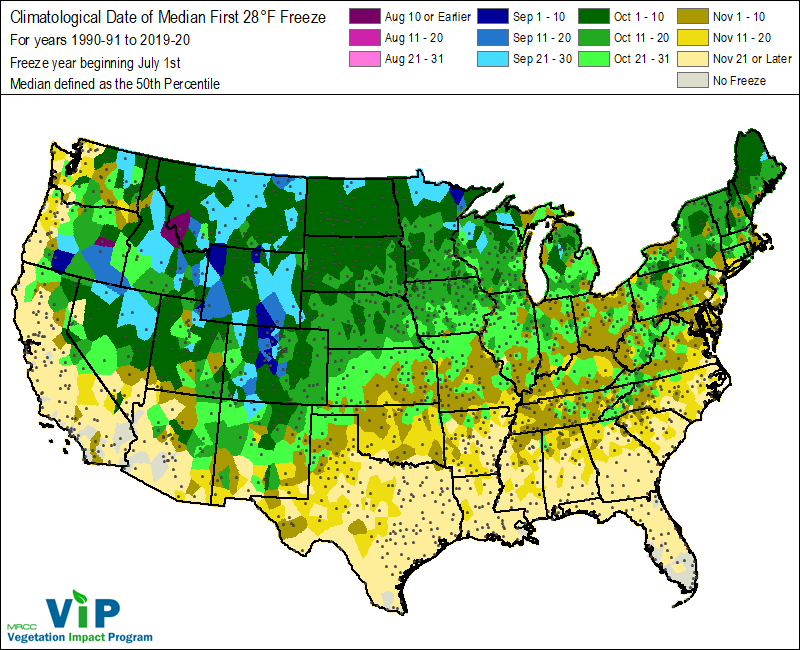
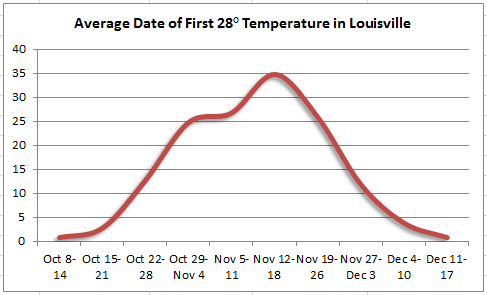
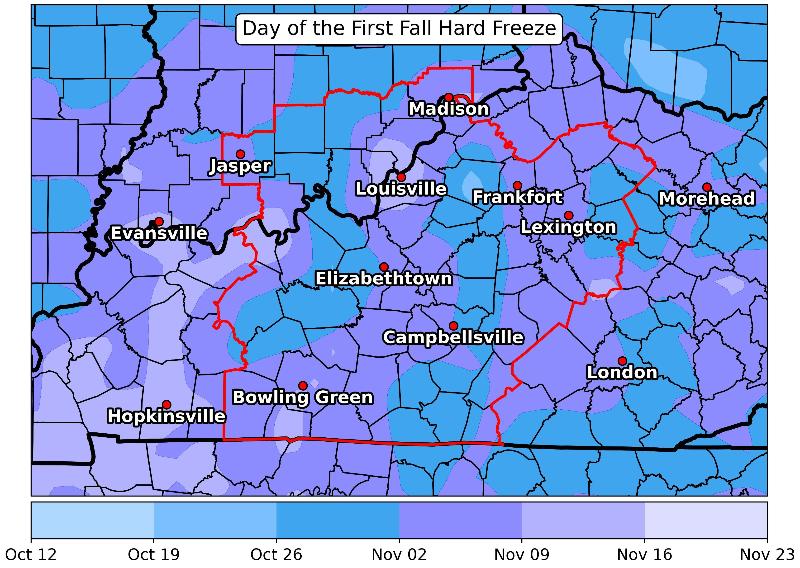
First 28 degree temperature in the fall
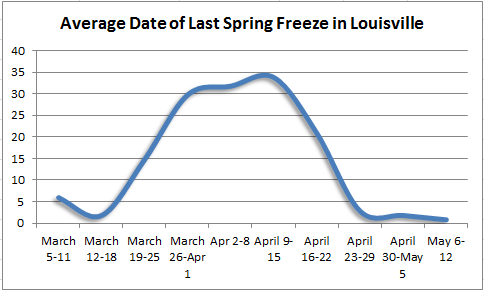
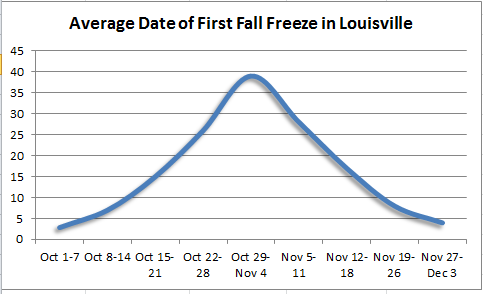
Two tables of graphs follow. The first shows average dates of last spring freeze/hard freeze and first fall freeze/hard freeze. The y-axis shows how many times that event has occurred during each week given on the x-axis. For example, the last spring freeze in Louisville has occurred during the week of April 9-15 34 times (since records began in 1871).
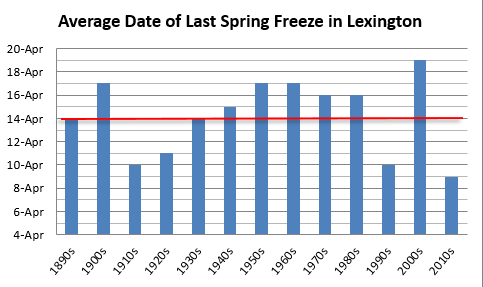
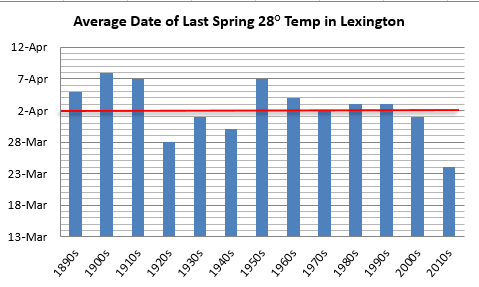
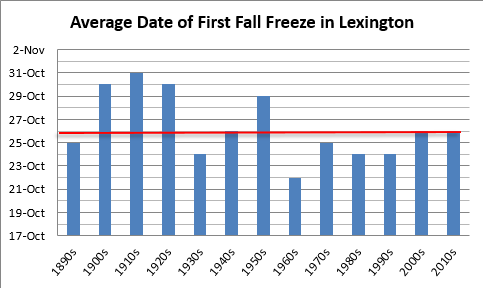
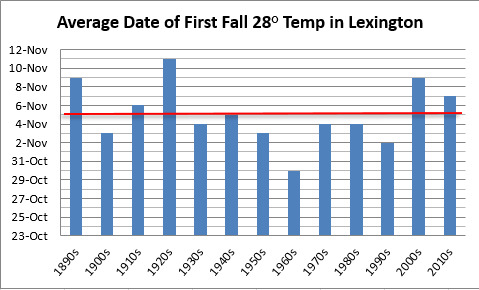
The second table shows how these average dates have changed over time. We broke the historical record down into decades, and found the average date for each decade. The average for the entire period of record is shown with a red line, for comparison.
 |
 |
 |
 |
 |
 |
 |
 |
Frost/Freeze Information for Lexington, Kentucky
Records:
Latest spring frost (36°): May 27, 1961
Latest spring freeze (32°): May 20, 1894
Latest spring hard freeze (28°): May 10, 1966
Earliest final spring frost (36°): April 1, 2019
Earliest final spring freeze (32°): March 17, 1929
Earliest final spring hard freeze (28°): February 15, 2011
Earliest fall frost (36°): September 23, 1896, September 23, 1974, and September 23, 2012
Earliest fall freeze (32°): September 30, 1899
Earliest fall hard freeze (28°): October 3, 1974
Latest first fall frost (36°): November 9, 1922
Latest first fall freeze (32°): November 27, 1902
Latest first fall hard freeze (28°): December 4, 1899
Longest growing season: 242 days in 1922
Shortest growing season: 159 days in 1974
Normals:

Midwest Regional Climate Center Freeze Date Tool
Areawide Frost/Freeze Information
Below is a series of maps showing average first and last dates for selected temperature thresholds. Data were taken from about fifty area observing sites. The data used were from each site's entire period of record (often stretching back into the 19th Century), and thus are averages rather than normals. Due to the limited number of points for which data are available, there is some "bullseyeing" on the map. These maps are for general information purposes only. For more precise information for your exact location, consult the Kentucky Climate Center or the Indiana State Climate Office.
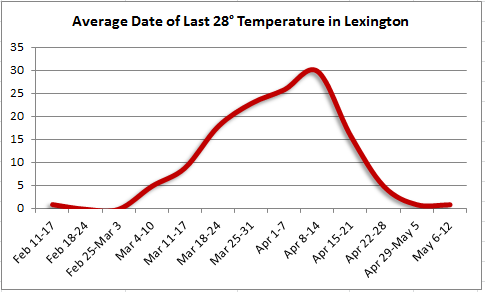
Last 28 degree temperature in the spring
Last 32 degree temperature in the spring
Last 36 degree temperature in the spring
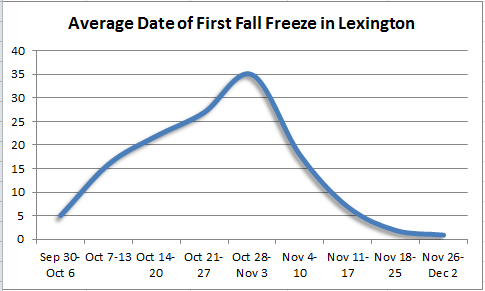
First 36 degree temperature in the fall
First 32 degree temperature in the fall
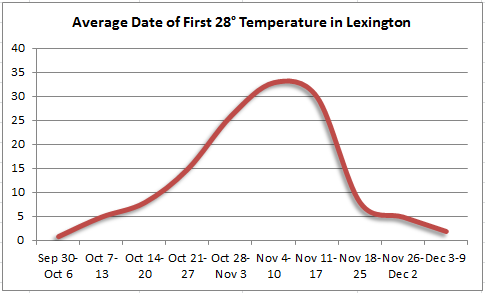
First 28 degree temperature in the fall
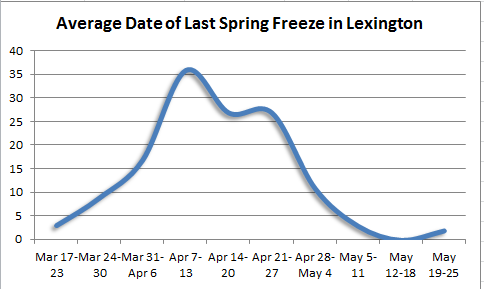
Two tables of graphs follow. The first shows average dates of last spring freeze/hard freeze and first fall freeze/hard freeze. The y-axis shows how many times that event has occurred during each week given on the x-axis. For example, the last spring freeze in Lexington has occurred during the week of April 7-13 34 times (since records began in 1872).
The second table shows how these average dates have changed over time. We broke the historical record down into decades, and found the average date for each decade. The average for the entire period of record is shown with a red line, for comparison. Only decades with sufficient data were used.
 |
 |
 |
 |
 |
 |
 |
 |
Frost/Freeze Information for Bowling Green, Kentucky
Records:
Latest spring frost (36°): May 27, 1961
Latest spring freeze (32°): May 11, 1885
Latest spring hard freeze (28°): April 26, 1873
Earliest final spring frost (36°): March 23, 1967
Earliest final spring freeze (32°): March 18, 1929 and March 18, 1935
Earliest final spring hard freeze (28°): February 23, 2011
Earliest fall frost (36°): September 13, 1902
Earliest fall freeze (32°): September 28, 1889
Earliest fall hard freeze (28°): October 4, 1888
Latest first fall frost (36°): November 10, 2016
Latest first fall freeze (32°): November 16, 1897
Latest first fall hard freeze (28°): December 2, 1985 and December 2, 2004
Longest growing season: 232 days in 1922
Shortest growing season: 163 days in 1909
Normals:

Midwest Regional Climate Center Freeze Date Tool
Areawide Frost/Freeze Information
Below is a series of maps showing average first and last dates for selected temperature thresholds. Data were taken from about fifty area observing sites. The data used were from each site's entire period of record (often stretching back into the 19th Century), and thus are averages rather than normals. Due to the limited number of points for which data are available, there is some "bullseyeing" on the map. These maps are for general information purposes only. For more precise information for your exact location, consult the Kentucky Climate Center or the Indiana State Climate Office.
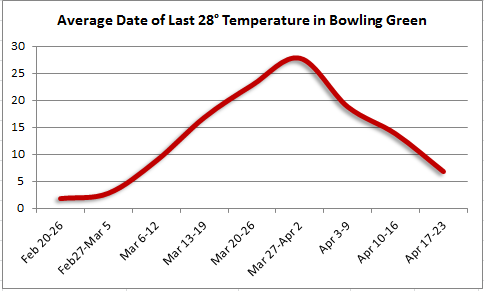
Last 28 degree temperature in the spring
Last 32 degree temperature in the spring
Last 36 degree temperature in the spring
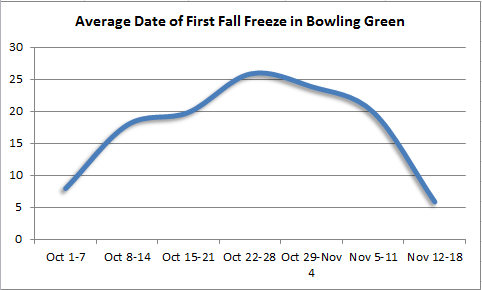
First 36 degree temperature in the fall
First 32 degree temperature in the fall
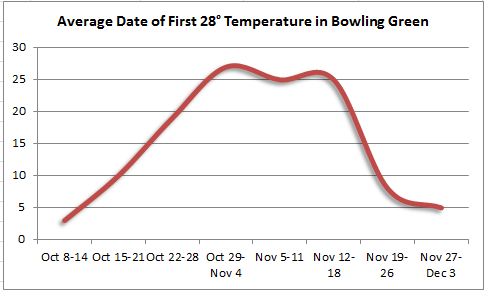
First 28 degree temperature in the fall
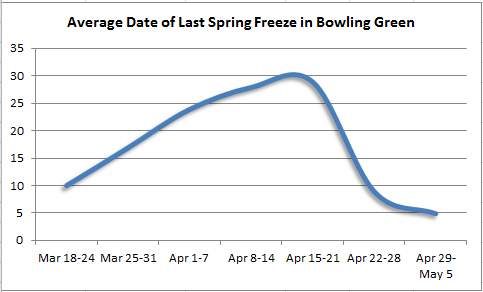
Two tables of graphs follow. The first shows average dates of last spring freeze/hard freeze and first fall freeze/hard freeze. The y-axis shows how many times that event has occurred during each week given on the x-axis. For example, the last spring freeze in Bowling Green has occurred during the week of April 29-May 5 five times (since available records began in 1893).
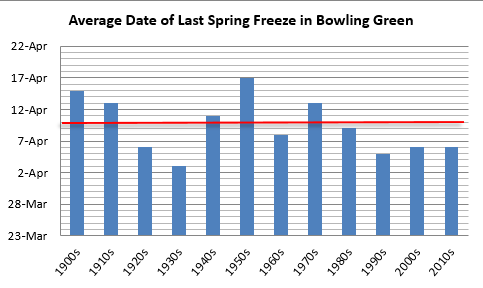
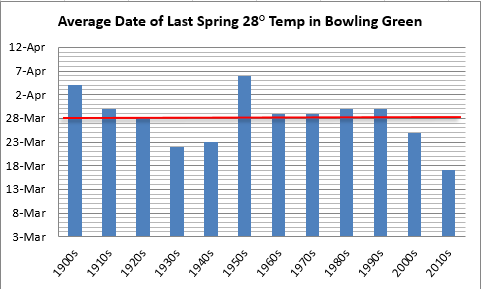
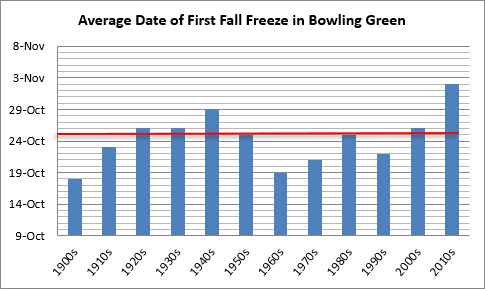
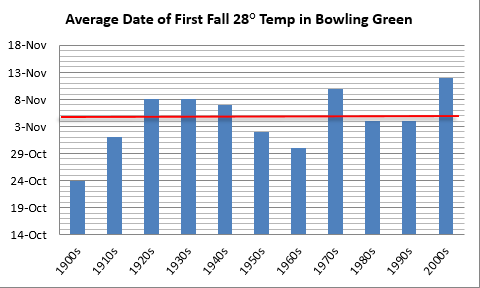
The second table shows how these average dates have changed over time. We broke the historical record down into decades, and found the average date for each decade. The average for the entire period of record is shown with a red line, for comparison. Only decades with sufficient data were used.
 |
 |
 |
 |
 |
 |
 |
 |
Frost/Freeze Information for Frankfort, Kentucky
Records:
Latest spring frost (36°): June 1, 1966
Latest spring freeze (32°): May 22, 2002
Latest spring hard freeze (28°): May 9, 2020
Earliest final spring frost (36°): April 7, 1896
Earliest final spring freeze (32°): March 25, 1912
Earliest final spring hard freeze (28°): February 26, 1905
Earliest fall frost (36°): September 14, 1902
Earliest fall freeze (32°): September 25, 1896
Earliest fall hard freeze (28°): October 11, 1906 and October 11, 1964
Latest first fall frost (36°): November 8, 1985
Latest first fall freeze (32°): November 13, 1986
Latest first fall hard freeze (28°): December 4, 1899
Longest growing season: 216 days in 1929
Shortest growing season: 158 days in 1942
Normals:

Midwest Regional Climate Center Freeze Date Tool
Areawide Frost/Freeze Information
Below is a series of maps showing average first and last dates for selected temperature thresholds. Data were taken from about fifty area observing sites. The data used were from each site's entire period of record (often stretching back into the 19th Century), and thus are averages rather than normals. Due to the limited number of points for which data are available, there is some "bullseyeing" on the map. These maps are for general information purposes only. For more precise information for your exact location, consult the Kentucky Climate Center or the Indiana State Climate Office.
Last 28 degree temperature in the spring
Last 32 degree temperature in the spring
Last 36 degree temperature in the spring
First 36 degree temperature in the fall
First 32 degree temperature in the fall
First 28 degree temperature in the fall
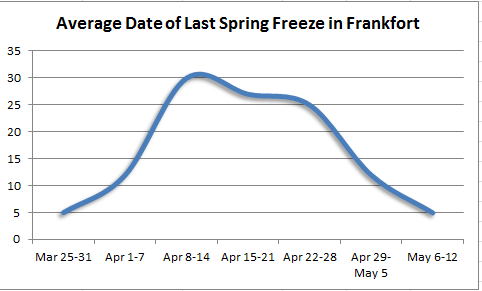
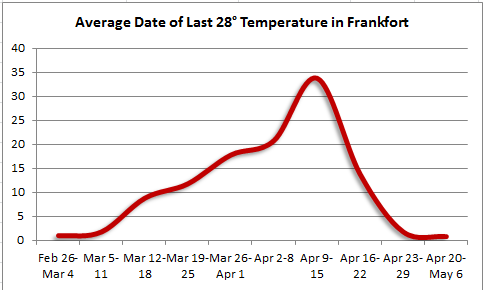
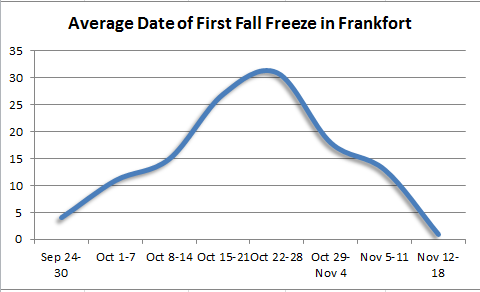
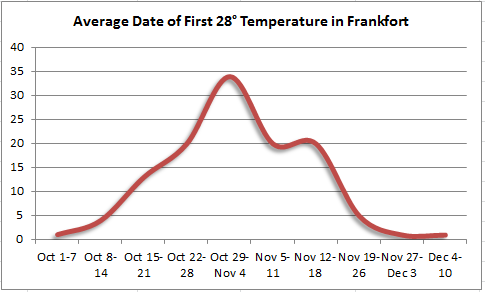
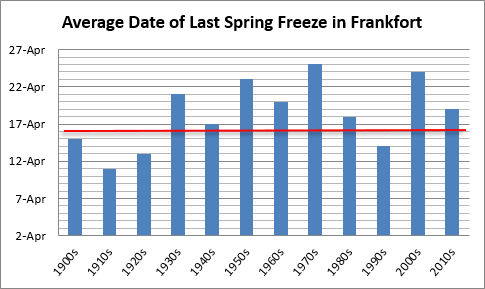
Two tables of graphs follow. The first shows average dates of last spring freeze/hard freeze and first fall freeze/hard freeze. The y-axis shows how many times that event has occurred during each week given on the x-axis. For example, the last spring freeze in Frankfort has occurred during the week of April 8-14 27 times (since available records began in 1895).
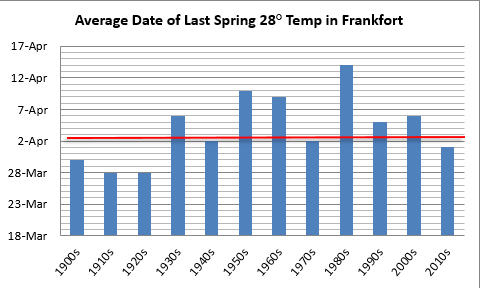
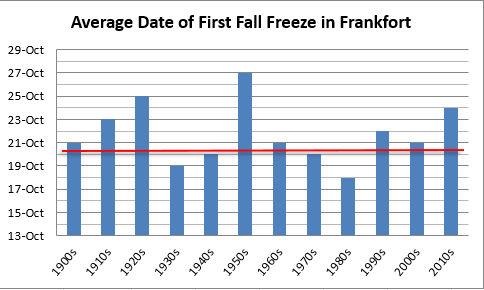
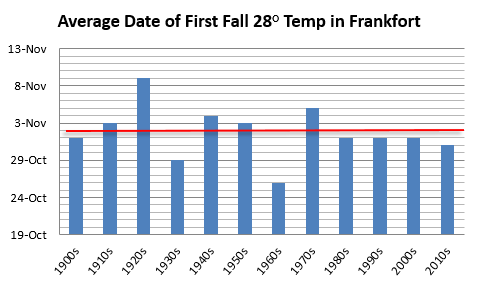
The second table shows how these average dates have changed over time. We broke the historical record down into decades, and found the average date for each decade. The average for the entire period of record is shown with a red line, for comparison. Only decades with sufficient data were used.
 |
 |
 |
 |
 |
 |
 |
 |
Areawide Frost/Freeze Information
Below is a series of maps showing average first and last dates for selected temperature thresholds (click on the maps for a larger version). These maps are for general information purposes only. For more precise information for your exact location, consult the Kentucky Climate Center or the Midwestern Regional Climate Center (MRCC). For county-level data, check out the MRCC's Freeze Date Tool.
| Last 28° temperature in the spring | Last 32° temperature in the spring | Last 36° temperature in the spring |
 |
 |
 |
| First 36° temperature in the fall | First 32° temperature in the fall | First 28° temperature in the fall |
 |
 |
 |


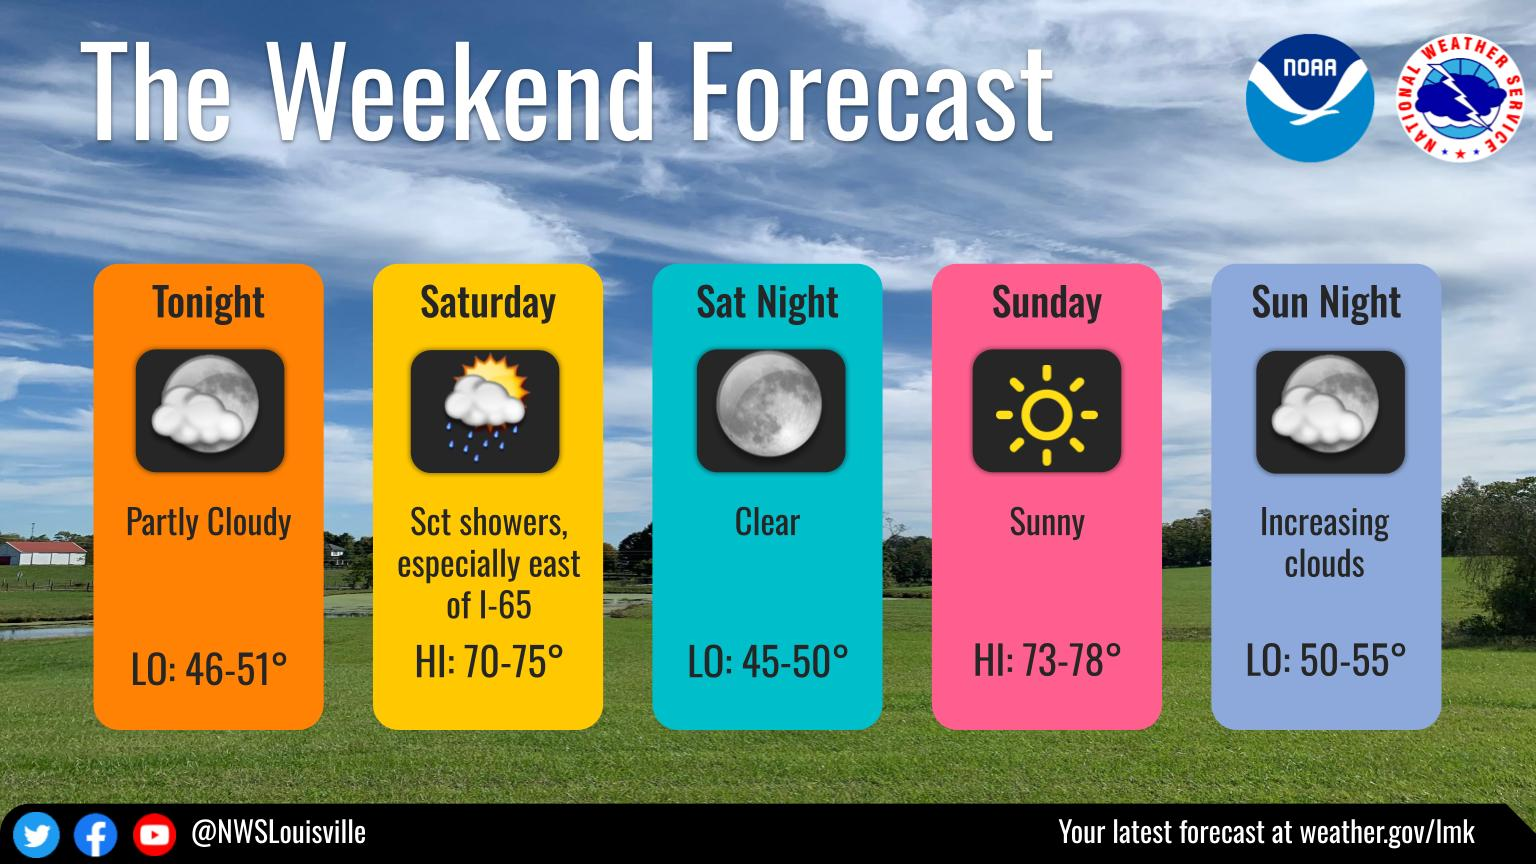 Weather Story
 Weather Map
 Local Radar