
Hurricane Andrew was the strongest and most devastating hurricane on record to hit southern Florida. When it made landfall, Andrew was a Category 5 hurricane, with maximum sustained winds of 165 mph and a minimum central pressure of 922 millibars. It’s one of only four hurricanes to make landfall in the United States as a Category 5 since 1900 (the others being the 1935 Florida Keys Labor Day storm, Hurricane Camille in 1969, and Hurricane Michael in 2018).
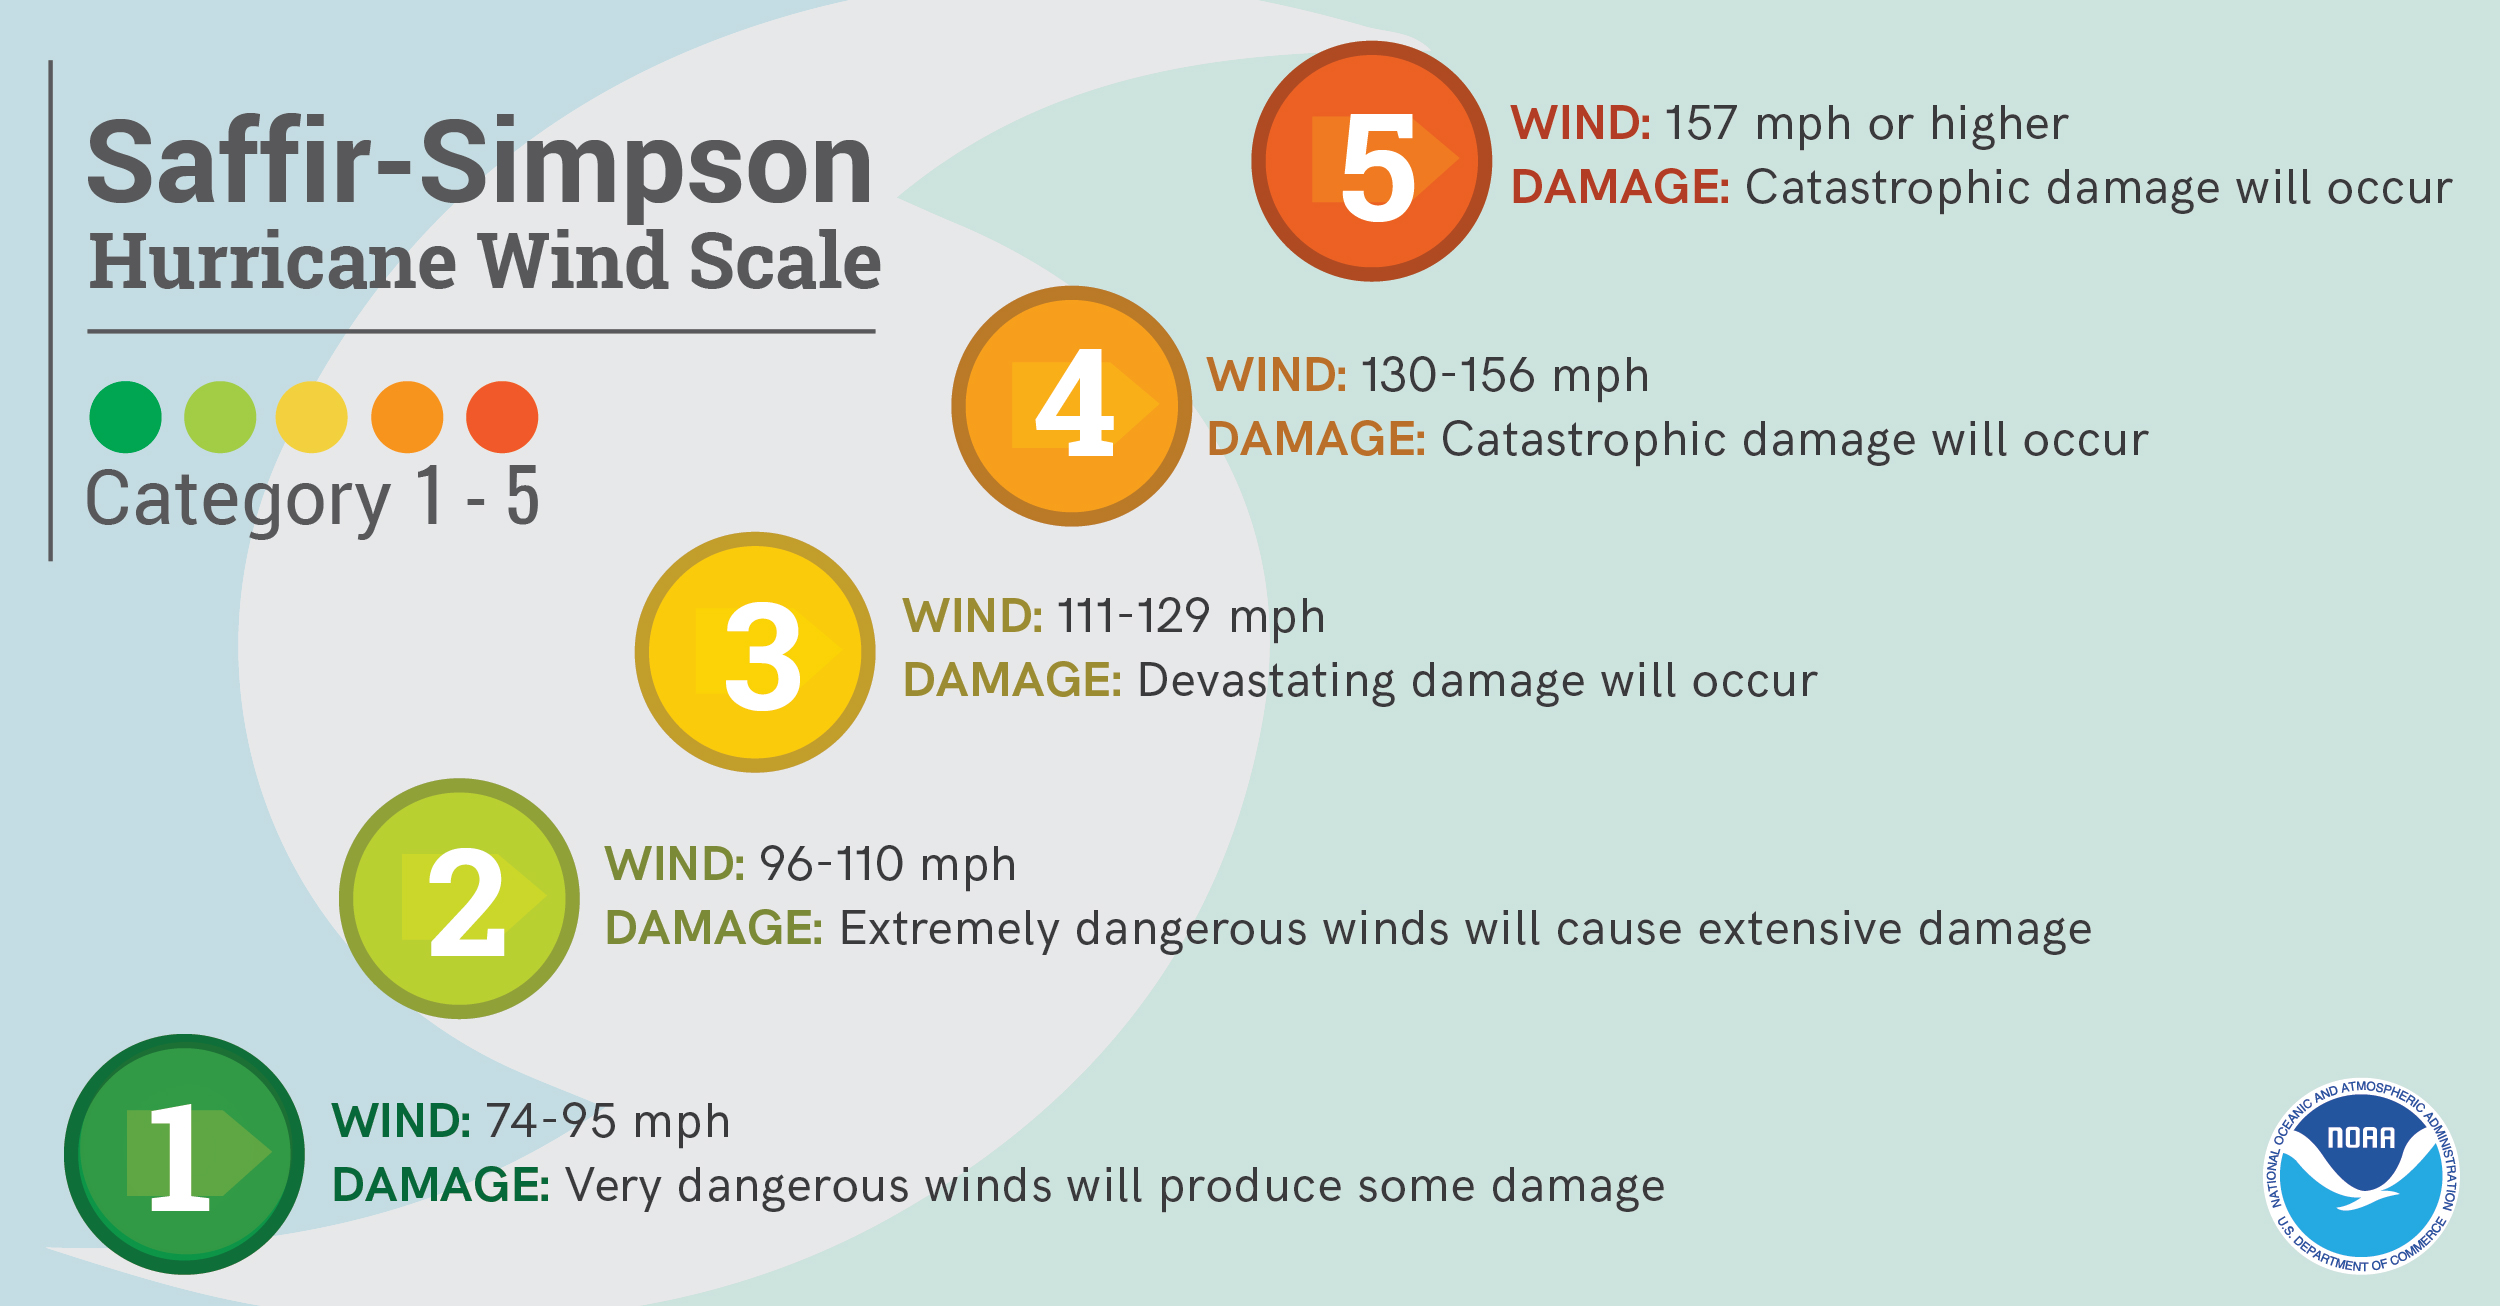
Chart showing the Saffir-Simpson Hurricane Wind Scale used to categorize hurricanes.
It struck South Miami-Dade County (then known as Dade County) during the pre-dawn hours on Monday, August 24, 1992. It caused an estimated $26 billion in damage in the United States making it at the time the most expensive natural disaster in United States history, not to be surpassed until Hurricane Katrina 13 years later. In Homestead, Florida—the hardest hit community—more than 99% of the mobile homes were completely destroyed.
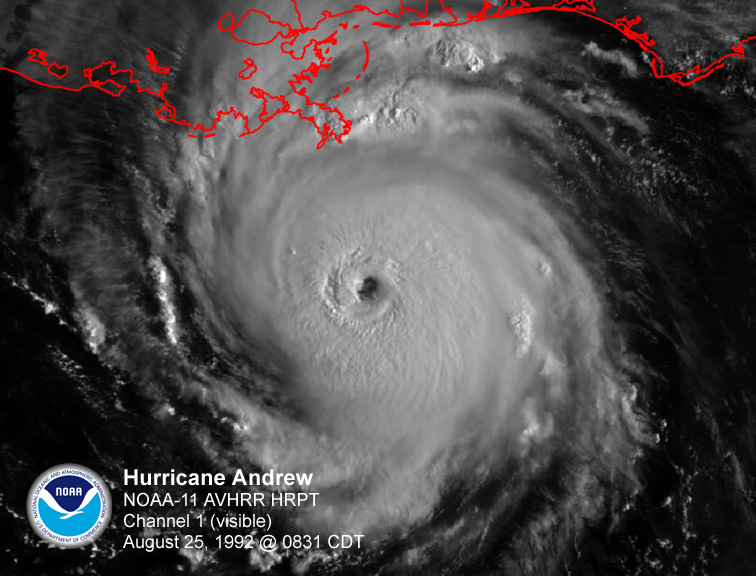
After leaving Florida, Andrew moved into the Gulf of America and made a second landfall near Point Chevreuil, Louisiana, on August 26, 1992, as a Category 3 hurricane with winds of 115 mph and a central pressure of 956 millibars. The damage to Louisiana was estimated at around $1 billion.
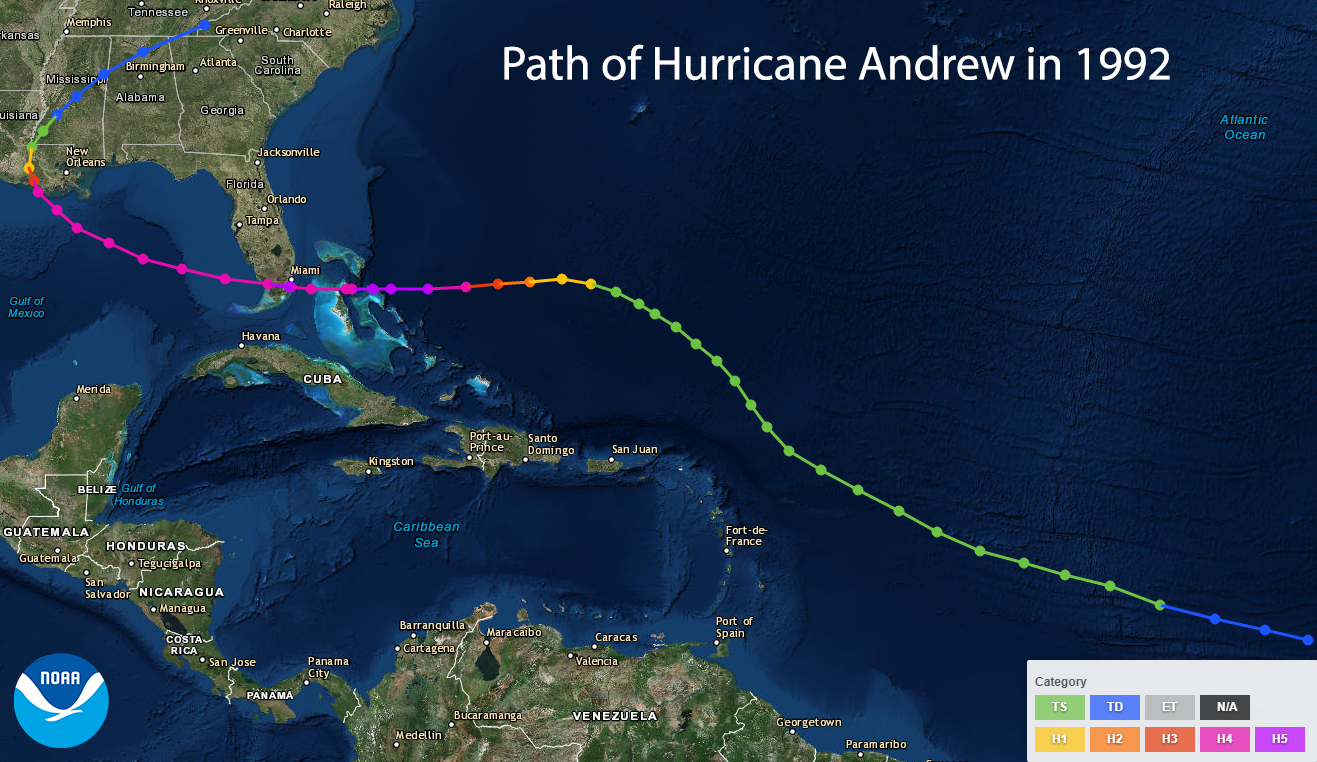
Path of Hurricane Andrew.
While storm surge typically accounts for the most devastation during tropical cyclones, it was Hurricane Andrew’s extremely strong winds that caused most of the damage. This compact, yet powerful storm directly caused 65 deaths (23 in the U.S. alone), decimated the urban landscape of southern Miami-Dade County, and reshaped communities to this day. Andrew’s intensity, combined with lax enforcement of building codes, destroyed over 25,000 homes, leaving more than 160,000 residents homeless. In Homestead alone, the storm obliterated nearly 99% of all mobile homes, leaving the area unrecognizable.


|
Left Image: Hurricane Andrew made landfall in South Florida on Aug 24, 1992, leaving devastating destruction in its wake. Right Image: Some of the extensive Damage to homes in Miami. (Credit: Huffington Post) |


|
Left Image: A piece of plywood driven through the trunk of a royal palm. Right Image: Pine trees snapped by force of wind at Pinewoods Villa. |


|
Left Image: This Aug. 25, 1992 photo shows the water tower, a landmark in Florida City, still standing over the ruins of the Florida coastal community that was hit by the force of Hurricane Andrew. (Credit: AP Photo) Right Image: The force of the storm left entire towns decimated. Hurricane Andrew left 65 people dead (23 in the US) and cost an estimated $26.5 billion in damages. (Credit: Huffington Post) |
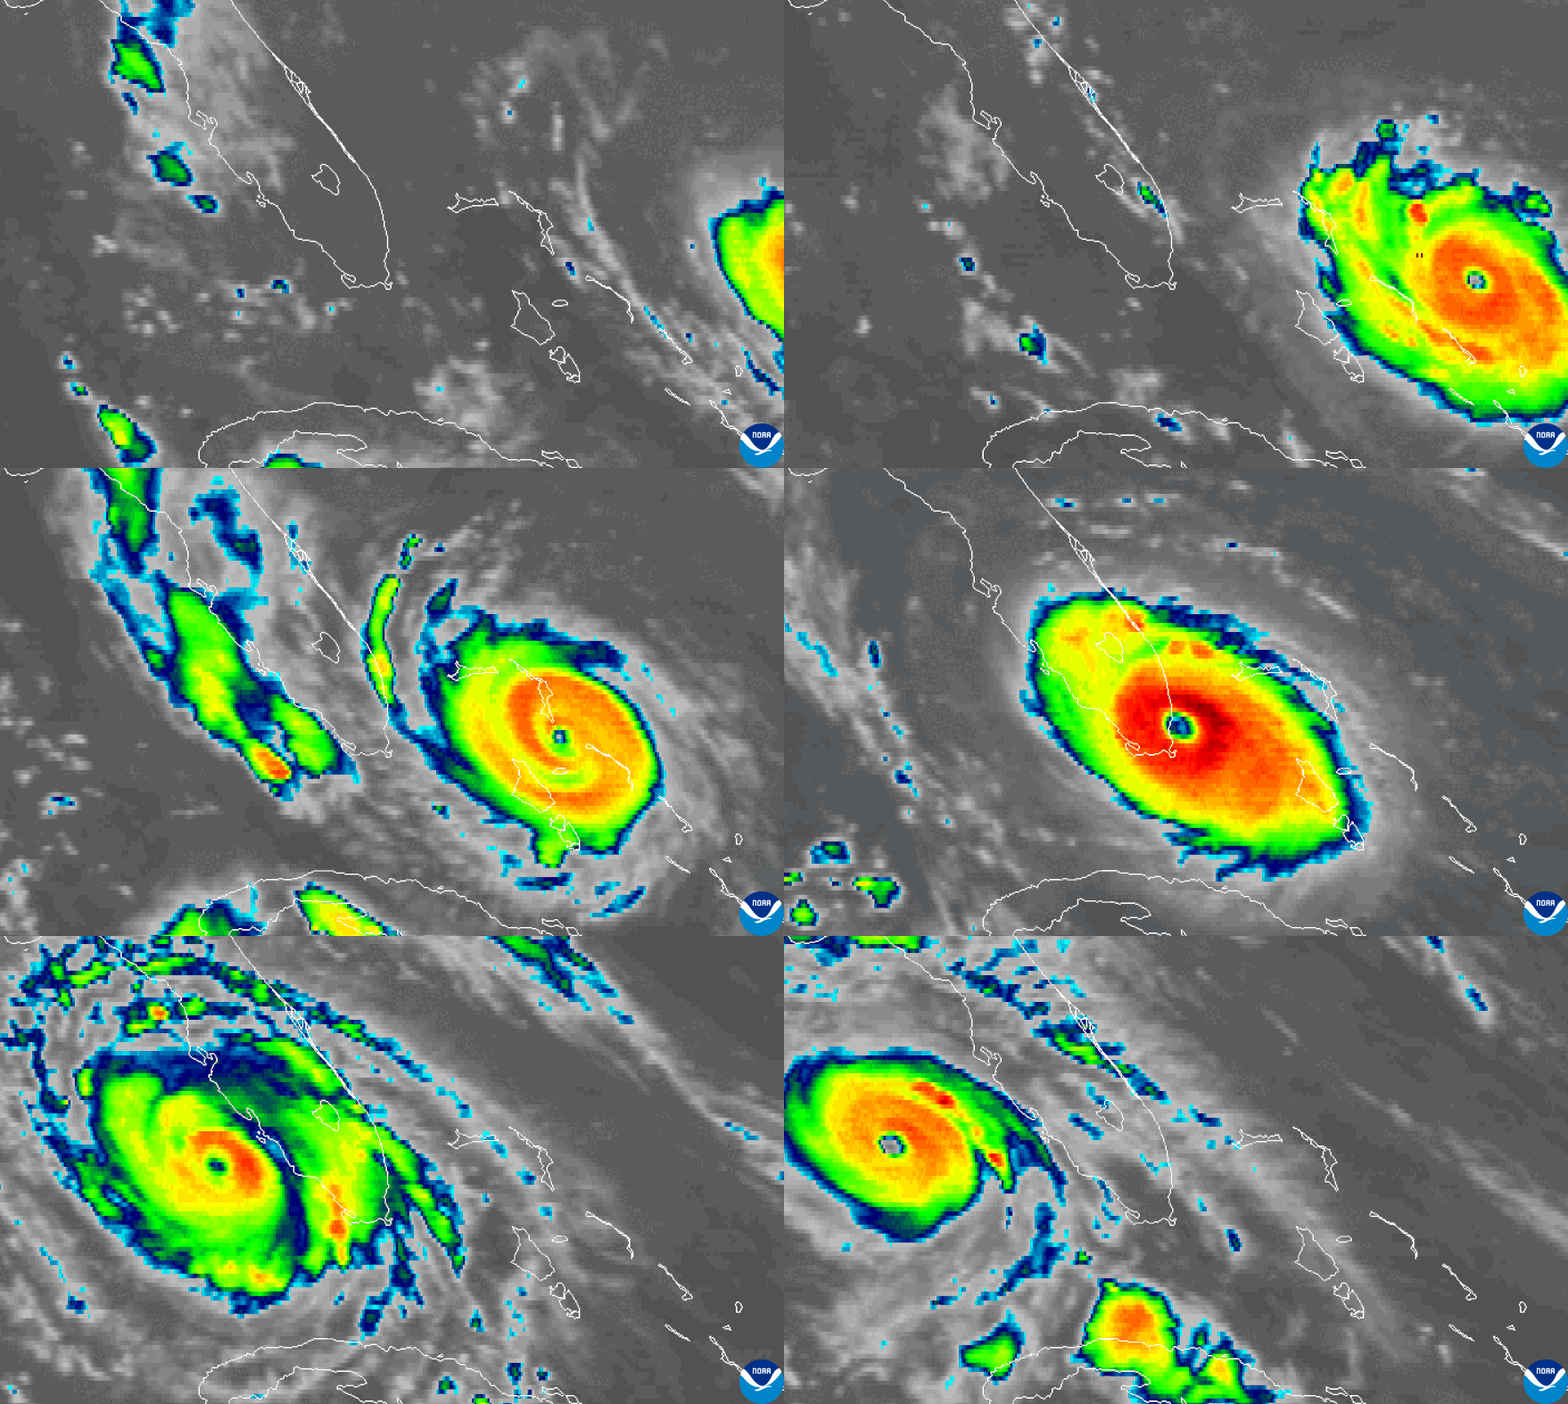
|
Left Image: Color-enhanced infrared animation from NOAA’s GOES-7 satellite of Hurricane Andrew from August 22-24, 1992. Right Image: Visible image from the NOAA-11 polar-orbiting satellite of Hurricane Andrew south of Louisiana at 8:31 am CDT on Aug 25, 1992. |
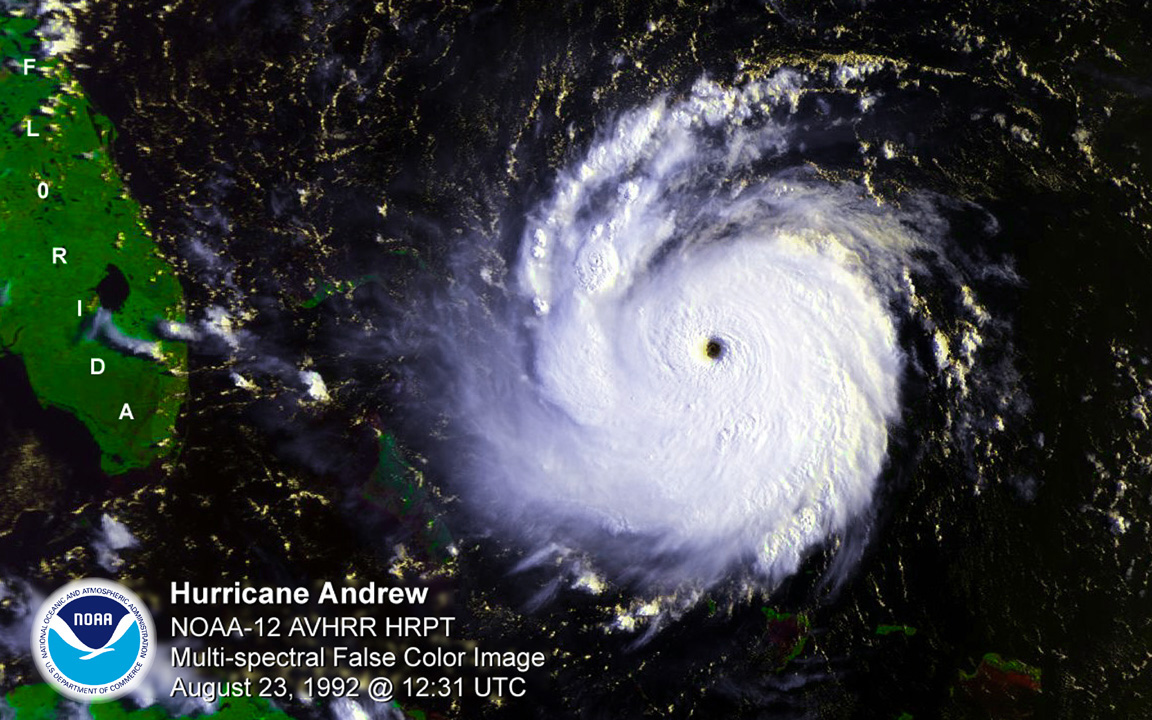
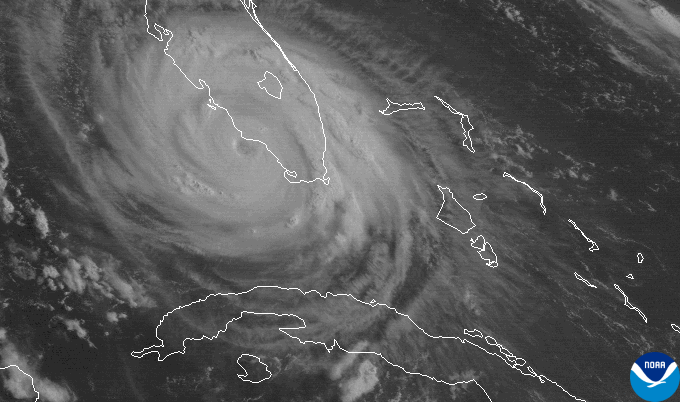
|
Left Image: Color-enhanced multi-spectral image from the NOAA-12 polar-orbiting satellite of Hurricane Andrew approaching South Florida at 8:31 am EDT on August 23, 1992. Right Image: 2km-resolution visible image from NOAA’s GOES-7 satellite of Hurricane Andrew at 12:01 EDT on August 24, 1992, after the storm crossed South Florida. |
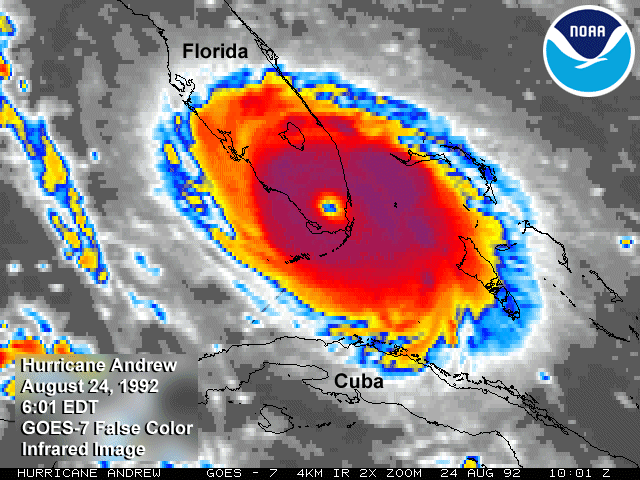
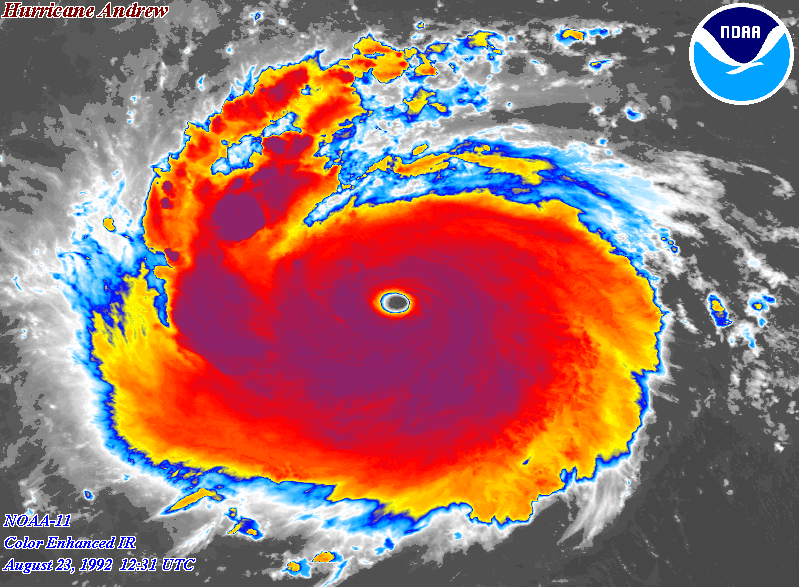
|
Left Image: Color-enhanced infrared image from NOAA’s GOES-7 satellite of Andrew crossing South Florida at 6:01 am EDT on August 24, 1992. Right Image: Color-enhanced infrared image from the NOAA-11 satellite of Andrew east of South Florida at 8:31 am EDT on Aug 23, 1992. |
In the 30 years since Andrew, NOAA scientists, forecasters and partners have revolutionized hurricane forecasting to save lives and property. Direct experience of the destructive power of this storm inspired our scientists to apply what they learned and fueled their desire to make continual improvements over the last three decades. Since Andrew, NOAA Atlantic Oceanographic Meteorological Laboratory hurricane researchers have made great strides to advance hurricane prediction through improved observations, forecast models, and analyses.
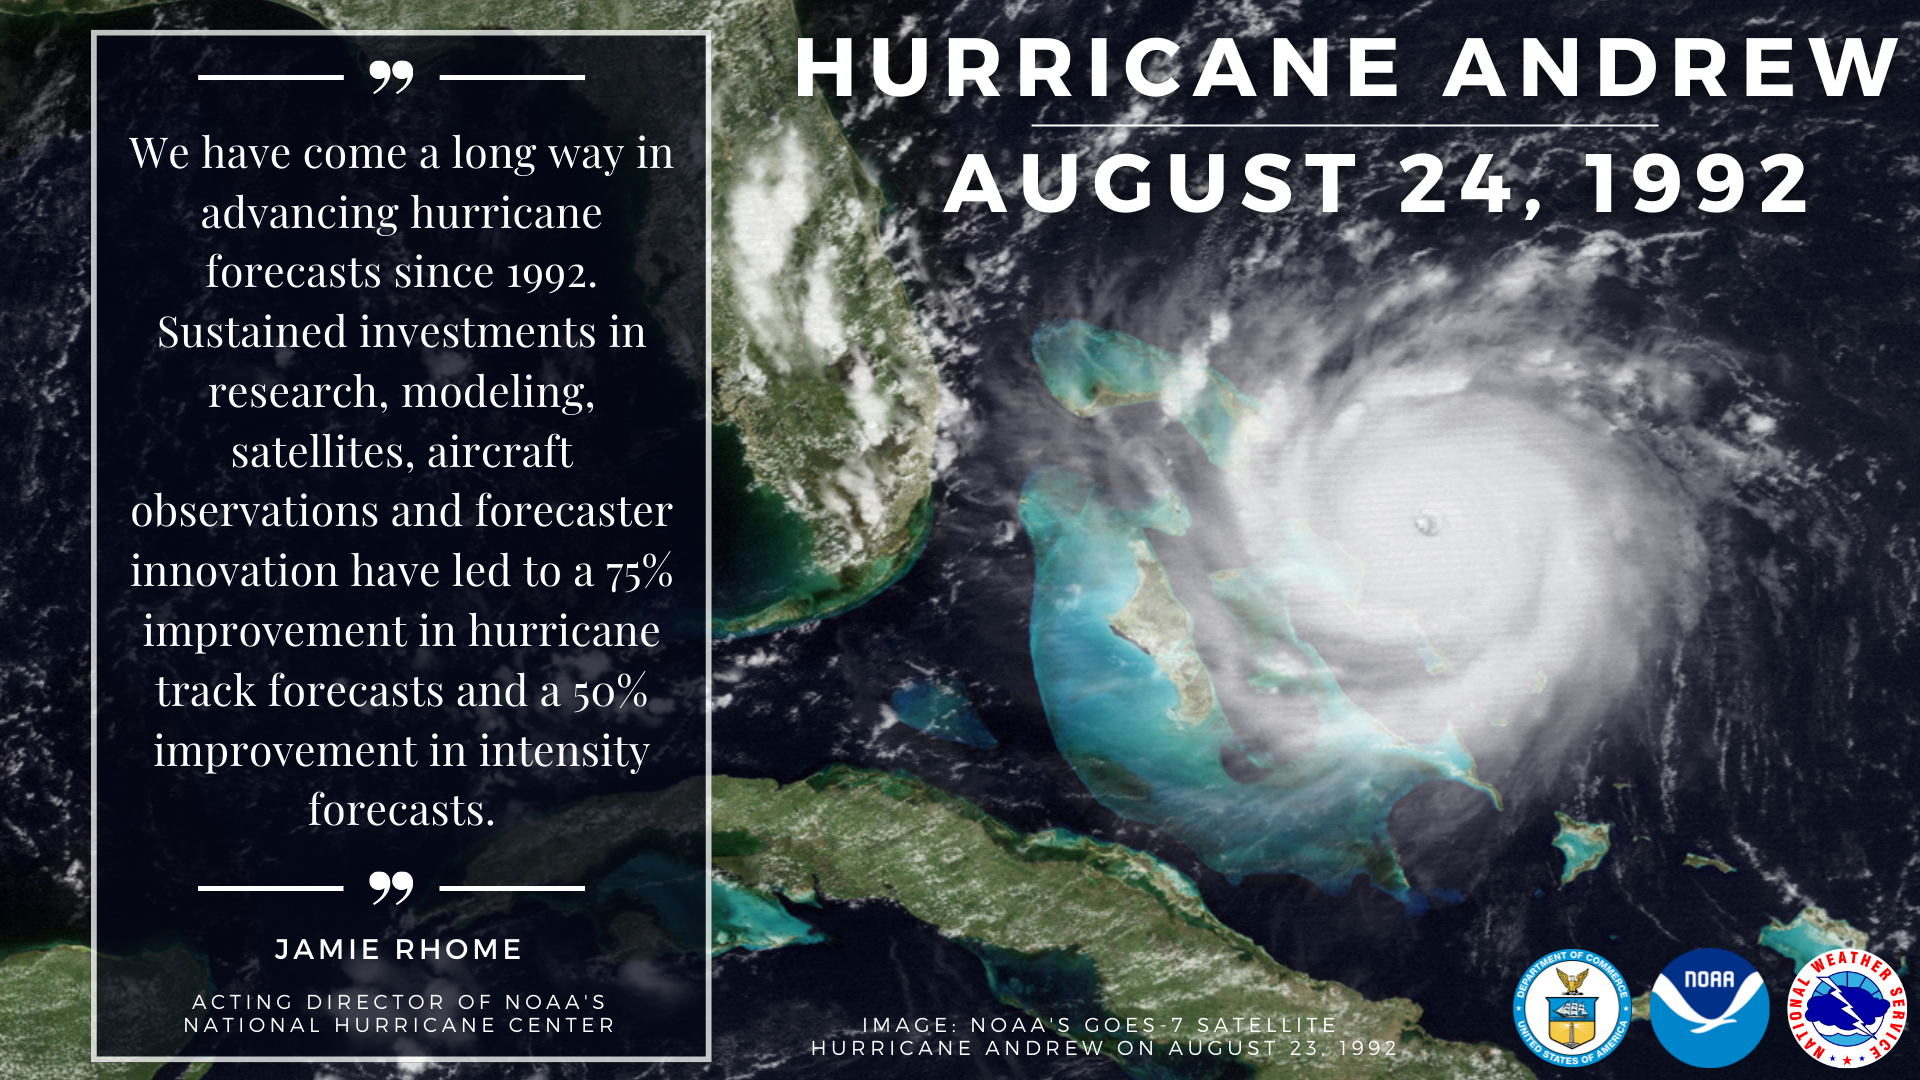
NOAA’s National Hurricane Center has drastically improved its track and intensity forecasts, increasing track accuracy by 75% and intensity forecasts by 50% since Hurricane Andrew. NOAA scientists now use an array of satellite information, land-based, sea-based, and aircraft-related instruments to collect observational data.
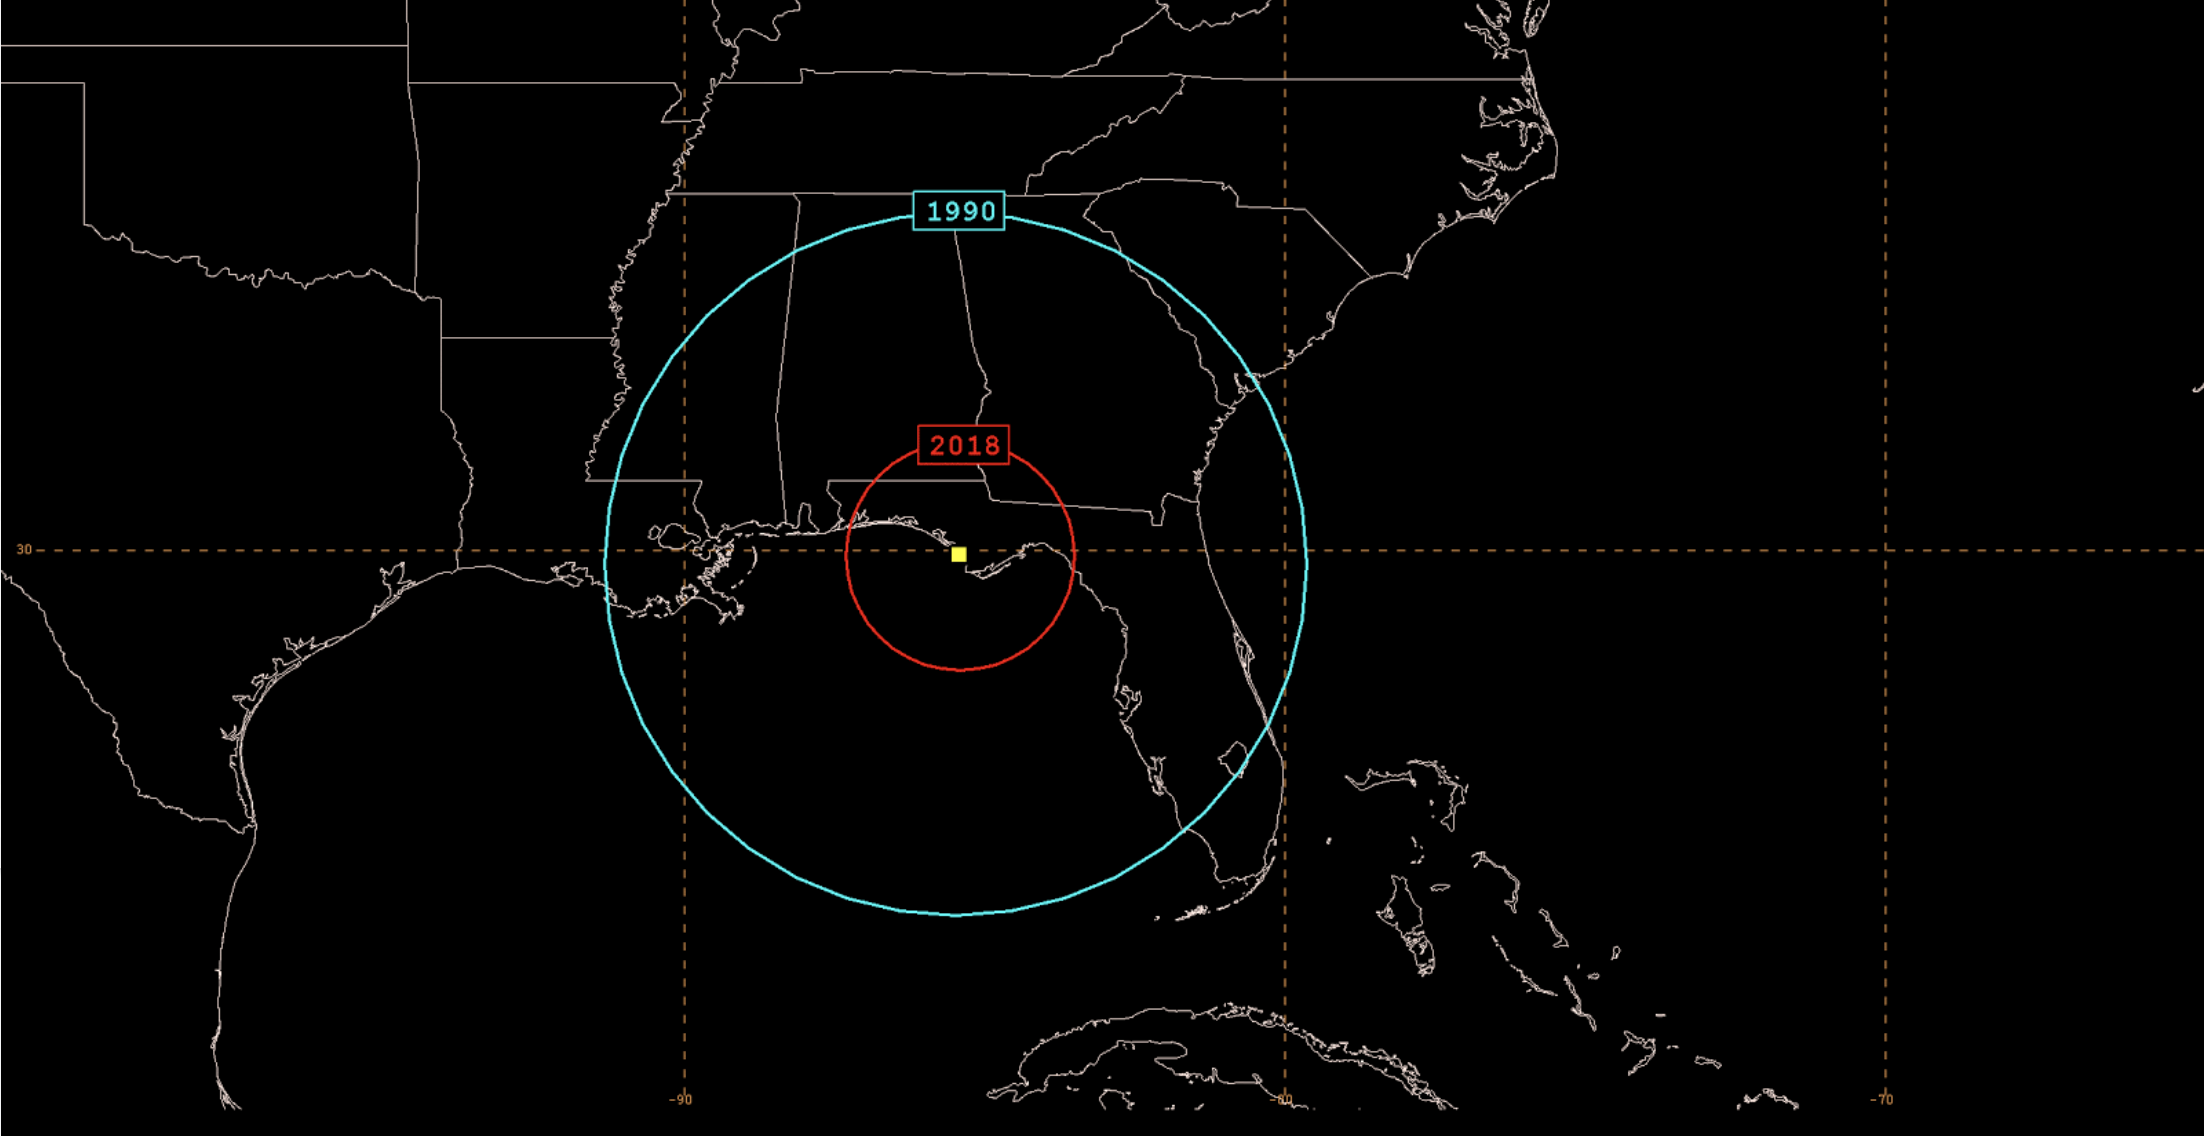
| Improving Hurricane Track Forecasts: This image shows how improvements to hurricane track forecasts from 1990 to 2018 can lead to a much more precise areas being warned of a hurricane |
|
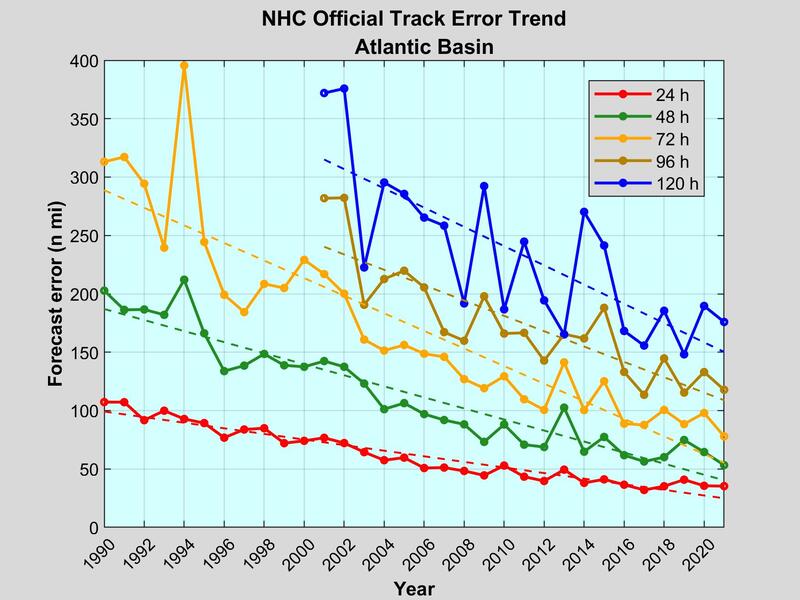
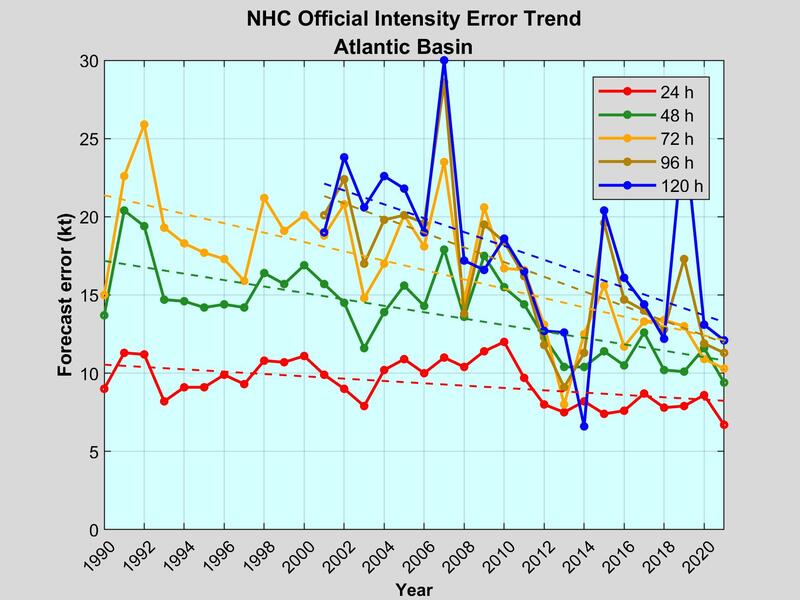
Left Image: Annual average official track errors for Atlantic basin tropical cyclones from 1990-2021. Right Image: Annual average official intensity errors for Atlantic basin tropical cyclones from 1990-2021. |
The verification charts above show the decreasing trend in forecast errors since 1990. Hurricane forecasts and observations continue to improve thanks partnerships with the National Aeronautics and Space Administration (NASA), National Science Foundation (NSF), NOAA’s Aircraft Operation Center (AOC), the Office of Naval Research (ONR), NOAA's Joint Hurricane Testbed (JHT), and the Hurricane Forecast Improvement Project (HFIP).
Andrew was one of only seven storms during the 1992 Atlantic hurricane season, but still stands as a stark reminder, “It only takes one storm to make a very bad season.” Having a plan in place is vital for everyone who lives or visits hurricane-prone regions. More preparedness information is available from FEMA, NOAA’s National Hurricane Center and AOML’s Hurricane FAQ page.
If interested, you can read the National Hurricane Center's entire report on Hurricane Andrew HERE.