The wetness of 2018 (our wettest year on record) continued into the first half of 2019. However, the tap turned off in early July leading to a much drier second half of 2019. We even managed to develop some drought in the autumn along with amazingly hot temperatures never before seen so late in the season.
Despite the wet start to the year, 2019 was not particularly stormy. Only five tornadoes were recorded, all of which were EF1 or weaker and occurred on just three days.
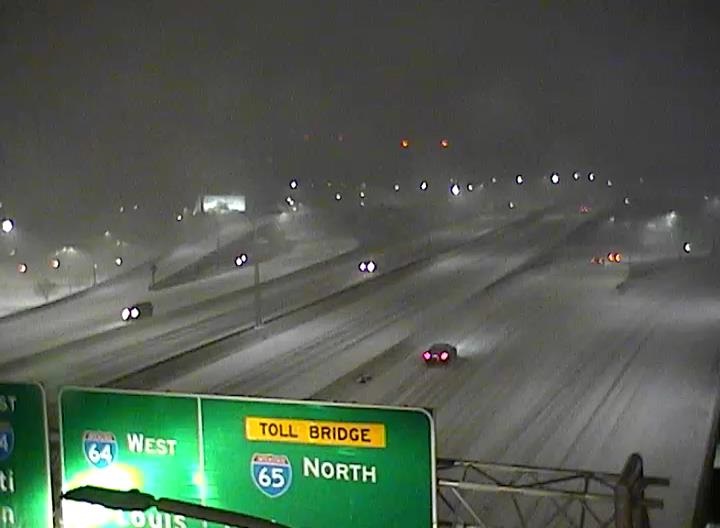
January 19-20: A quick-hitting winter storm brought 1-3" of snow to the region propelled by winds gusting 30-40 mph.
February 6: High pressure over Florida and low pressure moving into the Ohio Valley brought very warm air northward. Record warm lows were set at Bowling Green (58°) and Lexington (57°), and tied at Louisville (51°).
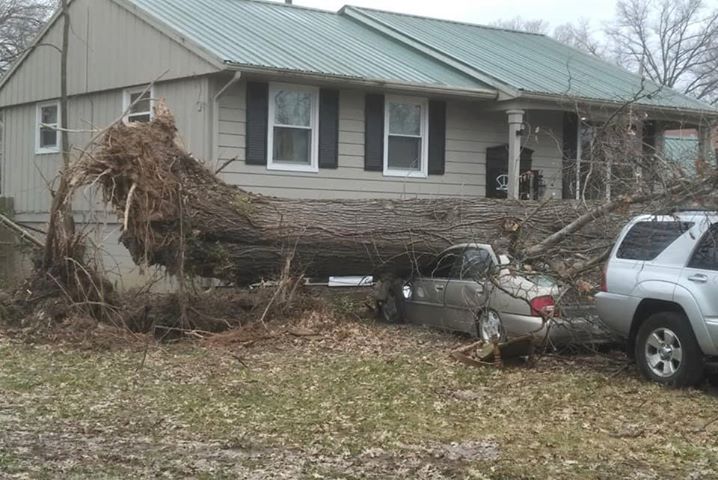
March 14: Powerful low pressure over the Plains brought strong winds and scattered storms to the Ohio Valley. Tornadoes were reported from western Kentucky to central Indiana, including a small EF0 in northern Washington County, Indiana.
April 12: An isolated thunderstorm developed just northeast of Louisville and produced an EF1 tornado that tracked for about eight miles across Oldham County. The tornado was quite unusual in that it occurred around 6:50 in the morning.
May 19-28: This was a period of exceptionally warm nights as a stubborn upper ridge sat over the southeast United States. Bowling Green set record warm low temperatures on the 19th (71°), 22nd (73°), 23rd (71°), and 28th (74°). The low of 74° on the 28th was the warmest daily low temperature ever recorded in May in Bowling Green. Louisville set a new record warm low of 75° on the 25th and 28th, which was just one degree away from the city's all-time record warm low for May. Thanks to clouds and humidity, no record highs were set.
June 14: We experienced a brief summertime cold snap as a Canadian air mass settled into the Ohio and Tennessee Valleys. Lexington set a record low of 45°. The last time it was colder than that in June in Lexington was on June 7, 1998 when the thermometer dropped to 44°.
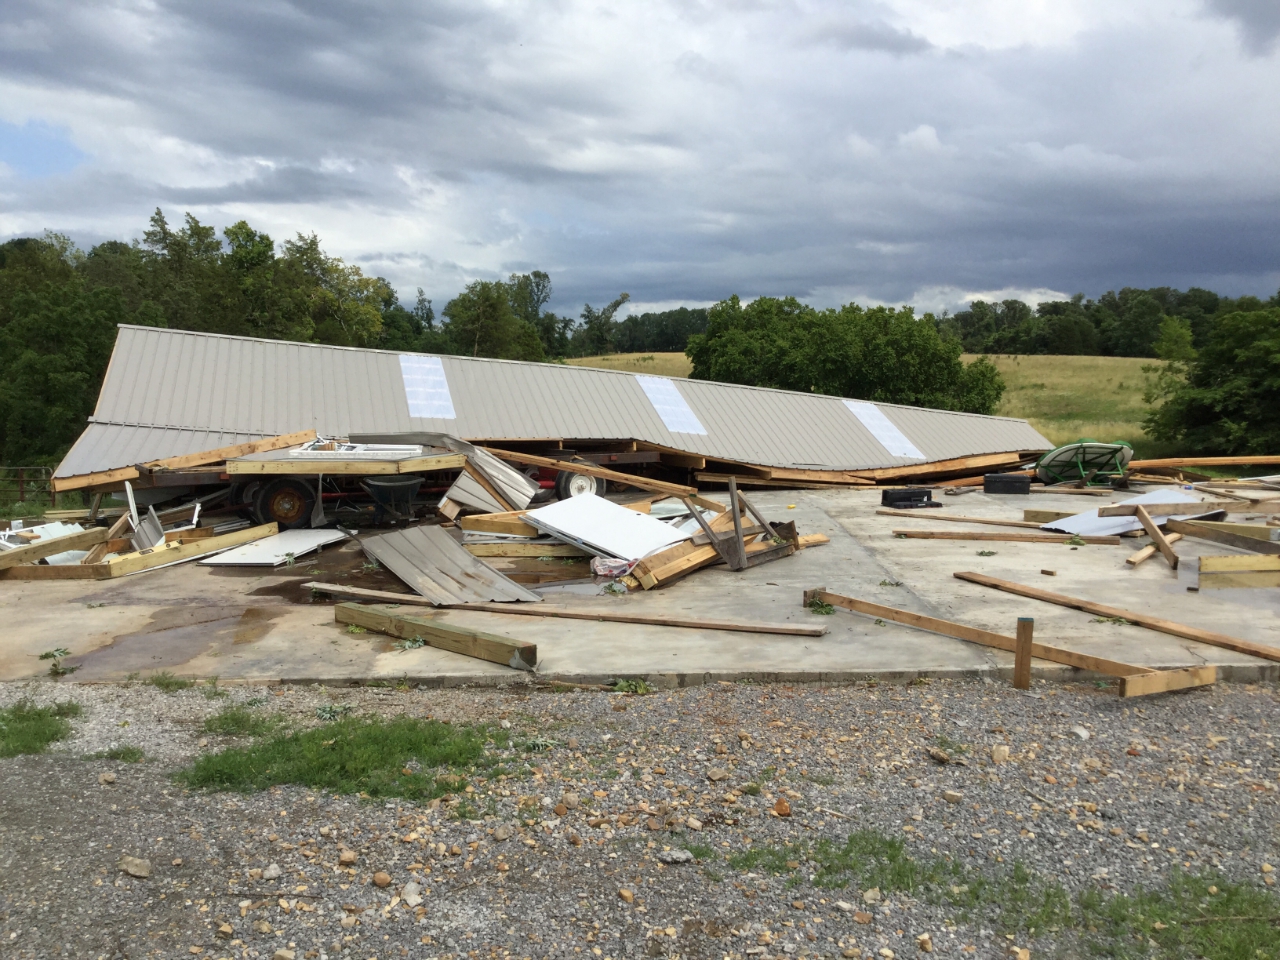
June 21: Two of lines of storms merged across southwest Indiana and west central Kentucky before moving into our region and causing widespread wind damage as well as three EF1 tornadoes near Franklin and Scottsville.
September 10-11: Lexington set new records as the city soared to 100° on the 10th and 95° on the 11th. Louisville also set records of 99° and 97°.
September 24: Severe drought developed in parts of central Kentucky and extreme southern Indiana, including the Louisville metro area, for the first time since December 2016.
September 27 - October 3: Impressive late-season heat wave with many record highs and record warm lows set. Record highs were set at Bowling Green, Lexington, and Louisville four days in a row from September 30 to October 3, with daily highs each day in the upper 90s. Bowling Green attained a new all-time high for the month of October on the 2nd (98°), Lexington did the same on the 1st (97°), and Louisville did it on the 1st then tied it on the 2nd (97°).
October 1: Severe drought reached its peak, covering much of central Kentucky and a sliver of far southern Indiana. September ended up being the hottest and driest on record at Lexington and Louisville. It was the first time in recorded history that Lexington received no measurable rainfall in an entire calendar month.
October 26: The remnants of Tropical Storm Olga flew up the Mississippi Valley. A line of showers ahead of the system was able to tap into very strong winds aloft and bring them down to the surface. Winds of 60-70mph blew down trees and power lines in a narrow corridor from Mississippi to southwest Indiana.
October 29: The five-week long severe drought came to an end.
November 11-13: Early season cold and snow as Canadian high pressure dove into the Ohio Valley behind a departing storm system. On the 11th one to two inches of snow fell on the area. The next day was the coldest November 12th on record at Bowling Green with a low of 16° and high of 28°. Louisville also failed to rise above freezing on the 12th with a record cold high temperature of 31°. On the morning of the 13th Lexington's temperature fell to a record 12° and Louisville tied their record of 16°.
November 30: Low pressure moving slowly from the Ozarks to the southern Appalachians brought soaking rains to southern Indiana and central Kentucky. Daily rainfall records were set at Bowling Green (1.75"), Lexington (2.63"), and Louisville (3.01"). It was the 5th wettest November day on record at Louisville.
December 25: Louisville set a new record high on Christmas Day with a mercury reading of 69°. Lexington also hit 69°, one degree away from the record.
| Bowling Green | Frankfort | Lexington | Louisville Bowman | Louisville Ali | |
| Highest Temperature | 98° Sep 10 and Oct 2 | 98° Sep 10 | 100° Sep 10 | 98° Sep 10 | 99° Sep 10 |
| Lowest Temperature | 11° Jan 30 and Jan 31 | 1° Jan 21 | 2° Jan 31 | 3° Jan 30 | 3° Jan 30 |
| Daily Average Temperature Most Above Normal | +27° Feb 5 (71°/58°) | +25° Jan 7 (66°/47°) and Feb 6 (65°/53°) | +26° Feb 6 (64/57) | +24° Jan 7 (66°/50°) | +22° Jan 7 (65°/48°) |
| Daily Average Temperature Most Below Normal | -22° Mar 4 (28°/18°) | -25° Nov 12 (31°/14°) | -24° Nov 12 (32°/16°) and Nov 13 (35°/12°) | -23° Mar 5 (29°/10°) | -25° Nov 12 (31°/18°) |
| Wettest Day | 2.72" Feb 23 | 2.63" Nov 30 | 2.63" Nov 30 | 2.46" Nov 30 | 3.01" Nov 30 |
| Snowiest Day | 2.2" Jan 19 | 2.1" Jan 12 | 2.1" Jan 12 | ||
| Deepest Snow Cover | 2" Jan 20 | 2" Jan 12, Jan 20, Mar 4, Nov 12 | 3" Jan 12 |
Kentucky Derby weather, May 4: High 75°, low 58°, showers, 0.34" of rain, sloppy track.
(All data here are considered preliminary. For official final data, contact the National Centers for Environmental Information.)
| Bowling Green | ||||||
| Average Temperature | Departure from Normal | Precipitation | Departure from Normal | Snow | Departure from Normal | |
| January | 37.4° | +1.7° | 3.29" | -0.32" | 3.4" | +0.1" |
| February | 45.3° | +5.5° | 11.14" | +7.18" | 0.3" | -3.0" |
| Winter | 41.8° | +3.8° | 19.56" | +7.19" | 4.9" | -2.9" |
| March | 45.7° | -2.7° | 2.52" | -1.89" | T | -1.1" |
| April | 60.1° | +2.4° | 4.87" | +0.53" | 0 | -0.1" |
| May | 71.1° | +4.6° | 3.07" | -2.54" | 0 | 0 |
| Spring | 59.0° | +1.5° | 10.46" | -3.90" | T | -1.3" |
| June | 75.0° | 0 | 8.26" | +4.06" | 0 | 0 |
| July | 79.7° | +1.0° | 3.89" | -0.21" | 0 | 0 |
| August | 79.0° | +1.5° | 5.96" | +2.63" | 0 | 0 |
| Summer | 77.9° | +0.8° | 18.11" | +6.48" | 0 | 0 |
| September | 78.3° | +8.2° | 0.21" | -3.72" | 0 | 0 |
| October | 61.3° | +2.5° | 7.04" | +3.66" | 0 | 0 |
| November | 43.2° | -5.2° | 6.39" | +2.17" | 1.3" | +1.2" |
| Autumn | 60.9° | +1.8° | 13.64" | +2.11" | 1.3" | +1.3" |
| December | 45.3° | +6.7° | 5.46" | +0.66" | T | -1.2" |
| ANNUAL | 60.1° | +2.1° | 62.10" | +12.21" | 5.0" | -4.2" |
4th warmest year on record
7th wettest year on record
| Frankfort | ||||
| Average Temperature | Departure from Normal | Precipitation | Departure from Normal | |
| January | 33.4° | +0.9° | 3.55" | +0.29" |
| February | 42.1° | +5.7° | 7.83" | +4.54" |
| Winter | 38.7° | +4.0° | 16.78" | +6.22" |
| March | 42.4° | -2.5° | 3.75" | -0.63" |
| April | 58.7° | +3.5° | 6.20" | +2.51" |
| May | 68.6° | +4.7° | 5.18" | +0.33" |
| Spring | 56.6° | +1.9° | 15.13" | +2.21" |
| June | 72.7° | +0.1° | 6.59" | +2.50" |
| July | 78.9° | +2.6° | 4.49" | +0.10" |
| August | 76.4° | +1.2° | 2.48" | -0.88" |
| Summer | 76.0° | +1.3° | 13.56" | +1.72" |
| September | 75.3° | +7.7° | 0.08" | -3.25" |
| October | 59.5° | +3.1° | 8.26" | +5.02" |
| November | 40.8° | -5.2° | 5.30" | +1.57" |
| Autumn | 58.5° | +1.8° | 13.64" | +3.34" |
| December | 41.9° | +6.6° | 4.32" | +0.31" |
| ANNUAL | 57.6° | +2.3° | 58.03" | +12.41" |
9th warmest year on record
6th wettest year on record
| Lexington | ||||||
| Average Temperature | Departure from Normal | Precipitation | Departure from Normal | Snow | Departure from Normal | |
| January | 33.8° | +0.9° | 4.35" | +1.15" | 5.4" | +1.5" |
| February | 42.5° | +5.6° | 7.39" | +4.19" | T | -4.6" |
| Winter | 39.1° | +3.9° | 17.80" | +7.47" | 5.5" | -5.5" |
| March | 42.9° | -2.6° | 2.87" | -1.20" | 3.3" | +1.9" |
| April | 59.1° | +3.8° | 4.39" | +0.79" | 0 | -0.3" |
| May | 69.0° | +4.8° | 4.37" | -0.89" | 0 | 0 |
| Spring | 57.0° | +2.0° | 11.63" | -1.30" | 3.3" | +1.6" |
| June | 72.5° | -0.2° | 7.44" | +3.00" | 0 | 0 |
| July | 78.8° | +2.6° | 3.54" | -1.11" | 0 | 0 |
| August | 77.8° | +2.5° | 2.16" | -1.09" | 0 | 0 |
| Summer | 76.4° | +1.7° | 13.14" | +0.80" | 0 | 0 |
| September | 77.5° | +9.4° | T | -2.91" | 0 | 0 |
| October | 61.4° | +4.4° | 7.83" | +4.70" | 0 | 0 |
| November | 42.5° | -3.8° | 5.73" | +2.20" | 1.8" | +1.5" |
| Autumn | 60.5° | +3.3° | 13.56" | +3.99" | 1.8" | +1.5" |
| December | 43.9° | +7.9° | 5.97" | +2.04" | T | -2.5" |
| ANNUAL | 58.5° | +2.9° | 56.04" | +10.87" | 10.5" | -2.5" |
Warmest year on record
| Louisville Bowman | ||||
| Average Temperature | Departure from Normal | Precipitation | Departure from Normal | |
| January | 35.4° | +0.9° | 2.94" | -0.44" |
| February | 41.0° | +2.9° | 8.46" | +5.28" |
| Winter | 39.8° | +3.2° | 16.91" | +6.34" |
| March | 42.7° | -4.3° | 4.26" | +0.10" |
| April | 58.0° | +0.9° | 7.75" | +3.67" |
| May | 69.1° | +2.7° | 4.93" | -0.19" |
| Spring | 56.6° | -0.2° | 16.94" | +3.58" |
| June | 73.7° | -1.4° | 8.82" | +4.68" |
| July | 80.0° | +2.2° | 2.81" | -1.36" |
| August | 78.0° | +0.5° | 2.82" | -0.49" |
| Summer | 77.2° | +0.4° | 14.45" | +2.83" |
| September | 77.2° | +7.6° | 0.21" | -2.95" |
| October | 60.4° | +2.2° | 5.48" | +2.26" |
| November | 42.0° | -5.5° | 5.16" | +1.55" |
| Autumn | 59.9° | +1.5° | 10.85" | +0.86" |
| December | 43.3° | +6.1° | 3.59" | -0.42" |
| ANNUAL | 58.4° | +1.2° | 57.23" | +11.69" |
| Louisville Muhammad Ali | ||||||
| Average Temperature | Departure from Normal | Precipitation | Departure from Normal | Snow | Departure from Normal | |
| January | 35.2° | +0.3° | 3.22" | -0.02" | 7.5" | +3.8" |
| February | 42.9° | +4.1° | 8.38" | +5.20" | 0.6" | -3.9" |
| Winter | 40.4° | +3.2° | 17.50" | +7.25" | 8.1" | -2.7" |
| March | 45.2° | -2.6° | 3.74" | -0.43" | 2.6" | +1.2" |
| April | 61.2° | +3.2° | 6.62" | +2.61" | 0 | -0.1" |
| May | 70.9° | +3.8° | 4.61" | -0.66 | 0 | 0 |
| Spring | 59.1° | +1.5° | 14.97" | +1.52" | 2.6" | +1.1" |
| June | 75.5° | -0.1° | 7.82" | +4.03" | 0 | 0 |
| July | 81.6° | +2.3° | 1.31" | -2.92" | 0 | 0 |
| August | 79.8° | +1.4° | 2.68" | -0.65" | 0 | 0 |
| Summer | 79.0° | +1.2° | 11.81" | +0.46" | 0 | 0 |
| September | 79.7° | +8.7° | 0.04" | -3.01" | 0 | 0 |
| October | 62.0° | +2.5° | 5.62" | +2.40" | T | -0.1" |
| November | 43.0° | -5.7° | 5.64" | +2.05" | 1.0" | +0.9" |
| Autumn | 61.6° | +1.9° | 11.30" | +1.44" | 1.0" | +0.8" |
| December | 44.1° | +6.2° | 3.63" | -0.20" | 0.3" | -2.3" |
| ANNUAL | 60.1° | +1.9° | 53.31" | +8.40" | 12.0" | -0.5" |
4th warmest year on record
 |
 |
 |
 |
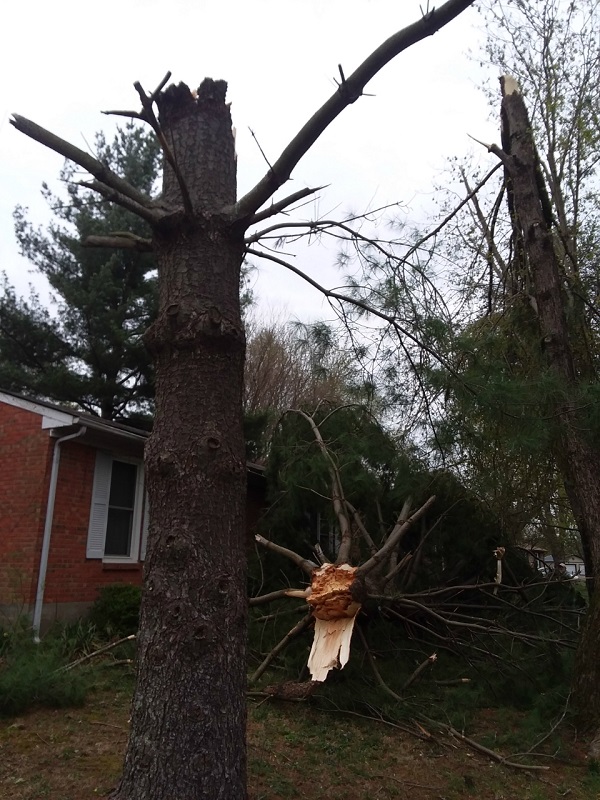 |
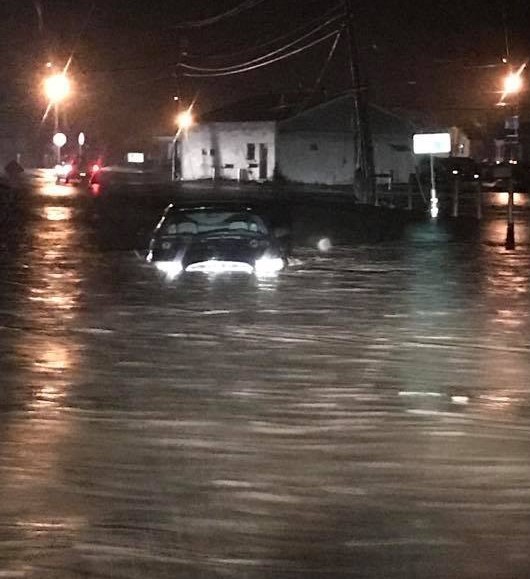
| Snow in Louisville January 19. TRIMARC | Flooding in West Point, KY on February 14. NWS | Flooding in Casey County on February 23. Crystal Sallee | Tree blown onto a car by non-thunderstorm winds in Louisville March 14. Micheal Whitehead | Pine tree snapped by a small tornado near La Grange on April 12. NWS |
 |
 |
|||
| Frost in Shepherdsville on October 13. Tyler Voelker | Barn damage from an EF1 tornado west of Scottsville, KY on June 21. NWS |


 Weather Story
 Weather Map
 Local Radar