|
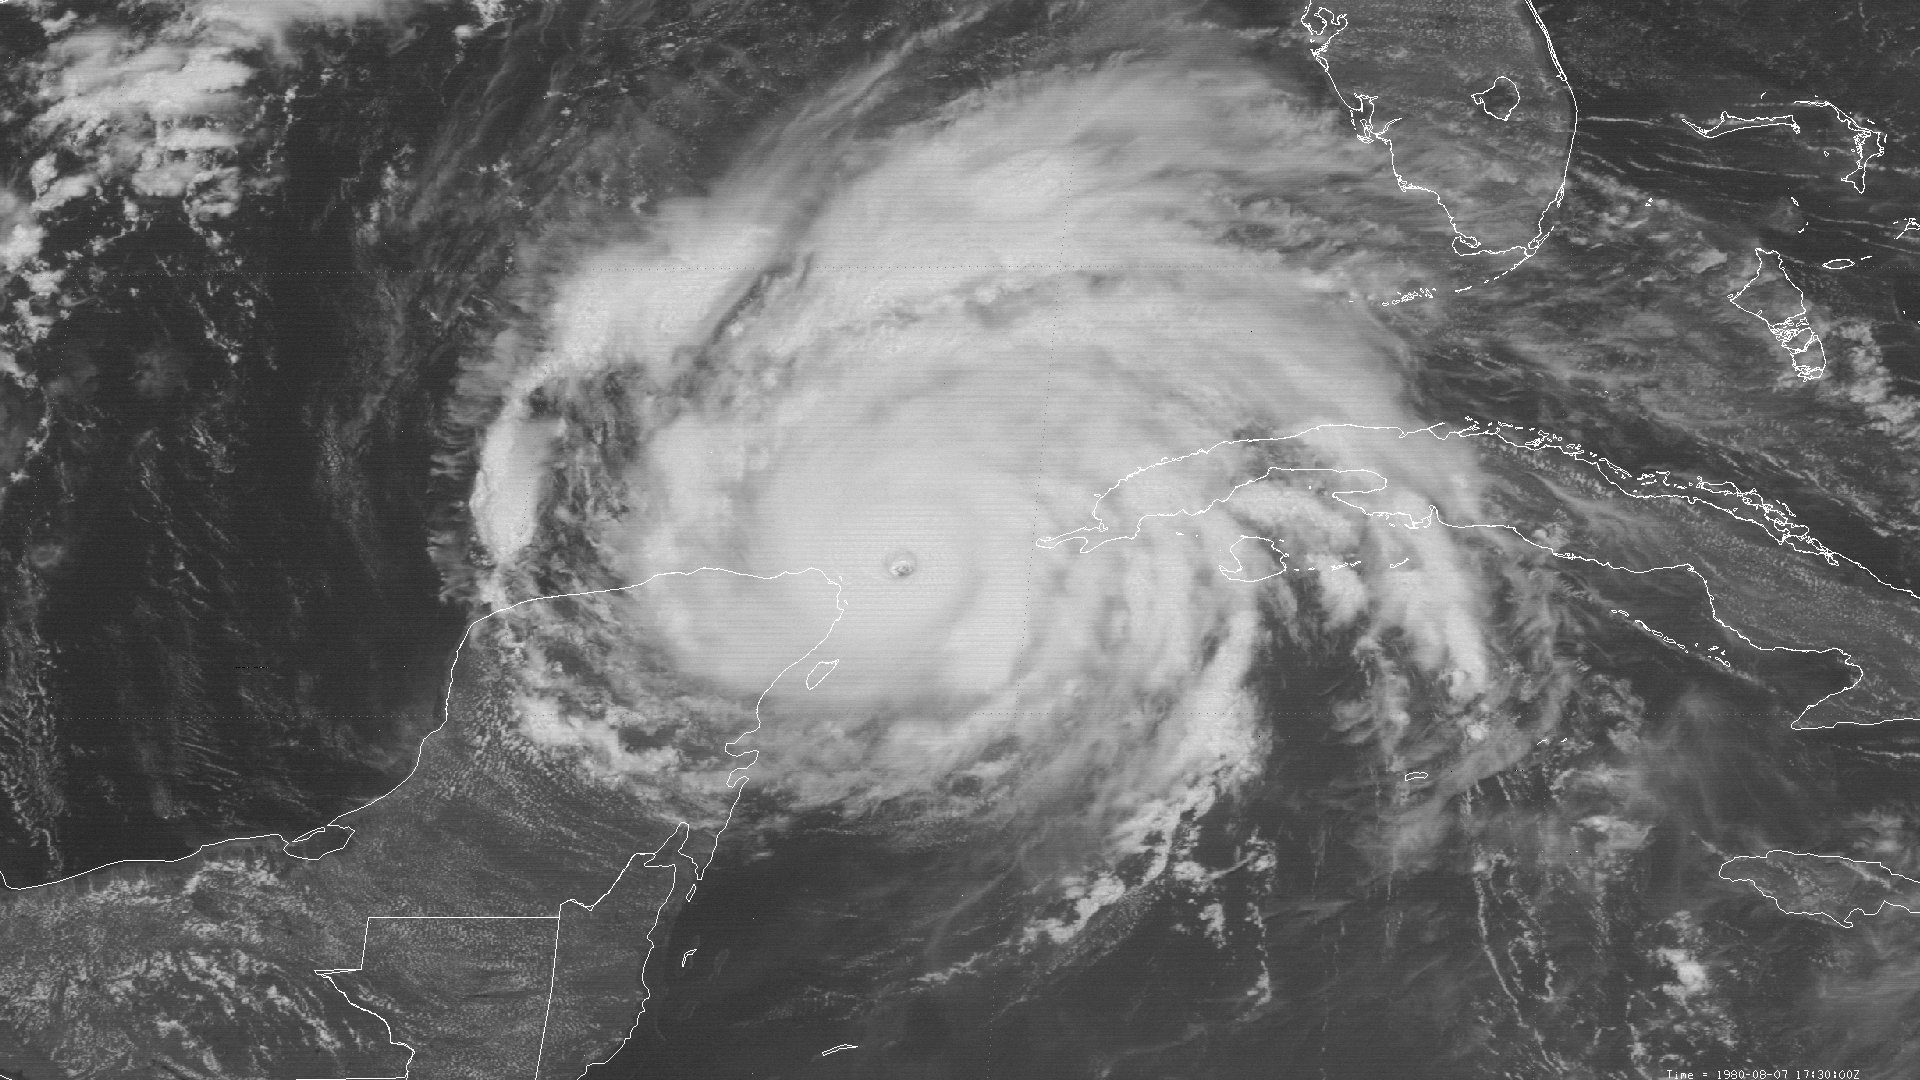
Above: SMS-2 visible satellite image of Hurricane Allen at 12:30 PM CDT August 7, 1980 at peak intensity of 190 mph (165 knots) and minimum central pressure of 899 millibars (26.55 inches).
Hurricane Allen originated from a tropical wave that emerged from the African Coast on July 30th. The wave quickly developed into Tropical Depression #2 late on July 31st. A strong upper level high pressure ridge over the Eastern Atlantic provided favorable conditions and steered the system to the west around 20 knots. Despite the quick westerly movement that usually restricts development, the depression quickly strengthened to Tropical Storm Allen late on August 1st, and hurricane strength late on August 2nd.
Allen continued to quickly intensify as it headed westward toward the Eastern Caribbean Sea. By the time the first reconnaissance aircraft was able to reach the center of Allen during the afternoon of August 3rd, it had already reached category 2 hurricane intensity. Allen strengthened to a major hurricane before the eye passed across the northern coast of Barbados around 0130z August 4th with sustained winds of 125 mph (110 knots), and just south of Saint Lucia around 0600z August 4th with maximum sustained winds of 130 mph (115 knots).
As the mid to upper level ridge of high pressure over and to the north of Allen moved westward, Allen continued to rapidly intensify across the Eastern Caribbean Sea and grow larger in size. At 8:00 PM AST August 4th, reconnaissance aircraft found Allen had reached category 5 strength and recorded a minimum central pressure of 911 millibars (26.90 inches). The 911 millibars was the lowest recorded pressure across the Eastern Caribbean Sea. Maximum sustained winds of 180 mph (155 knots) were recorded later that evening into the early morning hours of August 5th while Allen was passing south of the Dominican Republic. Reconnaissance aircraft measured the width of hurricane force winds around 80 nautical miles (92 miles) and width of tropical storm force winds around 275 nautical miles (316 miles).
From the late morning hours of August 5th through the early morning hours of August 6th, Allen began to weaken as it took a jog to the northwest and passed just south of the western tip of Haiti. The weakening was likely due to the combination of an eyewall replacement cycle and disruption of the overall circulation from the mountains of Haiti and the Dominican Republic. Further weakening occurred as Allen passed between Cuba and Jamaica, although Allen remained a major hurricane during this time.
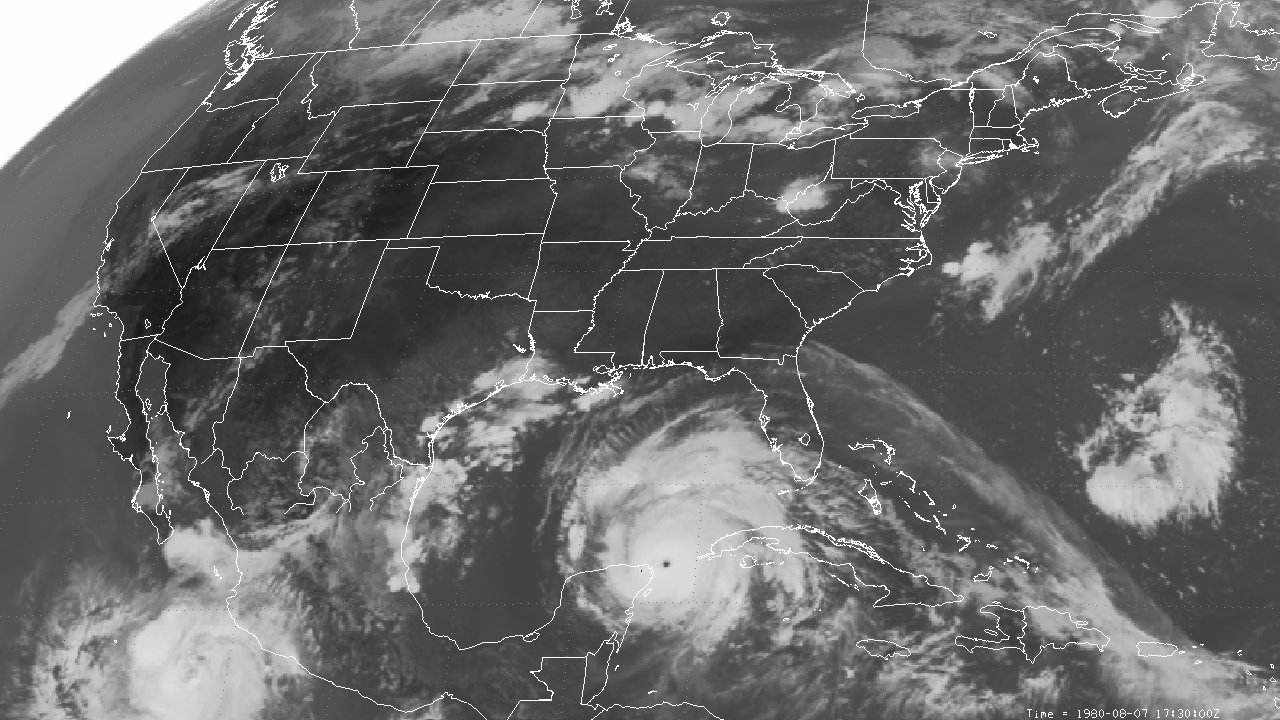
The mid to upper level ridge of high pressure remained strong from the Central United States eastward across the Western Atlantic, keeping Allen on a west to west northwest track as it passed south of Cuba during the afternoon and evening hours of August 6th through August 7th. With the continued favorable mid to upper level ridge, moist atmosphere, and very warm waters of the Northwest Caribbean Sea, the second round of rapid intensification began. Allen reached category 5 status again by 1 AM CDT August 7th and remained at category 5 for the next 24 hours. At 12:42 PM CDT (1742z) August 7th, a NOAA P-3 reconnaissance aircraft measured a record setting 899 millibars (26.55 inches) and maximum sustained winds of 190 mph (165 knots) while Allen was moving across the Yucatán channel entering the Gulf. At the time, this was the lowest sea level pressure measured by reconnaissance aircraft, and 2nd lowest pressure every recorded in the Atlantic basin. The SMS-2 visible and infrared satellite image at 12:30 PM CDT, along with the NOAA P-3 aircraft lower fuselage radar and tail radar scans at 12:47 PM CDT August 7, 1980 shows Hurricane Allen at maximum intensity. Reconnaissance aircraft measured the width of hurricane force winds around 125 nautical miles (144 miles) and width of tropical storm force winds around 300 nautical miles (345 miles), making Allen a very large and powerful hurricane.
While passing just to the north of the Yucatán Peninsula, Allen’s moist inflow to the south was replaced by drier air from the Peninsula, and the hurricane weakened to 130 mph (115 knots) and minimum central pressure of 960 millibars by daybreak on August 8th. The strong mid to upper level ridge over the Central United States continued to steer Allen on a west-northwest track over the Western Gulf, and a third rapid intensification period commenced later that morning though early August 9th, reaching category 5 for the third time. Hurricane Allen’s large cloud circulation covered the Central and Western Gulf. By 1 AM CDT August 9th, reconnaissance aircraft measured a minimum sea level pressure of 909 millibars (26.84 inches) and maximum sustained winds of 180 mph (155 knots). The 909 millibars remains the lowest sea level pressure recorded across the Western Gulf.
After daybreak on August 9th, a weakening in the mid to upper level ridge over the Central United States allowed Hurricane Allen to slow down, but still headed west northwest toward the lower Texas/Upper Mexican coast. Fortunately, Allen began to weaken as the forward speed slowed to 5-10 knots during the afternoon and evening hours before landfall. Hurricane Allen made landfall around 12:30 AM CDT August 10th just northeast of Brownsville, TX on the south end of Padre Island with maximum sustained winds of 115 mph (100 knots) and a minimum central pressure of 945 millibars (27.91 inches).
Allen continued to slowly weaken over South Texas for the remainder August 10th, and was downgraded to a tropical storm just west of Laredo, Texas when Allen moved across Northern Mexico. Allen was downgraded to a depression by daybreak August 11th with the surface circulation dissipating later that afternoon. Click here for an interactive track of Hurricane Allen.
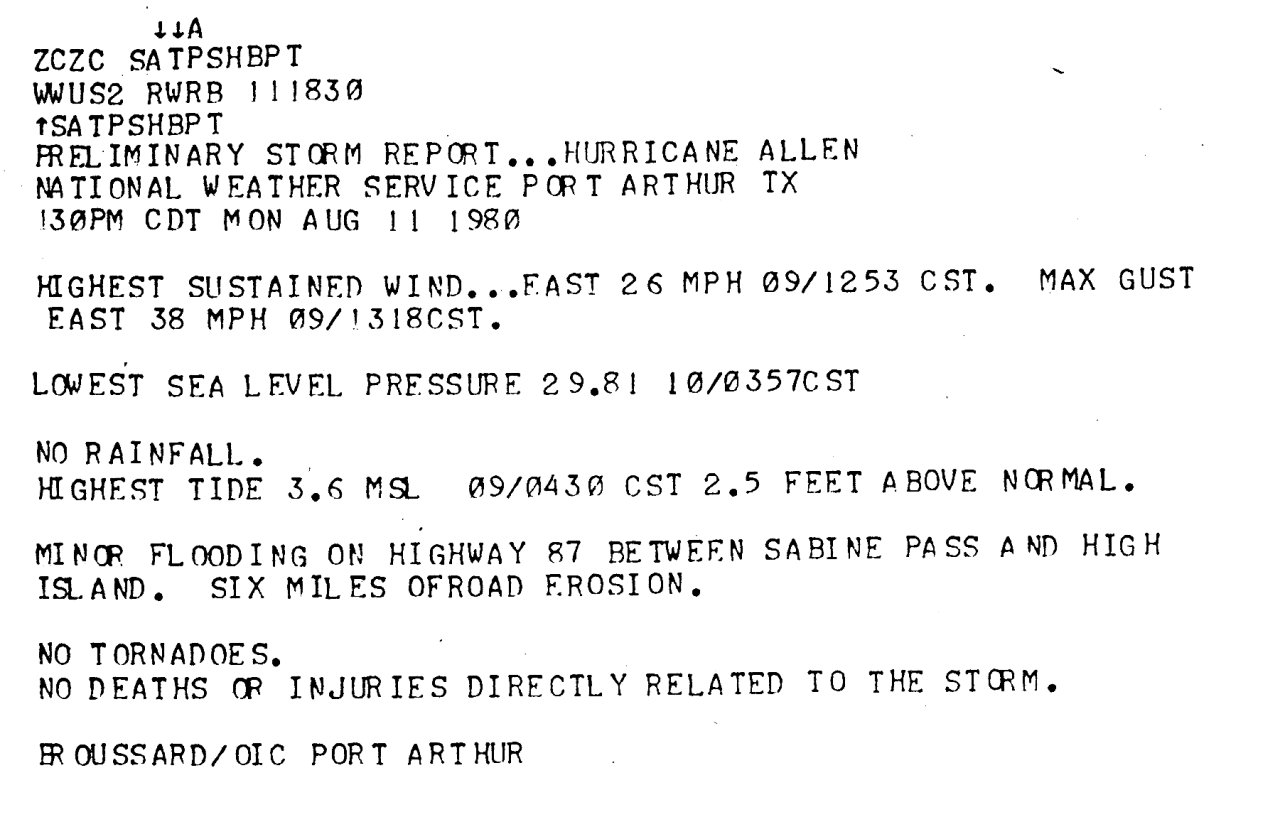
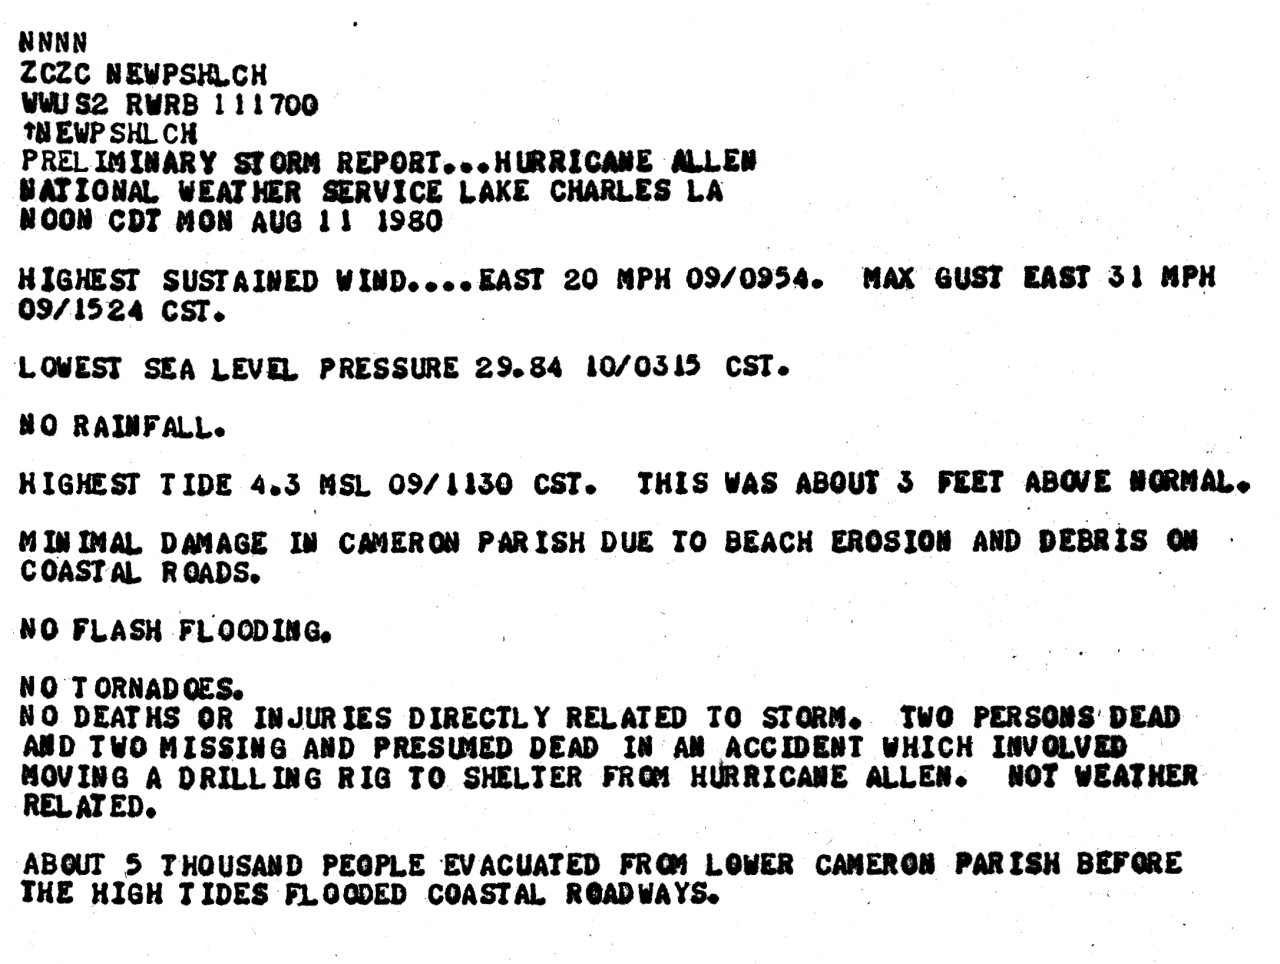
Allen’s large circulation caused storm surge and erosion across the Texas and Southwest Louisiana coasts, with the highest surge across the Central and South Texas coasts. Closer to our region, six miles along Highway 87 between Sabine Pass and High Island, Texas was damaged due to surge and wave action. Minor beach erosion with debris along Highway 82 in Cameron parish was also noted. Most of the damage that occurred was to oil drilling platforms, with two $30 million-dollar platforms destroyed.
Allen caused two direct deaths due to drownings in the Corpus Christi, Texas area. However, many indirect deaths occurred before and during Allen. Seventeen indirect deaths occurred off the Louisiana coast. Four of these deaths occurred during a collapse of a drilling rig while moving it to shelter, and the other 13 occurred in an oil company evacuation helicopter which crashed while taking workmen from the Louisiana offshore oil rigs. Three fishermen were swept off the jetties by large swells in Galveston, Texas. Several other deaths occurred due to automobile accidents during the evacuation, and victims of heart attacks.
WIND & PRESSURE:
The National Weather Service Port Arthur, Texas recorded a peak wind gust of 38 mph (33 knots), around 2:18 PM CDT August 9th with one of the rain bands to reach the region. Otherwise, no tropical storm force winds were measured across Southern Louisiana or Southeast Texas east of Galveston. The highest winds occurred across the Middle and South Texas Coast with a peak gust of 120 mph (104 knots) measured at Port Mansfield, Texas. For complete meteorological statistics, see the Wind and Pressure section.
STORM SURGE:
Due to the large circulation of Allen across the Gulf, maximum tide levels of 3 to 5 feet MSL occurred across Southeast Texas and Southwest Louisiana, with a reading of 4.3 feet MSL at Cameron, Louisiana. Tides of 7 to 12 MSL occurred across the Middle and South Texas Coast, with the highest tide of 12 feet MSL recorded at Port Mansfield, Texas. For other storm surge and high-water marks, see the Storm Surge section.
RAINFALL:
Rainfall up to 2 inches occurred across the area as the northern rain bands of Allen propagated northward, with many locations receiving less than one inch or no rainfall at all. The highest rainfall amounts of 10 to 20 inches occurred across South Texas with the highest total of 20.20 inches being recorded at Kingsville, Texas. While this produced localized flooding, most of the rainfall was beneficial in providing relief from the drought and Heat Wave of 1980 across the region. For complete rainfall totals reported across our region, see the Rainfall section.
TORNADOES:
Hurricane Allen produced the largest tornado outbreak associated with a tropical cyclone across Texas since Hurricane Beulah in 1967 and Carla in 1961. Most of the tornadoes were F0-F1 with a few rated F2, causing 30 injuries and fortunately no deaths. Property damage over 337 million (1980 dollars) resulted from these tornadoes. The F2 tornado that struck Austin, Texas at 2:40 PM CDT August 10th resulted in 250 million in damages and was the costliest tropical cyclone tornado to date. For complete details on all the tornadoes reported across Texas, see the Tornadoes section.
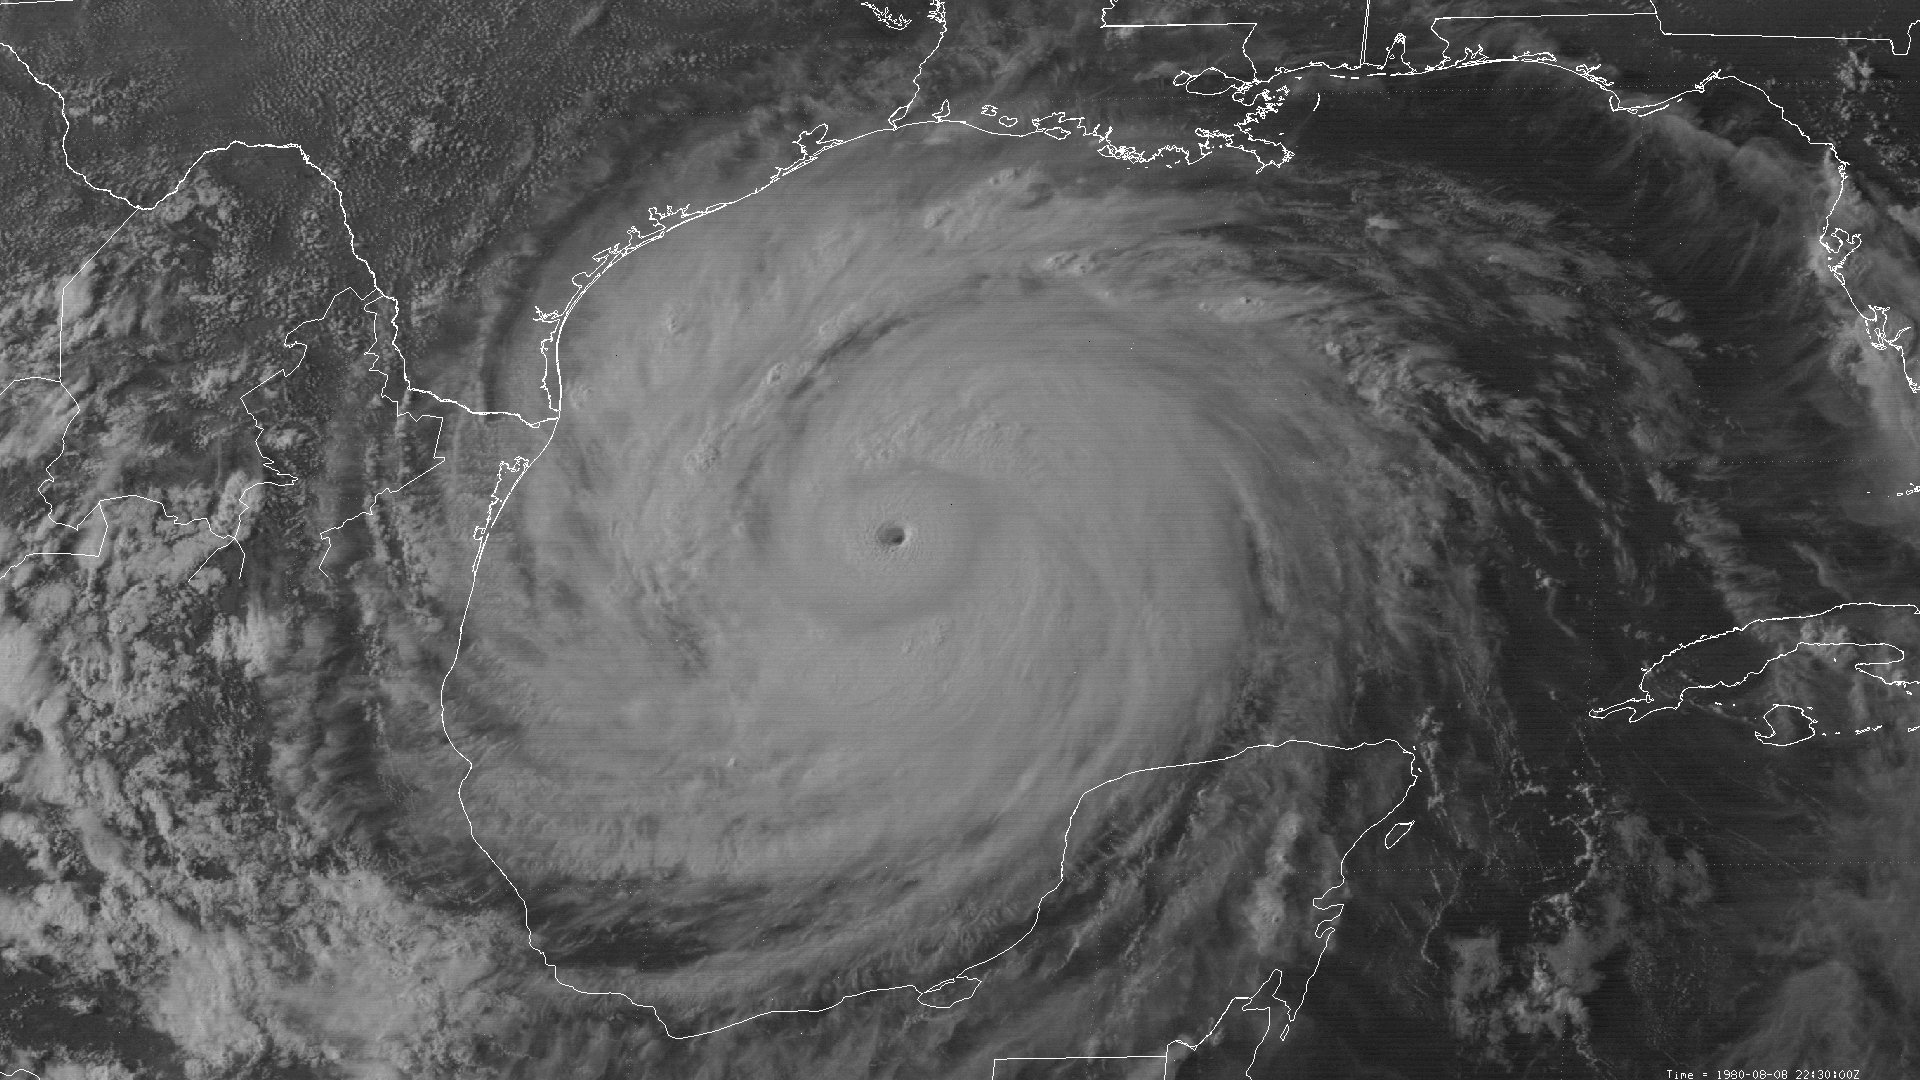
Above: SMS-2 visible satellite image of Hurricane Allen at 5:30 PM CDT August 8, 1980, nearing its third category 5 maximum intensity across the Western Gulf.
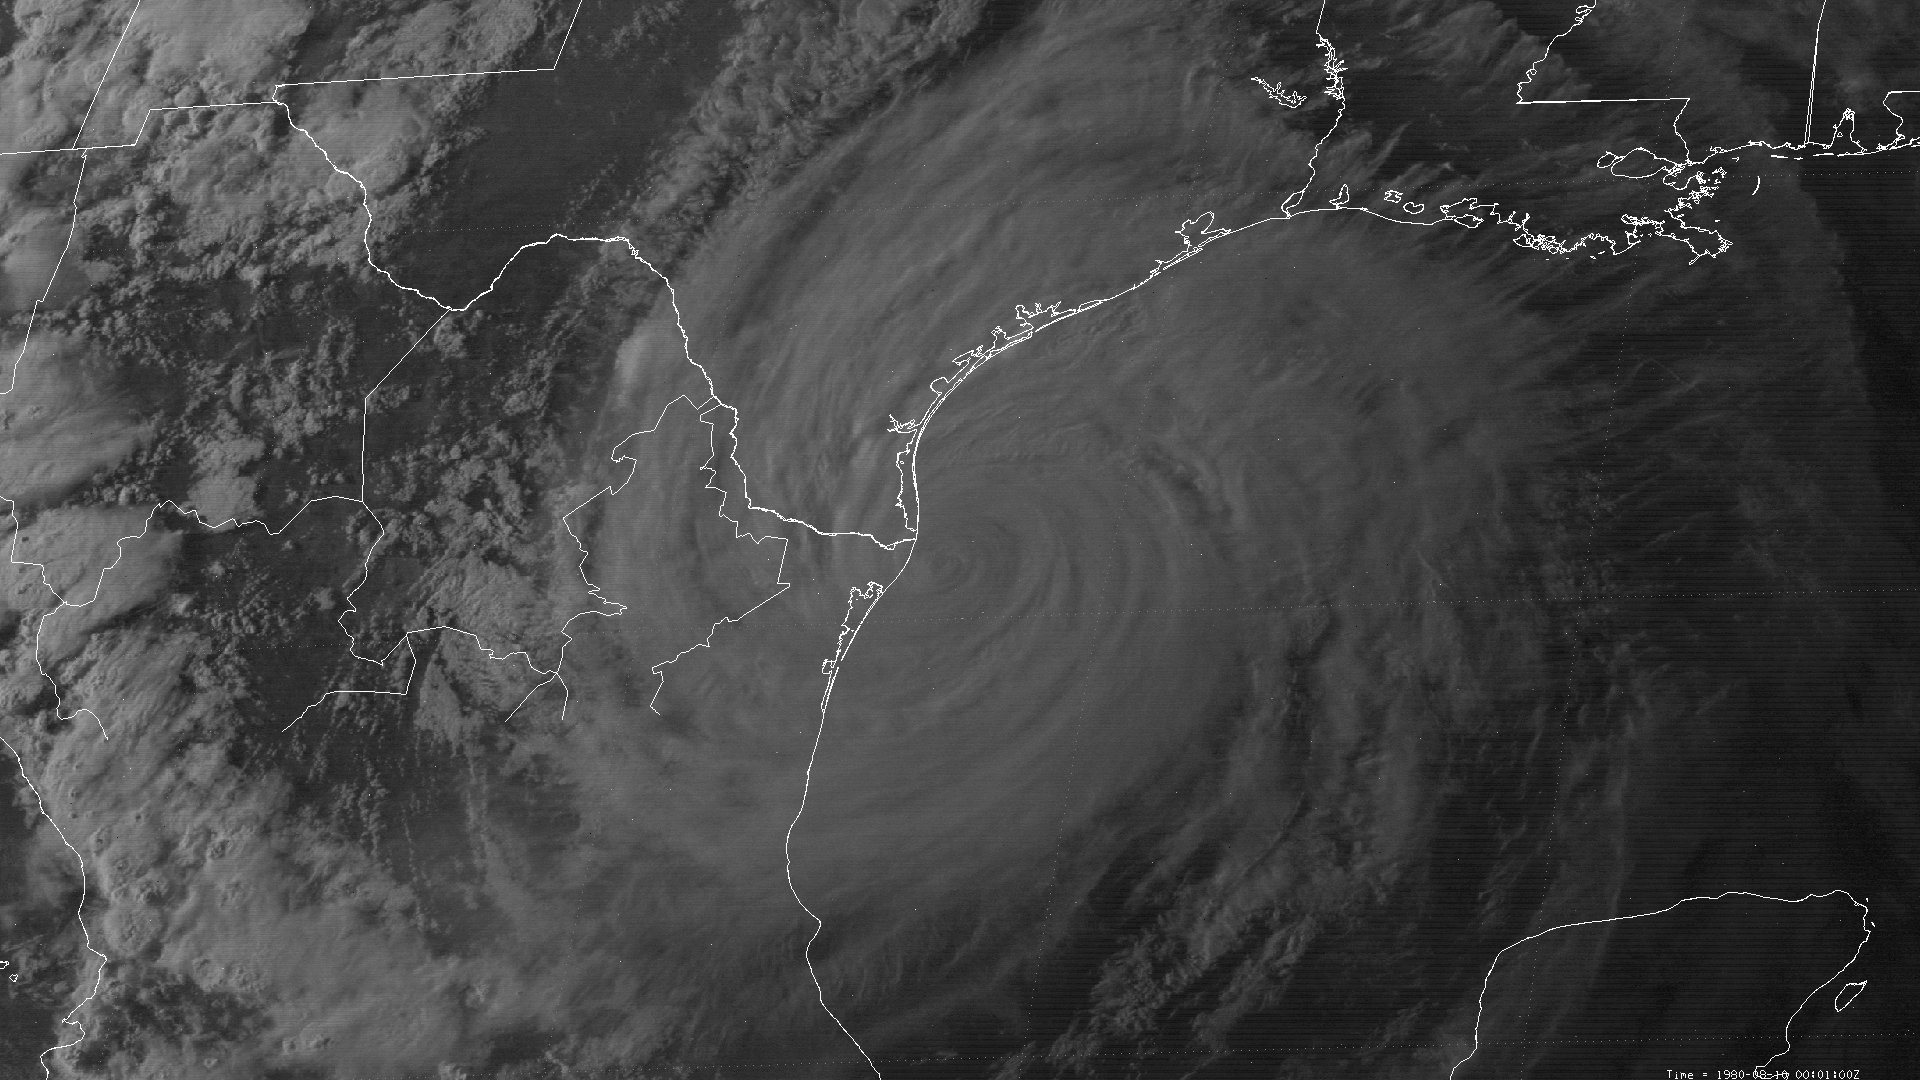
Above: SMS-2 visible satellite image of Hurricane Allen at 7:01 PM CDT August 9, 1980, nearing landfall across South Texas.

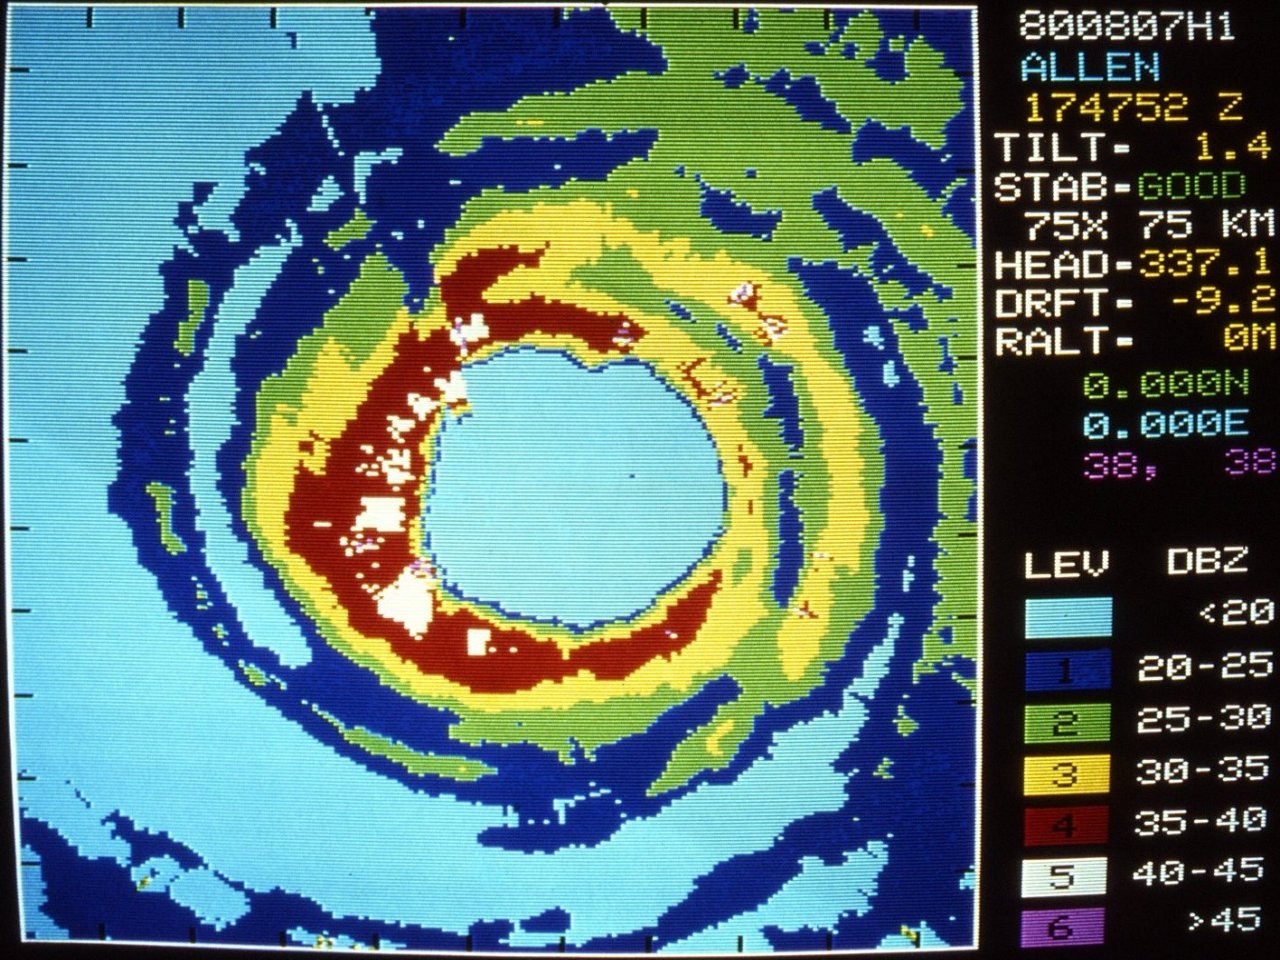
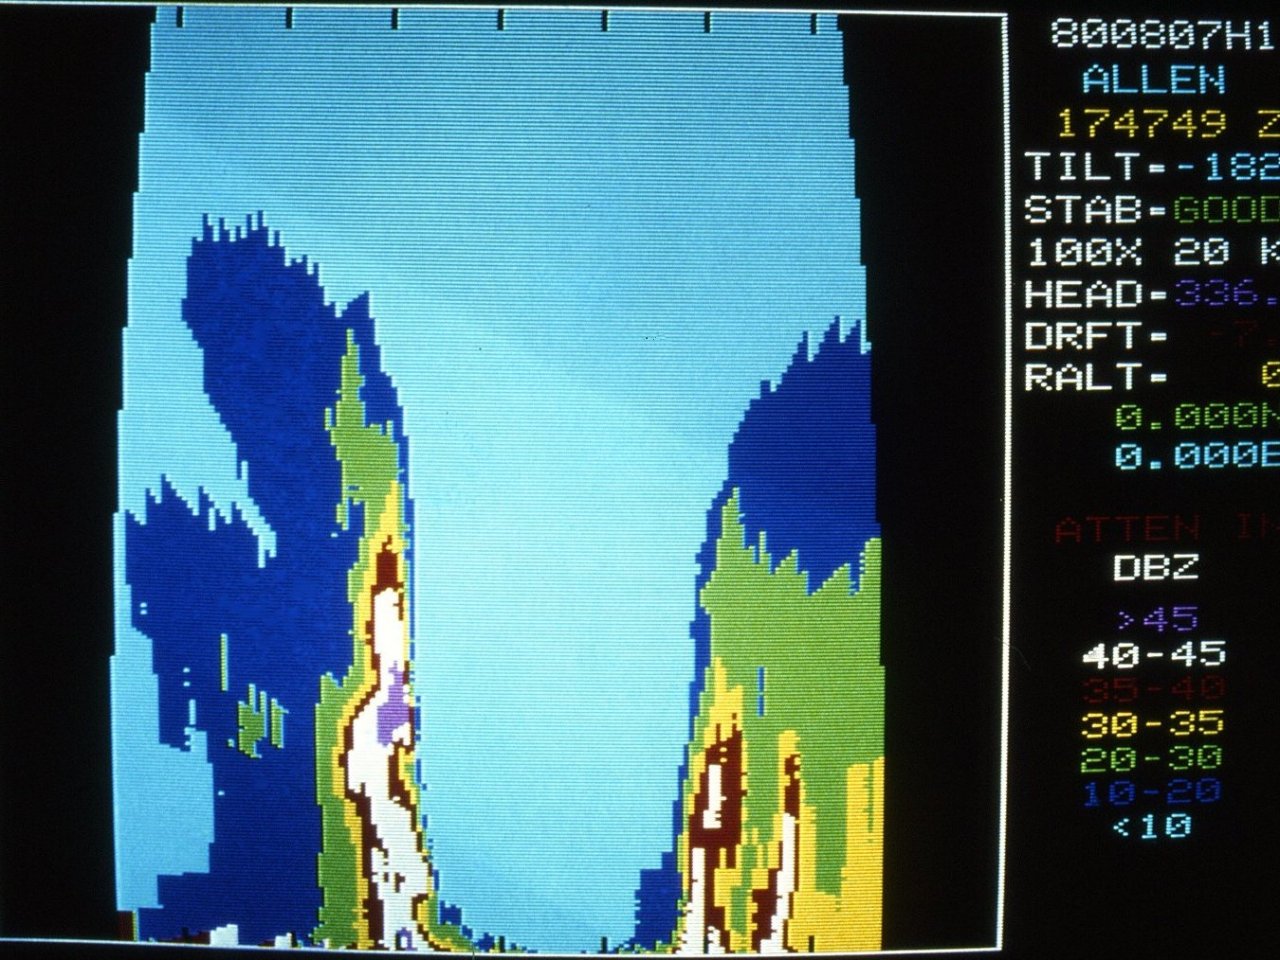
Above: NWS Brownsville, TX WSR-57 radar photograph of Hurricane Allen east of Brownsville, TX at 7:00 PM CDT August 9, 1980.
|


