 |
||||
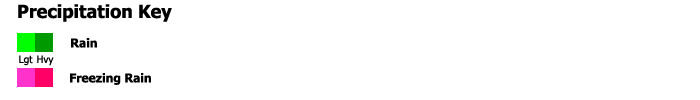
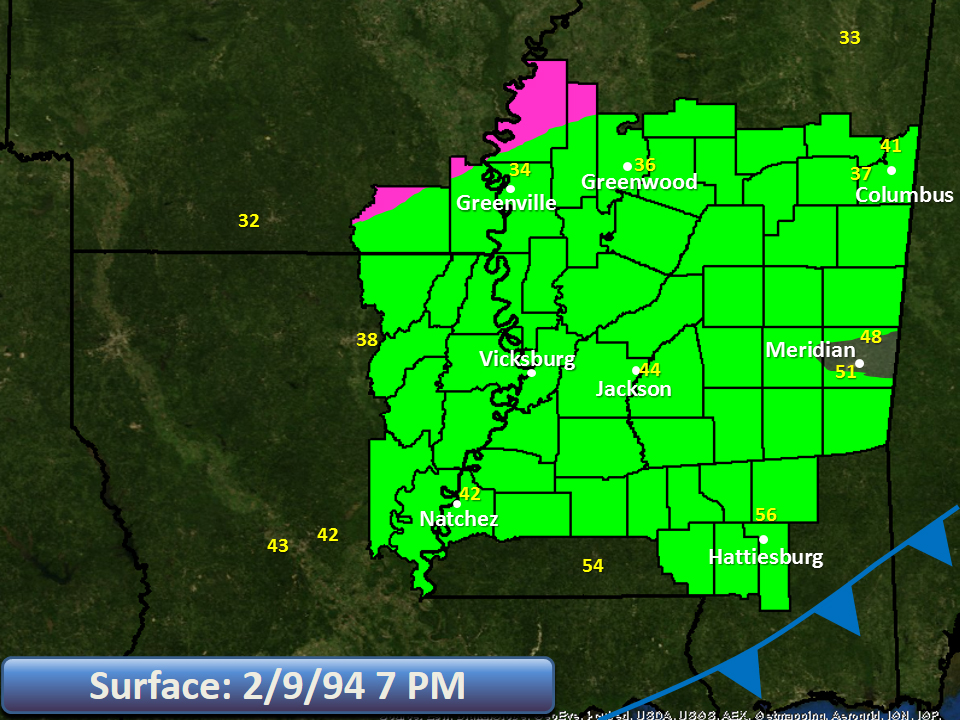
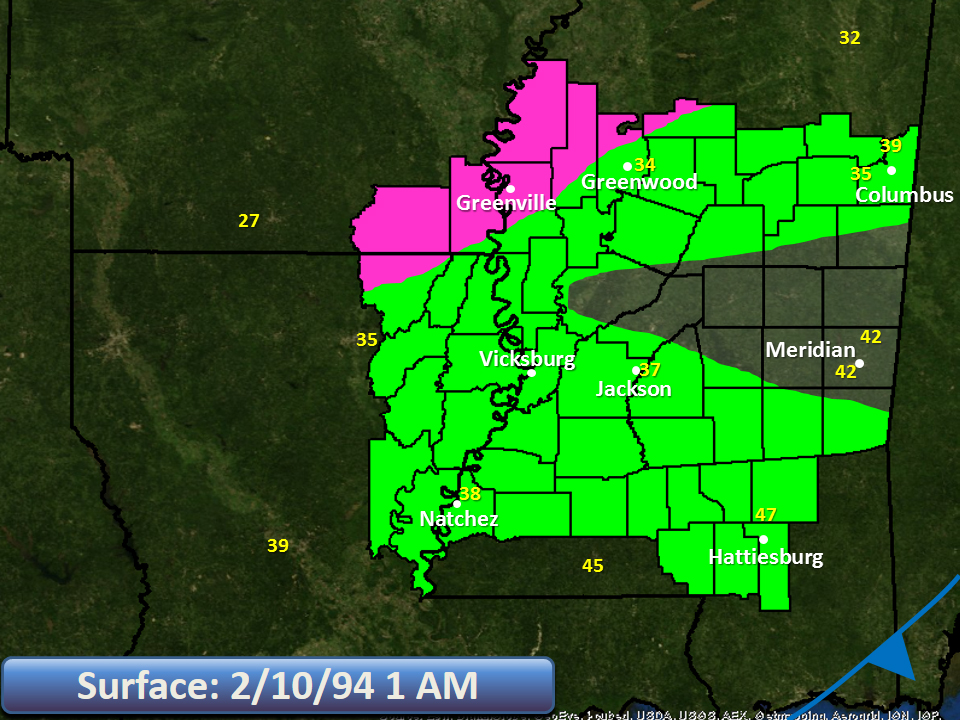
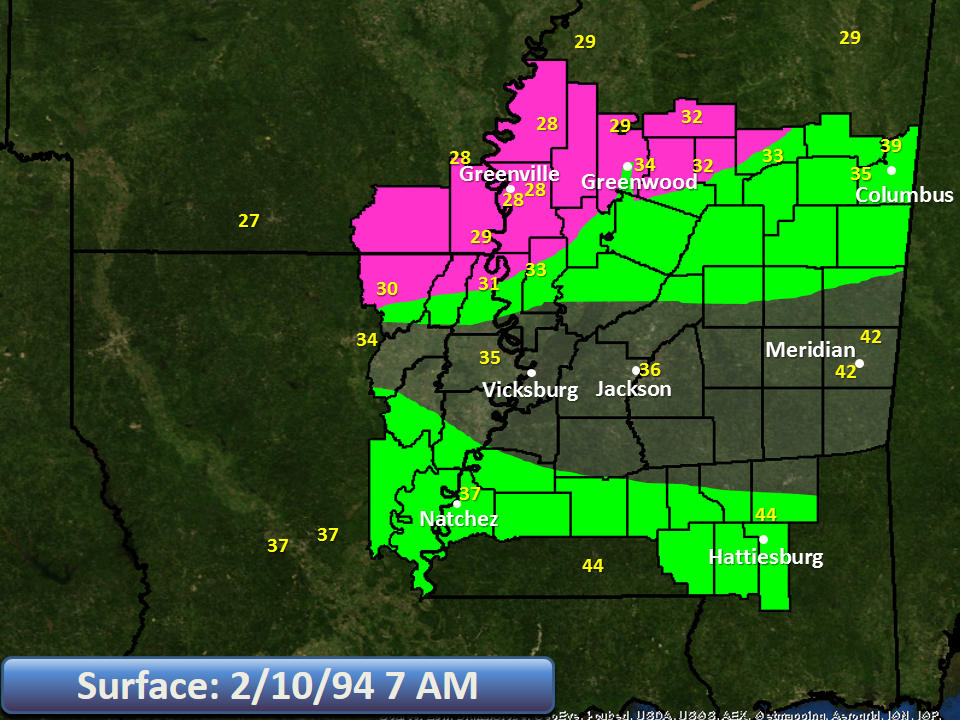
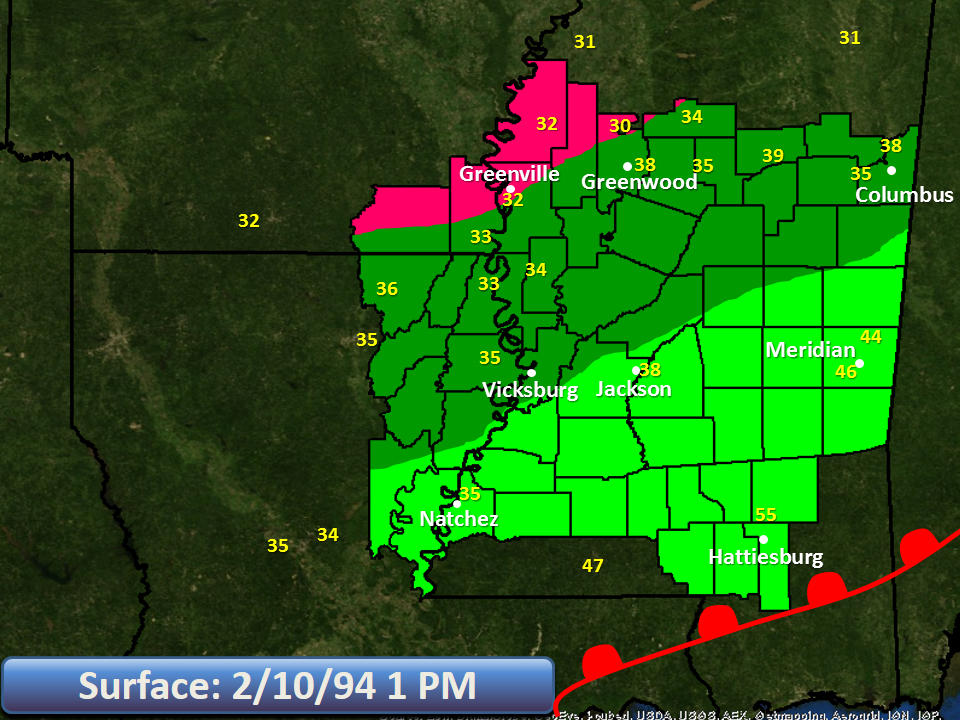
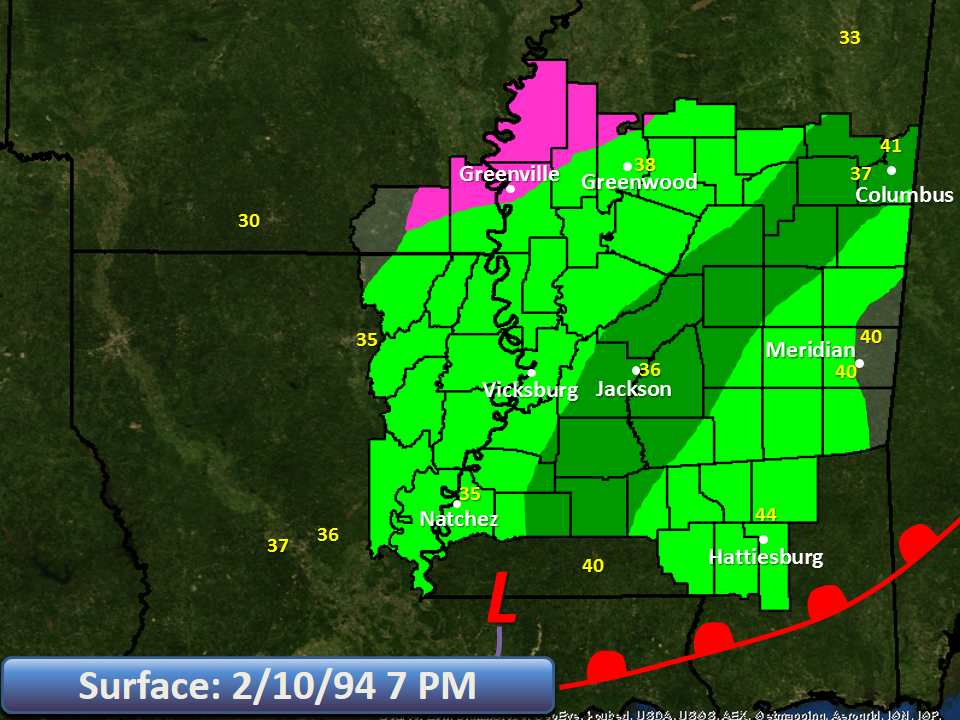
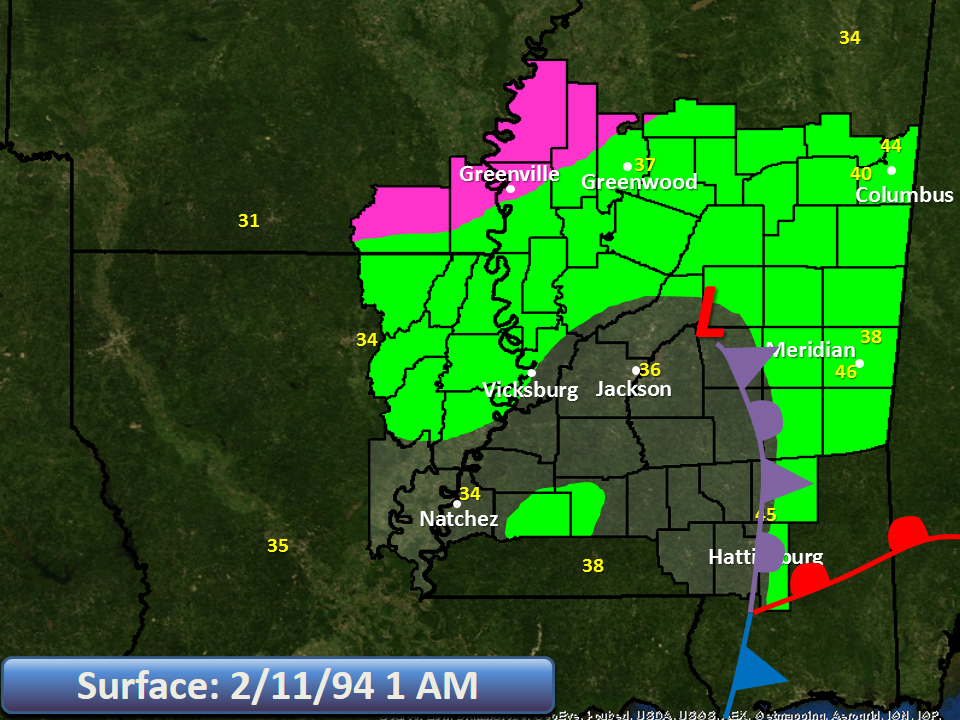
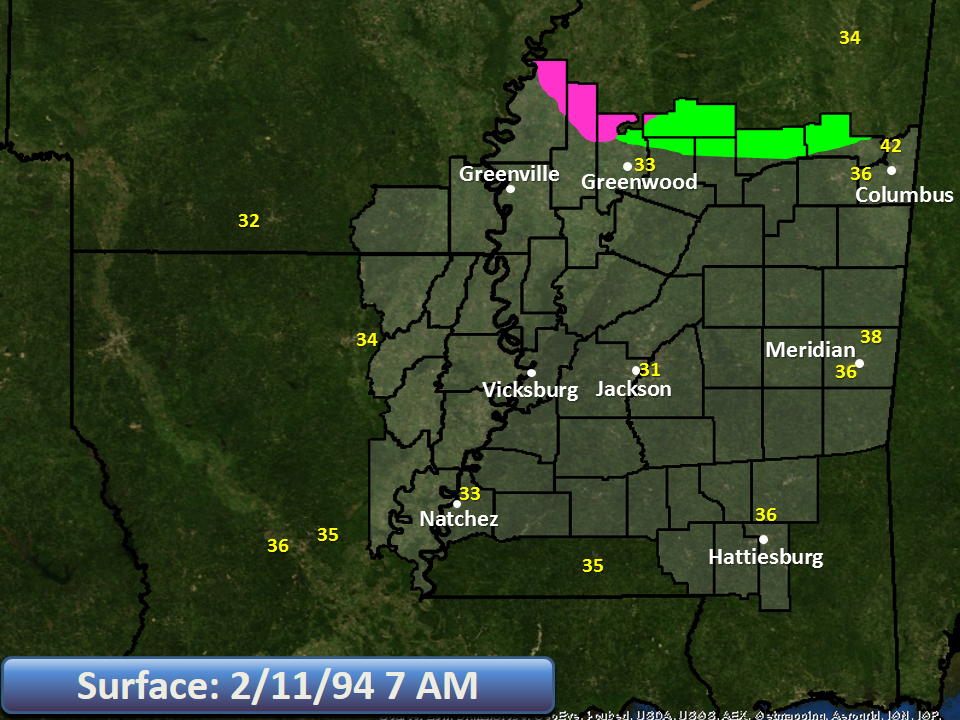
Temperature/Precipitation Type Maps
The maps below show the evolution of surface weather features, temperatures, and precipitation types throughout the duration of the weather system.
Observations
This is a table showing hourly temperatures and observed weather and local observation sites. Click on the chart to enlarge.

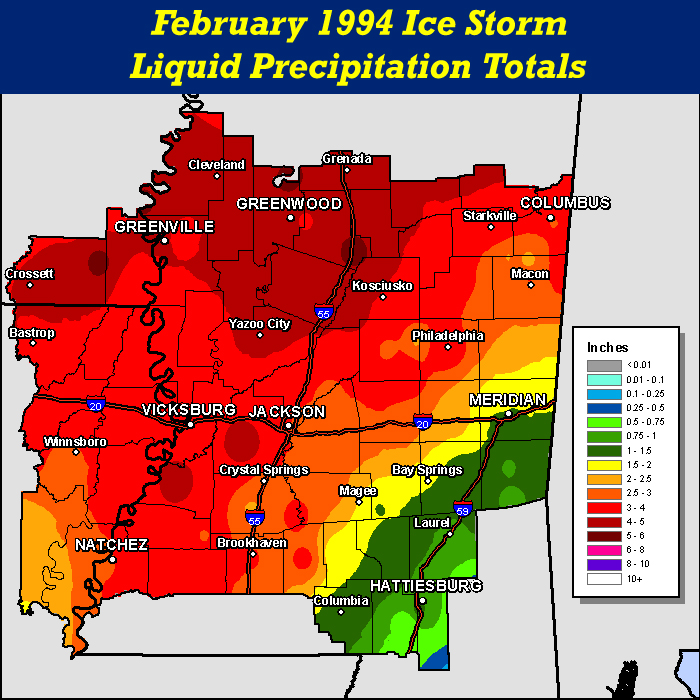
Storm Total Precipitation
This map shows observed precipitation totals from across the NWS Jackson forecast area. Please note that this includes totals from both rain and frozen precipitation. Even in the hardest hit areas, there was a 6-10 hour period of rain before wintry precipitation began.
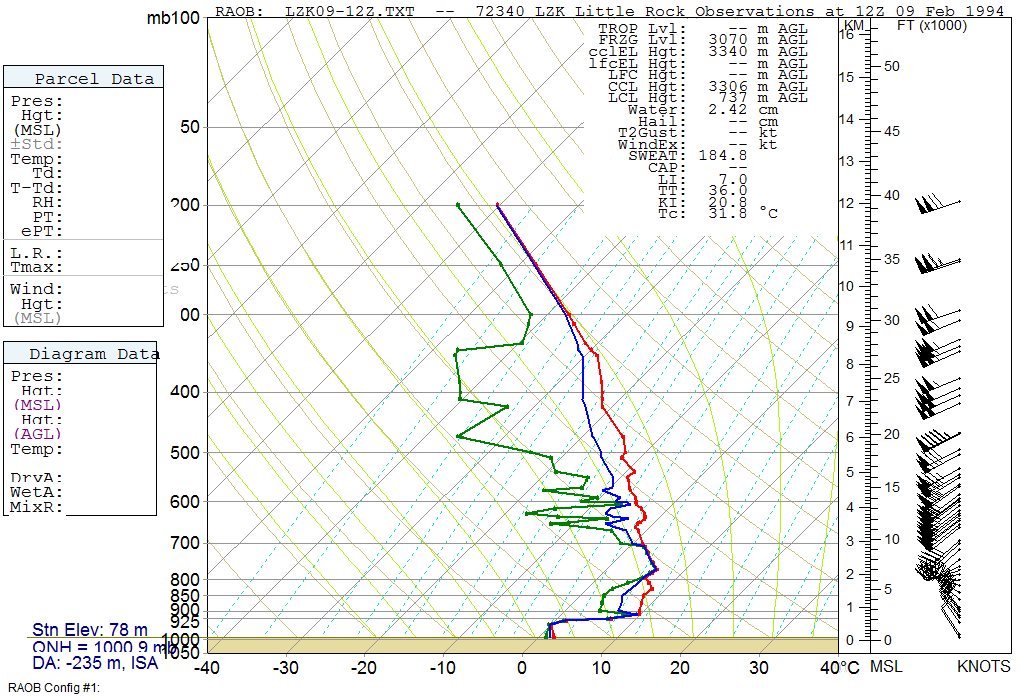
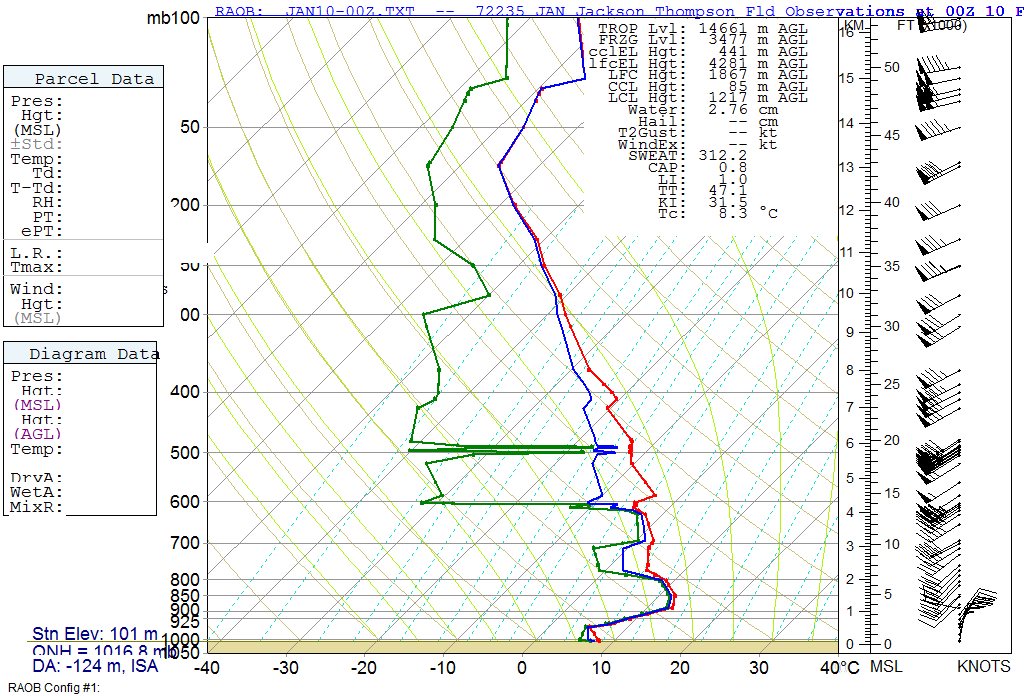
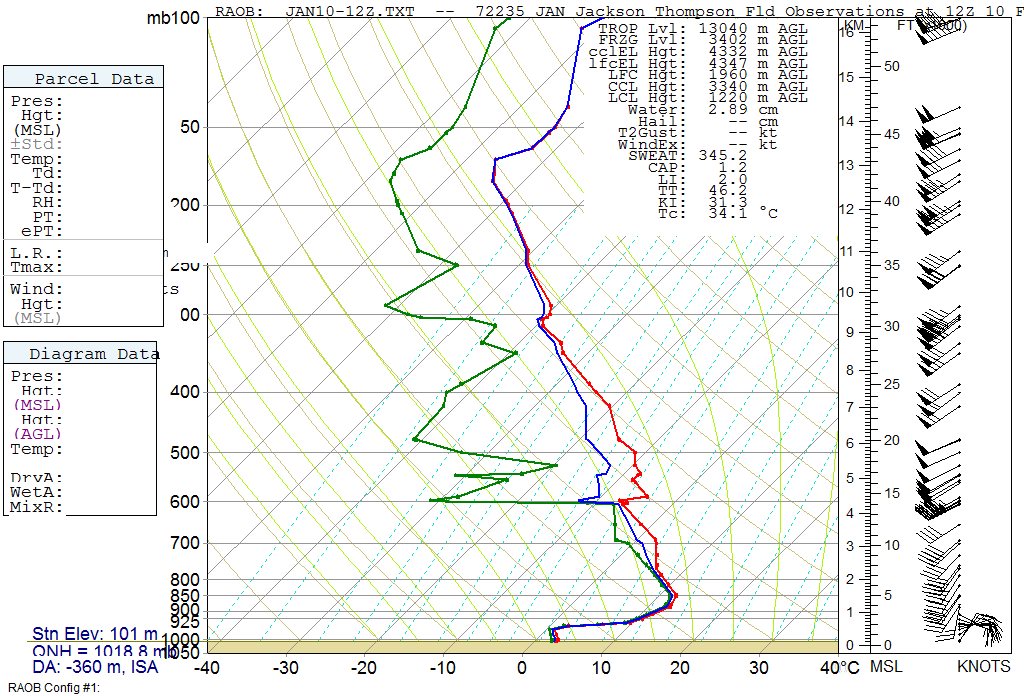
Upper Air Soundings
These are observed soundings from Jackson and Little Rock throughout the storm. Click on the thumbnails below for a full resolution image. As the cold front pushed across the region, a shallow layer of sub-freezing air moved into the Delta. However, there was a pronounced layer of warmer air just above this freezing layer (especially apparently on the February 10th 12z JAN sounding), which set the stage for a freezing rain event.
 |
 |
 |
 |
 |
 |
 |
 |
 |
 |
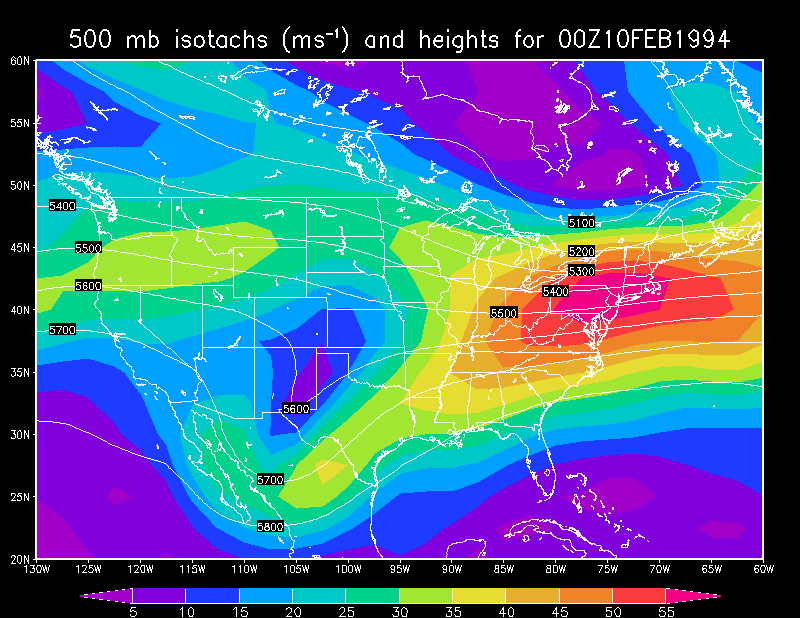
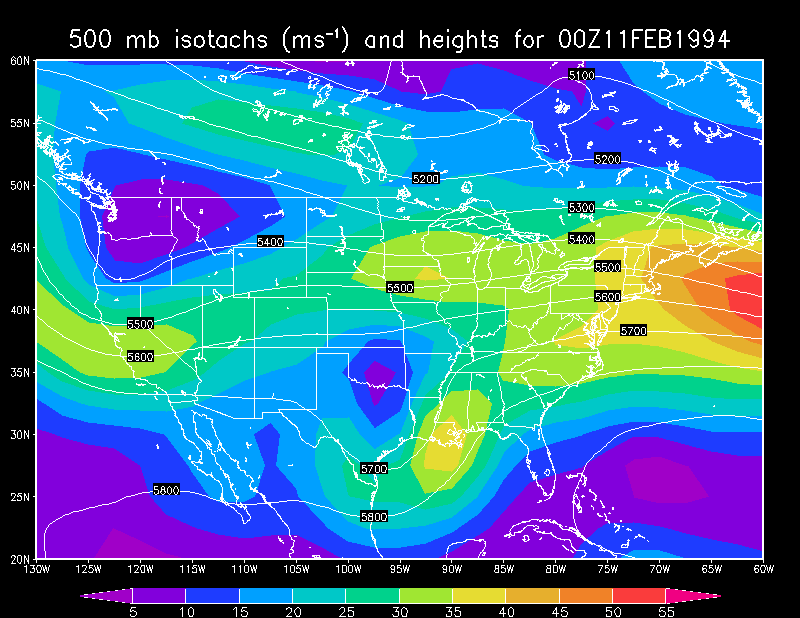
Upper Air Maps
The below maps are NCEP reanalysis maps at 200 MB and 500 MB. Through the height of the event, the region was positioned below the right entrance region of a strong jet max, providing a favorable environment for large scale lift. This aided in the development of the surface low which tracked across the region on February 10th, enhancing precipitation rates across the Delta.
These NCEP reanalysis plots are courtesy of Dr. Christopher Godfrey, University of North Carolina Asheville
 |
 |
 |
 |
 |
 |
 |
 |
 |
 |
 |
 |
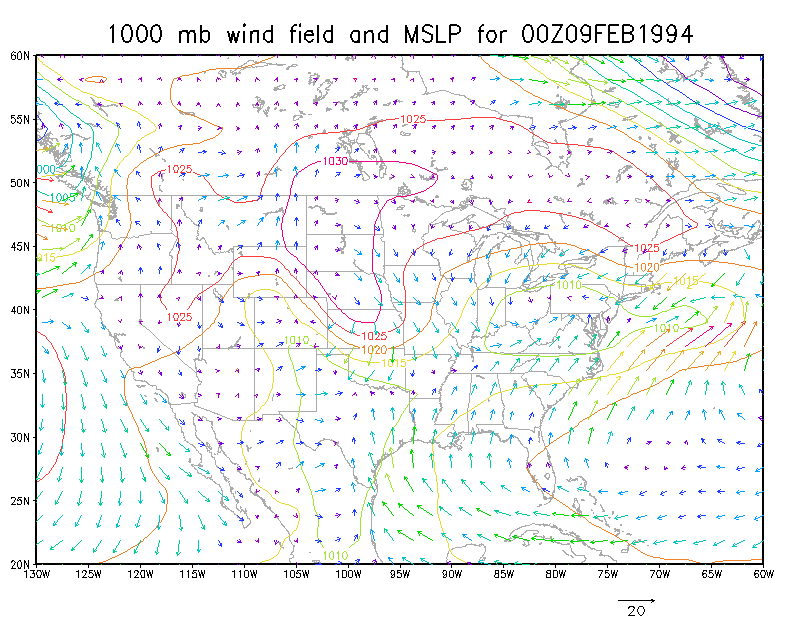
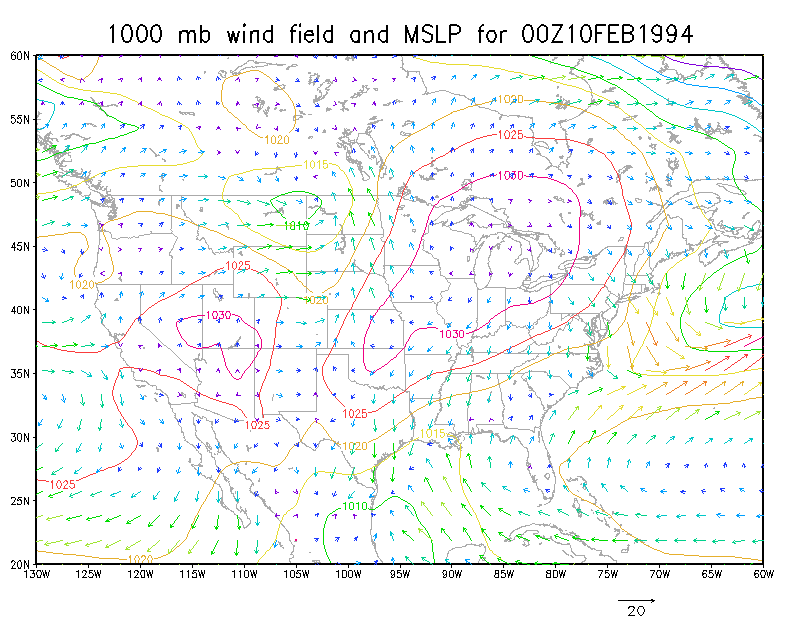
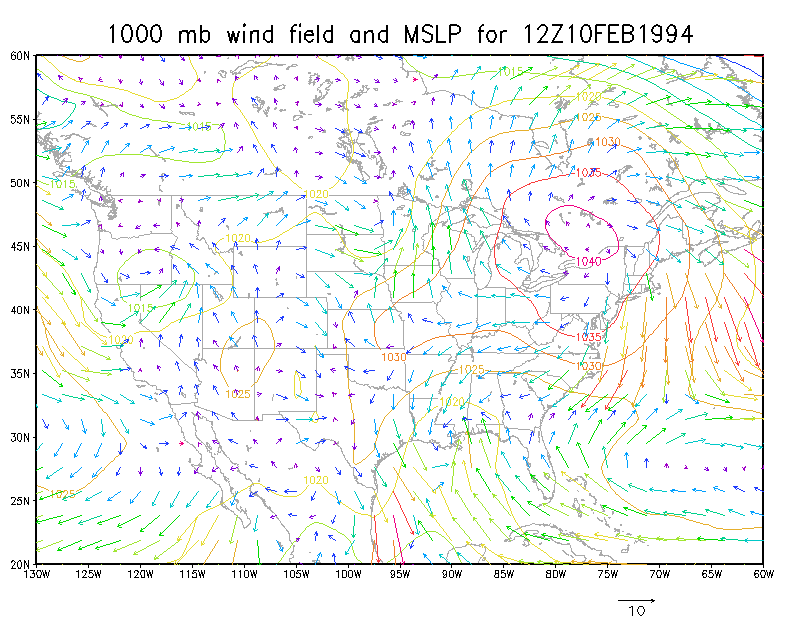
Surface Maps
The below maps are NCEP reanalysis maps showing mean sea level pressure and 1000 MB winds. These maps show the progression of the cold front that brought freezing temperatures into the area, as well as the surface low which tracked across the region.
These NCEP reanalysis plots are courtesy of Dr. Christopher Godfrey, University of North Carolina Asheville
 |
 |
 |
 |
 |
 |

