|
Overview
On March 4, 2015 at 3 pm, a very sharp cold front extended southwest from a closed low over eastern Canada into eastern Pennsylvania southwest through Nashville and just into northeast Mississippi near the northwest Alabama border. Very warm temperatures were in place southeast of this boundary into northern Alabama, where temperatures were in lower to mid 70s (73 to 77 degrees). Approximately 200 miles (only a two to three hour drive) northwest of this boundary temperatures were in the mid 20s to lower 30s (a difference of 44 to 55 degrees). This is quite a strong cold front for the southeastern U.S. in early March.
Before midnight, this boundary was trapped between two strong areas of high pressure. One was located off the Atlantic coast east of the Bermuda Islands. The second high pressure was moving south-southeast from the Upper Midwest towards Missouri and eastern Kansas. Most of the flow south of Tennessee at the low levels was parallel to the front as can be seen in the 850 mb upper air chart before midnight. The main push of the colder air was primarily from Missouri into Arkansas and eastern Oklahoma and from the Ohio Valley into West Virginia and Pennsylvania during this time. With strong southerly flow in place south of the front and the high off the Bermuda Island slow to push east and weaken, this set the stage for rain showers to continue near and south of this boundary until around midnight on March the 4th.
After midnight, the strong 1035 mb surface high over Missouri/Arkansas weakened the western edge of the high pressure area east of Bermuda. This modified the flow behind the front, as it became more perpendicular in orientation to the front, finally advecting colder air south into Tennessee and northern Alabama. This dropped surface temperatures into the lower to mid 30s, with temperatures aloft around 925 mb to between -5 and -10 degrees Celsius (close to if not at the temperature for ice nucleation - formation of ice). This lead to the widespread development of periods of moderate to heavy sleet between midnight and 7 am across southern Middle Tennessee and northern Alabama. This was caused by strong moisture advection south of the front over-running strong (deep) lift remaining in place on the right entrance region of the jet stream (See 500 mb and 850 mb images at 6am on March the 5th).
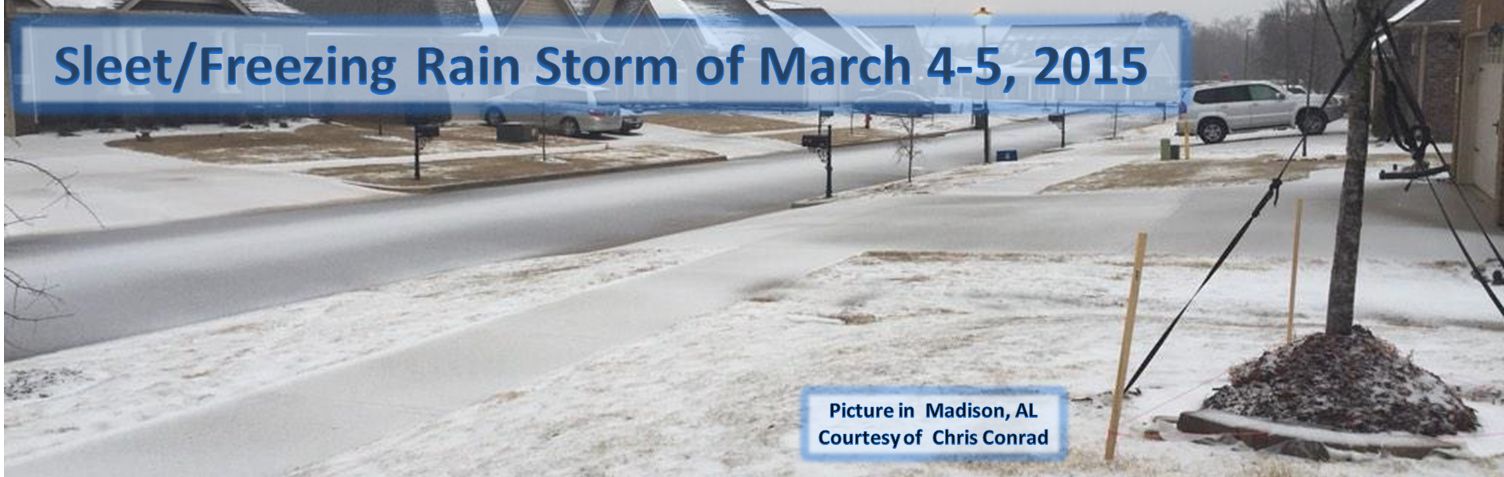
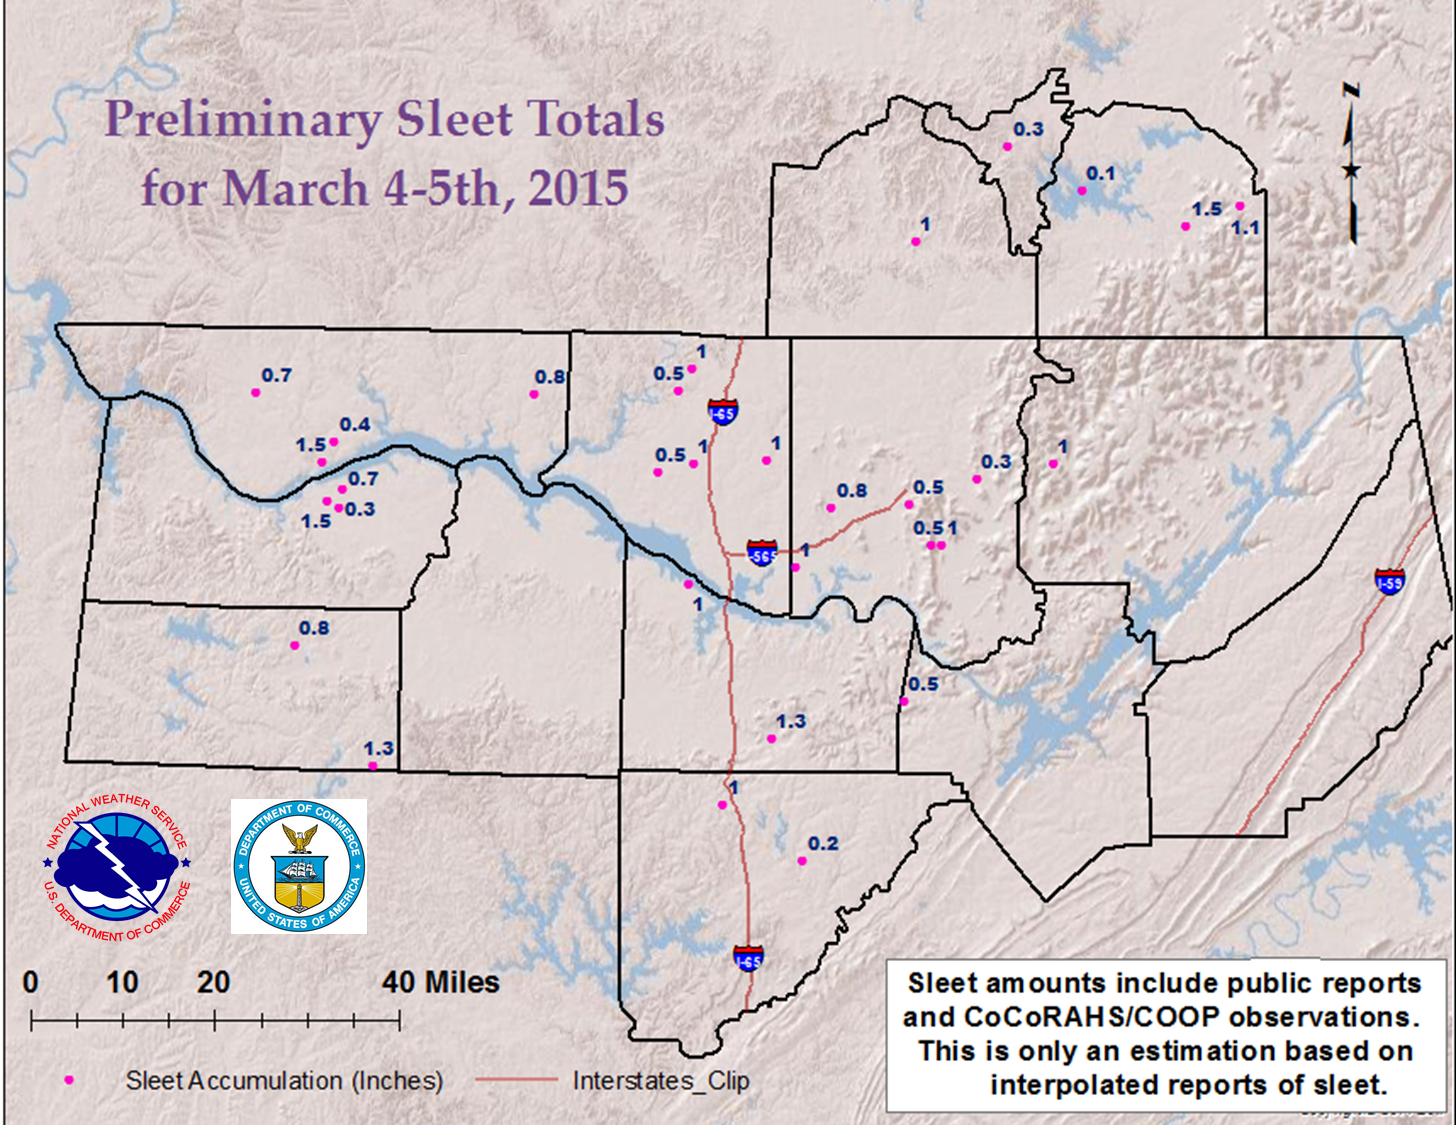
Although the colder temperatures were finally moving southward behind the front in earnest after midnight, the precipitation and forcing associated with the front were still moving southward slowly. The slow movement of the cold air led to sleet accumulations mainly occurring west of a line from near Scottsboro in Jackson County, AL to Guntersville in Marshall County, AL. Most sleet accumulations through the early morning hours on March 5th were between 0.5 and 1.5 inches (most of this fell between midnight and 7 AM). Higher amounts were seen in Lauderdale, Colbert, Morgan, Madison, and western Jackson counties in Alabama (1.0 to 1.5 inches of sleet). Likely some heavier amounts of sleet fell in central or northern Lawrence County, however no reports were received in these locations. Also some amounts in southern Middle Tennessee were around 1.5 inches.
Behind the front, this strong 1035 mb area of high pressure kept very cold temperatures in place over northern Alabama and southern Middle Tennessee from Thursday Night into Friday morning. This kept the sleet from melting very quickly on Friday. This can be seen in satellite imagery from 10 AM on March 6th, 2015.
|


 Local Radar
 Weather Map