
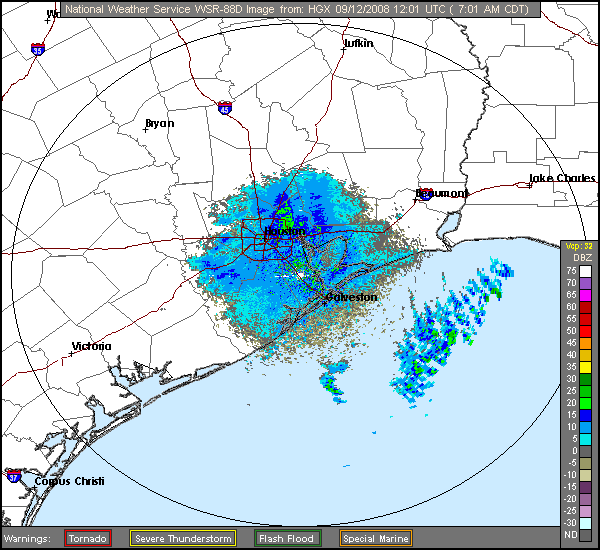

Ike was a long-lived Cape Verde hurricane that caused extensive damage and many deaths across portions of the Caribbean and along the coasts of Texas and Louisiana. It reached its peak intensity as a Category 4 hurricane (on the Saffir-Simpson Hurricane Scale) over the open waters of the central Atlantic, directly impacting the Turks and Caicos Islands and Great Inagua Island in the southeastern Bahamas before affecting much of the island of Cuba. Ike, with its associated storm surge, then caused extensive damage across parts of the northwestern Gulf Coast when it made landfall along the upper Texas coast at the upper end of Category 2 intensity.
Storm Surge
For residents of southeast Texas, Ike will forever be remembered for its large and significant storm surge. Although just under the wind speed criteria for a major hurricane (115 mph or greater), Ike produced the greatest storm surge along the Texas coast since Hurricane Carla (Category 4) made landfall near Port Lavaca in 1961. Ike also produced a greater storm surge than that produced by Hurricane Alicia (1983), which was the last major landfalling hurricane (Category 3) for southeast Texas. Ike was approximately four times larger than Alicia when comparing the size of the hurricane force wind fields. The highest storm surge occurred on the Bolivar Peninsula and in parts of Chambers County (including the east side of Galveston Bay), roughly between the Galveston Bay entrance and just northeast of High Island. Complete tide gauge records for this area are unavailable since many of the sensors failed from salt water intrusion and large wave action, although ground assessment teams determined that the surge was generally between 15 and 20 feet. The highest water mark was 17.5 feet located about ten miles inland in Chambers County. Much of the southern part of Chambers County was also inundated by at least 10 feet of water. Storm surge levels on Galveston Island and on the west side of Galveston Bay are estimated to be between 10 and 15 feet. The highest inundation, of at least 10 feet, occurred on the bay side of Galveston Island, the coast of mainland Galveston County, as well as over Apffel Park at the northern tip of Galveston Island where Ike made landfall. Farther to the south, a storm surge of 5 to 10 feet was recorded in Brazoria County, including near Freeport. The remainder of the Texas coast south of Brazoria County recorded surge heights of 2 to 5 feet.
Wind/Tornadoes
Sustained winds of 85 to 100 mph most likely occured across southeast Texas. Ike was structured such that the southern half of the hurricane had more intense winds than the northern half. The strongest winds were still in the northeast quadrant which is very typical for a northward moving hurricane. Tropical storm and hurricane force winds persisted for at least 9 hours for most areas near the center of the hurricane, mainly due to the fact that Ike had a large circulation center and an expansive wind field well east of the storm. More than likely, it was the longevity of the winds that contributed to extensive damage across southeast Texas, more so than the intensity of the winds. There was no evidence that Ike produced any tornadoes across southeast Texas. However, radar imagery does indicate possible smaller scale rotations around the eye of Ike that could have produced weak tornadoes. Any weak tornado damage that may have occured was overshadowed by Ike's Category 2 winds and the widespread damage that they created.
Rain
Ike produced heavy rainfall across portions of southeast Texas September 12-13. A cold front then moved across these same locations on the 14th and heavy rainfall developed as deep tropical moisture focused along the front. Rainfall totals on the 14th equaled or exceeded those associated with Ike and some locations experienced flooding during both events. Rainfall totals were between 5 and 10 inches across the nine county area that ranges roughly between Livingston and Navasota south to the coast. Rainfall ahead of the cold front totaled another 5 to 8 inches. By the evening of the 14th, rainfall maximums of near 15 inches had fallen across portions of Houston, Liberty, and Montgomery Counties. In the uptown area of Houston, isolated observations of around 18 inches were recorded.
Casualties
Ike was directly responsible for 103 deaths across Hispaniola, Cuba, and parts of the United States Gulf Coast. Extensive damage from strong winds, storm surge, and rainfall occurred over Hispaniola, the Turks and Caicos Islands, the southern Bahamas, Cuba, and the U.S. Gulf Coast from Florida to Texas. Additional deaths and significant damage occurred across parts of the Ohio Valley and southeastern Canada after Ike lost tropical characteristics. The latest official counts and media reports indicate that 20 people died in Texas, Louisiana, and Arkansas as a direct result of Ike. Twelve fatalities were reported in Galveston and Chambers Counties, Texas, where the worst storm surge occurred, and several bodies were found within debris fields on the bay side of the Bolivar Peninsula, on Goat Island, and on the north side of Galveston Bay in Chambers County. Some of the debris fields may never be searched for remains due to lack of funds, and it is possible that the final number of fatalities from storm surge might never be accurately known. Several of the deaths were Bolivar residents who did not leave after the first evacuation orders and were unable to leave once the rising waters cut off evacuation routes to the mainland. Three other drowning deaths were reported across Texas. In addition, one death in Montgomery County and one in Walker County resulted from trees falling onto the roofs of occupied houses. As many as 64 additional indirect deaths were reported in Texas due to factors such as electrocution, carbon monoxide poisoning, and pre-existing medical complications. Reports indicate that 34 people remain missing as of early February 2009, of which 19 are from Galveston, 5 from Port Bolivar, 2 from Crystal Beach, and 1 from Gilchrist.
Ike caused an estimated $19.3 billion in damage. These estimates place Ike as the fourth costliest hurricane to affect the United States, after Hurricanes Katrina (2005), Andrew (1992), and Wilma (2005).
Here is Ike's rainfall rainfall data, courtesy of the National Weather Service's Weather Prediction Center.
A track map of Ike (courtesy of NHC) can be found here.
More detailed information on Ike is available in the Lake Charles National Weather Service Office's Ike page and in the National Hurricane Center's Tropical Cyclone Report.
Summaries of Ike can be found in our Spring 2009 Storm Signals Newsletter and our 2009 Hurricane Workshop Booklet.
Edouard moved ashore along the upper Texas coast between High Island and Sabine Pass in the McFaddin National Wildlife Refuge and produced minimal damage totaling $100,000. Damage from Edouard included minor storm tide flooding along portions of the Bolivar Peninsula ($95,000) and brief flash flooding along portions of Interstate 10 in Chambers County ($5,000). Storm tide damage on the Bolivar Peninsula was confined to the Gilchrist area. Ten single family homes experienced flooding up to eighteen inches deep inside the home. Fifteen single family homes and two mobile homes experienced flooding up to six inches deep inside the home. Interstate 10 was closed in central Chambers County near State Highway 61 due to Edouard's heavy rainfall estimated to be between 3 and 5 inches. Tropical Storm Edouard moved ashore along the upper Texas coast between High Island and Sabine Pass in the McFaddin National Wildlife Refuge and produced minimal damage totalling $100,000. Damage from Edouard included minor storm tide flooding along portions of the Bolivar Peninsula ($95,000) and brief flash flooding along portions of Interstate 10 in Chambers County ($5,000). Storm tide damage on the Bolivar Peninsula was confined to the Gilchrist area. Ten single family homes experienced flooding up to eighteen inches deep inside the home. Fifteen single family homes and two mobile homes experienced flooding up to six inches deep inside the home. Interstate 10 was closed in central Chambers County near State Highway 61 due to Edouard's heavy rainfall estimated to be between 3 and 5 inches.
Here is Edouard's rainfall rainfall data, courtesy of the National Weather Service's Weather Prediction Center.
A track map of Edouard can be found here.
More Edouard information is available in the National Hurricane Center's Tropical Cyclone Report.


Humberto was the first hurricane to make landfall in the United States since Wilma struck South Florida in October 2005 and the first hurricane to make landfall along the Texas coast since Rita struck the Texas-Louisiana area in September 2005. The intensification rate in Humberto was one of the highest that has ever been observed for an initially weak tropical cyclone. It is estimated that the cyclone strengthened from a 30 mph low into an 90 mph hurricane within 24 hours. This rapid increase in intensity is rare, and only three others storms (Celia/1970, Arlene and Flora/1963) have intensified more in 24 hours from below tropical storm strength. Humberto had a peak wind of 90 mph and a minimun central pressure of 985 mb when it made landfall around 2:00 AM CDT just east of High Island, TX.
For several days before the formation of Humberto, there were disorganized showers and thunderstorms that extended from western Cuba into the eastern Gulf of America associated with an upper level low and a weak surface trough. Unfavorable wind shear initially prevented development of this system as it tracked slowly to the west-northwest. The shear began to relax on Tuesday the 11th, and early in the morning on Wednesday the 12th convection began to increase over a developing surface low pressure area. As the developing system began a northwest drift, quick organization was noted on radar imagery and buoy data. The disturbance was estimated to have become a depression at 4:00 AM CDT with the center located 120 miles south of Galveston. A ship report and radar data suggest that the depression quickly became a Tropical Storm Humberto around 7:00 AM, and it moved slowly to the north.
Intense thunderstorm activity in well-defined spiral bands continued near the tropical storm, and the small tropical cyclone continued to rapidly strengthen just offshore of the upper Texas coast. Later in the day, Humberto turned to the north-northeast due to steering around a large middle-level high over the southeastern United States. Radar data indicate that Humberto became a hurricane about 20 miles south of High Island, Texas around 10:00 PM, and the cyclone reached an estimated peak intensity of 90 mph as it made landfall just east of High Island in McFaddin National Wildlife Refuge around 2:00 AM on Thursday the 13th. The hurricane moved over extreme southeastern Texas across the Beaumont/Port Arthur area, and entered southwestern Louisiana, weakening into a tropical storm about 75 miles west-northwest of Lafayette. The storm became a depression near Alexandria late on the 13th, and dissipated the next day over central Mississippi.
Damage from Humberto in the Houston/Galveston National Weather Service Office's county warning area was confined to the far eastern portions of Southeast Texas from just east of Canal City to about 6 miles north of High Island, including the community of High Island. The damage was indicative of 70 to 80 mph winds (strong tropical storm force to Category 1 hurricane force winds). Gusts near 90 mph (Category 1 hurricane force winds) may have occurred in High Island given extensive damage to power poles, roof damage to a hotel, snapped tree trucks and the awning collapse of a gas station. Preliminary damage estimates in Galveston County indicated that 5 single family homes were completely destroyed, 22 received major damage, and 49 received minor damage. 5,000 homes were isolated due to road closures. Total damage costs around the Bolivar Peninsula and High Island have been estimated at around $30 million. Maximum rainfall amounts from Humberto ranged from around 2.00 to over 14 inches mainly along and east of a line from Freeport to the Hitchcock-Texas City area to around Winnie. Some of the highest amounts recorded in WFO HGX's area were 14.13 inches at East Bay Bayou (just west of Highway 124 in southeast Chambers County), 9.84 inches at the Gulf Intercoastal Waterway and the State Highway 124 bridge (approximately 3 miles north of High Island), 8.11 inches at Spindletop Bayou and the State Highway 124 bridge (approximately 3 miles south of Stowall), 8.31 inches in Gillchrist (Rollover Pass), 6.50 inches at the Galveston Island Coast Guard Station and 5.80 inches at Jamaica Beach.
A track map of Humberto can be found here (courtesy of the University of Wisconsin-Madison).
More detailed information on Humberto is available in our Humberto page, in the Lake Charles National Weather Service office's Humberto page, an in depth and very detailed study on Humberto's rapid intensification and in the National Hurricane Center's Tropical Cyclone Report.
Erin made landfall along the middle Texas coast around the Port Aransas area as a minimal tropical storm early on August 16th. A southeast to northwest feeder band developed around 10:00 AM CDT from Katy to the western end of Galveston Island and moved slowly eastward to a line from Clear Lake to Humble by 5:00 PM CDT. Training of the cells along this southeast to northwest line combined with rainfall rates upwards of 4 to 5 inches per hour resulted in major street flooding and minor flooding of several bayous in Harris County. Widespread major street flooding occurred throughout the afternoon across the eastern half of Harris County with SH 288 impassable near the 610 south loop, I-10 east closed at Wayside, and numerous secondary roads closed along I-45 S, SH 225, and I-10 E. Flooding of homes and businesses occurred in the La Porte area where some structures were inundated with more than a foot of water. House flooding also occurred in the Pasadena area. There were also at least a dozen schools that received water damage. In WFO Houston/Galveston's area, there were three deaths from Erin. Two fatalities were from a supermarket roof collapse under the weight of the heavy rainfall, and the third fatality was from a vehicle that drove into a flooded retention pond.
A track map of Erin can be found here (courtesy of the University of Wisconsin-Madison).
More detailed information on Erin is available in the National Hurricane Center's Tropical Cyclone Report.


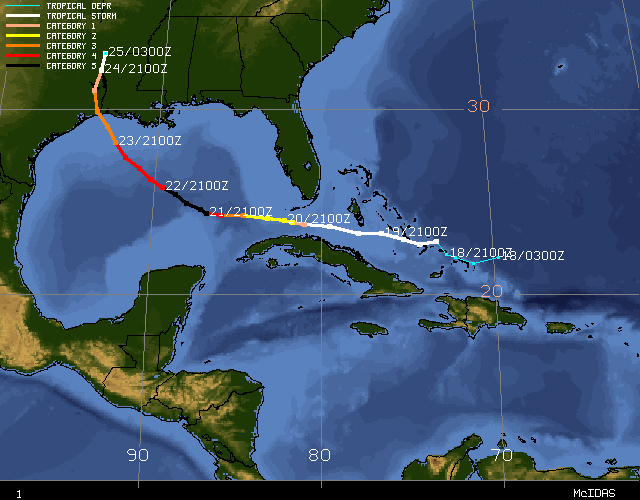
Rita moved ashore in extreme southwest Louisiana between Sabine Pass and Johnson's Bayou in Cameron Parish with a minimum central pressure of 937 mb and maximum sustained winds of 120 mph. Rita was a Category 3 hurricane at landfall.
Two and a half weeks after Hurricane Katrina made her final and devastating landfall along the northern Gulf coast, all eyes turned to Tropical Storm Rita as she moved westward through the central Bahamas (more information on Katrina can be found at the NHC/TPC Hurricane Katrina Tropical Cyclone Report, NOAA's Hurricane Katrina Service Assessment Report, the NCDC Summary of Hurricane Katrina and our Hurricane Katrina Page). On Tuesday, September 20th, Rita rapidly intensified while moving west through the Florida Straits into the Gulf of America. Rita reached Category 2 intensity as the center passed about 50 miles south of Key West and significantly impacted the Florida Keys.
After entering the Gulf of America, Rita intensified at an astounding rate going from Category 2 to Category 5 intensity in 24 hours. Following this rapid intensification period, sustained winds reached 165 mph on the afternoon of Wednesday, September 21st. Since early Monday, Rita had been consistently forecast to make landfall along the upper southeast Texas coast, when the 120 hour forecast from the National Hurricane Center depicted a landfall near San Luis Pass. Emergency management officials, members of the media, and residents of southeast Texas had been watching Rita closely and planning their course of action on Monday and Tuesday. Therefore, even though the hurricane was still 620 miles southeast of Galveston, everyone had the images of Hurricane Katrina's impact on the central Gulf of America coast still fresh in mind, and an unprecedented, largely voluntary evacuation began on Wednesday across southeast Texas. Emergency management officials ordered a mandatory evacuation for coastal sections of southeast Texas beginning at 6 PM on Wednesday. However, residents waiting until then to begin their evacuation found roadways in and around the densely populated Houston/Galveston area already jammed with motorists who had left earlier in the day.
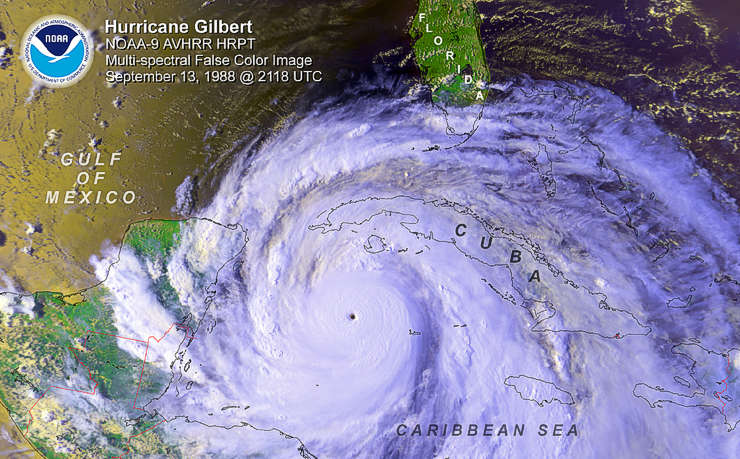
The fear of Katrina-like impacts prompted many inland residents to evacuate even though they were not at risk from storm surge flooding. Therefore, an incredible number of people left, with officials estimating the total to be over 2.5 million. Although the gridlock and gasoline shortages frustrated many evacuees, the evacuation had been ordered very early, and there was ample time for residents to escape the region before the onset of adverse conditions, which were expected on Friday afternoon. By early Thursday morning, September 22nd, Rita had strengthened further and reached a peak intensity of 175 mph winds with a minimum central pressure of 897 mb. This was the third lowest pressure on record at that time for the Atlantic basin (behind Hurricane Gilbert's 888 mb on September 14, 1988 and the Labor Day Florida Keys Hurricane's 892 mb on September 2, 1935), and displaced Katrina to fifth on the most intense hurricane list. An upper-level disturbance passing well north of Katrina early on Thursday briefly induced a more northward motion and altered Rita's motion from west-northwest to northwest. Although this change in motion was only slight; it spared the densely populated Houston/Galveston area from a direct hit and shifted the forecast track and eventual landfall point to the right. Residents of extreme southeast Texas and southwest Louisiana were then expected to experience the brunt of Rita. Fortunately, Rita weakened to a Category 3 hurricane on Friday, September 23rd, prior to landfall which occurred around 2:30 AM Saturday morning just east of the Texas/Louisiana border between Sabine Pass and Johnson's Bayou. Rita caused devastating storm surge flooding and wind damage in southwest Louisiana and extreme southeast Texas (see the Lake Charles National Weather Service Office Hurricane Rita Page for more details). Here are some before and after photo comparisons from hard hit Cameron Parish, Louisiana (courtesy of the USGS Center for Coastal and Watershed Studies).
Hurricane Rita was the strongest hurricane to make landfall across this portion of the U.S. coastline since Hurricane Audrey (1957). Rita affected a large inland area from southeast Texas across southwest and into south-central Louisiana. Widespread damage consisting of downed trees and power lines occurred generally along and east of a line from Crystal Beach to Liberty to Livingston to Lufkin in Texas. Although Rita tracked 50 miles east of Lake Livingston, sustained northerly winds of 40 to 60 mph occurred across the lake, generating a lake surge that damaged the dam. Fear that the dam could break forced an evacuation of communities immediately downstream as a precautionary measure. Emergency water releases from the dam on Saturday quickly abated this danger.
Moderate beach erosion occurred from Freeport to High Island. Dunes protecting many beach houses along the west end of Galveston Island and Surfside in Brazoria County were washed away. Large geotubes along portions of the west end of Galveston Island and also along portions of the Bolivar Peninsula did reduce erosion in areas where they were installed.
Most flooding was due to high tides along Galveston Island and the Bolivar Peninsula. Most of this flooding actually occurred near the time of landfall as water in Galveston Bay was pushed south out of the Bay onto the north facing shores of the island and the peninsula. Tides remained high on Saturday (after Rita made landfall) as strong westerly winds pushed water into East Bay. No significant flooding occurred due to heavy rain.
All of the associated effects of Hurricane Rita in southeast Texas resulted in 3 direct fatalities, 3 injuries and $159.5 million in property and crop damage. In addition, the massive evacuation resulted in at least 49 indirect fatalities, mostly due to excessive heat and the transportation of the elderly out of harm's way.
In Harris County, tropical storm force sustained winds with gusts near 60 mph caused numerous trees to be blown down resulting in widespread power outages that lasted for six days in some areas. Roof, fence, sign, and glass damage estimates were around $90 million. The greatest loss was to inventory spoilage of food due to power outages. There were at least 34 indirect fatalities before, during and after Hurricane Rita. The majorities of these fatalities occurred during the evacuation prior to Rita and were the result of excessive heat and transporting the elderly.
In Brazoria County, tropical storm force sustained winds with gusts near 50 mph caused some tree damage and power outages for a couple of days. Minor damage was reported in Surfside to roads and a few homes. Total damage was around $500,000.
In Montgomery County, tropical storm force winds with gusts to near hurricane force were observed. Damage was mainly to fences, roofs and mobile homes and totaled approximately $2.5 million. There were 13 indirect fatalities. Ten of the deaths were evacuation related while 3 deaths were carbon monoxide poisoning with no electricity in the home.
In Walker County, tropical storm force winds with gusts to near hurricane force were observed. Damage was mainly to fences, roofs and mobile homes and totaled approximately $1.5 million.
In Galveston County, tropical storm force sustained winds with gusts to hurricane force were reported across the county, especially on the Bolivar Peninsula. Numerous power poles and road signs were blown down on Bolivar. Many of the beach homes received roof damage. Numerous trees were down with small structure damage on High Island. Power was out to most of the county on Saturday. In Galveston's historic district, a large brick-covered side of a three-story building collapsed and three other buildings caught fire and were destroyed during the height of the storm. There were three directly related injuries. A thirty-year-old woman suffered severe burns in the fire and two firefighters had minor injuries. Small structure, dock, and pier damage along with downed power lines occurred across Galveston Island. Total damage across the county was around $15 million.
In Chambers County, tropical storm force winds with gusts in excess of hurricane force were observed. Damage consisted of downed trees, destroyed metal buildings and awnings, and downed power poles. One frame building near Winnie received major damage. Power was out throughout the county for up to seven days. Total damage across the county was around $8 million. One indirect fatality occurred in the county.
In Liberty County, tropical storm force winds with gusts in excess of hurricane force were observed. Damage consisted of downed trees, destroyed metal buildings and awnings, and downed power poles. Power was out throughout the county for up to seven days. Total damage across the county was around $7 million. There were two direct fatalities. In Hardin, a man and a woman were killed when a tree fell on the home they were sleeping in.
In Polk and San Jacinto Counties, tropical storm force winds with gusts to near hurricane force were observed. Widespread trees were down with many trees taking down power lines. Some trees fell onto homes and caused considerable damage. Widespread power outages were observed across both counties. Lake Livingston Dam reported a wind gust of 117 mph around 5:30 AM Saturday morning. This wind sensor was on the dam and the wind was blowing across the lake. With the reduced friction across the lake's surface, this wind gust report is reasonable. The strong wind blowing along the lake created a storm surge of approximately 1.5 feet at the dam. This high water and the wave action damaged the dam which required emergency releases from the lake to stabilize the dam. Total damage in Polk County was around $23 million with $20 million of that being damage to the dam at Lake Livingston. Damage in San Jacinto County was estimated at $10 million. There was one direct fatality in San Jacinto County. A three-year-old female was killed instantly by a tree falling on to her home in Point Blank.
In Houston and Trinity Counties, tropical storm force winds with gusts to near 50 mph were observed. Numerous trees were down resulting in numerous power outages. One heat related indirect death occurred in Houston County during the evacuation. Total damage for both Houston and Trinity counties was near $2 million.
No tornadoes were reported with Rita. Maximum rainfall amounts with Rita were between 4 and 6 inches in and around the New Caney area of Montgomery County.
A track map of Rita can be found here.
More information on Rita is available in our Hurricane Rita page, and in the Tropical Prediction Center's Tropical Cyclone Report.
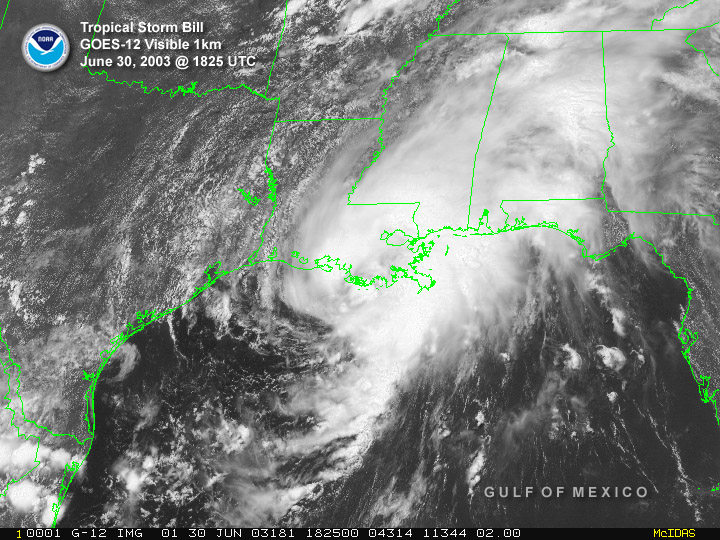
Bill rapidly developed into a minimal tropical storm in the Gulf of America on the morning of Sunday, June 29th about 450 miles southeast of Galveston. A Tropical Storm Watch was issued from San Luis Pass, Texas to Morgan City, LA. Bill's initial northwest motion shifted to the north late in the afternoon and evening. As a result, the Tropical Storm Watch for the Texas coast between San Luis Pass and High Island was cancelled. Bill moved to the north until making landfall in Southeastern Louisiana on Monday, June 30th as a tropical storm with sustained winds of 60 mph. Thousands of homes in Louisiana lost power during the storm and damaging rainfall amounts associated with Bill and its remnants caused flooding in states throughout the Southeast. At least 8 inches of rain fell in Pascagoula, Mississippi though rainfall and tornadoes also caused problems into Mississippi, Alabama, Tennessee, Georgia, North Carolina and Virginia.
Bill caused some minor beach erosion on the Bolivar Peninsula. Rainfall totals with the storm were light, ranging from just 0.01 inches at Houston Hobby Airport to 0.20 inches in League City to 1.07 inches in Jamaica Beach. Peak wind gusts were in a 15 to 20 mph range. The highest tide reading was 3.81 feet above mean low-lower water at 3:30 AM CDT on the 30th at Pleasure Pier.
A track map of Bill can be found here.
More detailed information on Bill is available in our Post Storm Report, and in the Tropical Prediction Center's Tropical Cyclone Report.


Claudette made landfall along the middle Texas coast at Port O'Connor around 10:30 AM CDT on Tuesday, July 15, 2003. Claudette was the first hurricane to strike the Port O'Connor and Matagorda Bay area since Hurricane Fern on September 10, 1971. Historical records dating back to 1851 indicate Claudette is the first July hurricane to make landfall in this area.
Claudette developed from a tropical wave over the central Caribbean Sea on July 8th. The storm moved westward until July 10th, when it turned northwestward over the northwestern Caribbean Sea. This motion brought the center over the northeastern Yucatan Peninsula of Mexico on July 11th. Claudette briefly became a hurricane on July 10th and was a 60 mph tropical storm at landfall in Yucatan. Claudette moved northwestward into the Gulf of America on July 12th, then meandered over the central Gulf of America on July 13th. A general north-northwestward motion followed on July 14th and Claudette slowly intensified during this time. Claudette reached hurricane strength on July 15th as it turned west-northwestward. This motion brought the center to the Texas coast at Port O'Connor that morning as a 90 mph Category 1 hurricane on the Saffir-Simpson Hurricane Scale. Claudette turned westward after landfall, moving across portions of southern Texas and northern Mexico. The cyclone turned west-northwestward across northwestern Mexico and the Texas Big Bend area before dissipating on July 17th.
Damage was observed across most Southeastern Texas coastal counties. Major beach erosion was observed from High Island to Freeport. Large geo-tubes on Galveston Island and the Bolivar Peninsula did significantly reduce erosion. Coastal roads along the west end of Galveston Bay were under water due to tidal flooding. Further south in Matagorda County, major beach erosion was observed in the Sargent area. Tides in the west Matagorda Bay area were minimal. Water was pushed out of Matagorda Bay as Claudette approached and did not have adequate time to generate a large surge once the winds became east and then southeast.
In Chambers County, lowland flooding was observed on the eastern shore of Galveston Bay within the communities of Smith Point, Oak Island, White Heron Estates, Cedar Point and Beach City. In Harris County, flooding was observed in the low-lying areas along the western shore of Galveston Bay (Seabrook and La Porte).
In Galveston County, 38 single family homes were destroyed, 25 received major damage, and 964 received minor damage. 33 businesses were affected with damage costs of an estimated $970,000. Total damage, including beach erosion, was estimated at $8.3 million. The highest recorded tide level, 7.56 feet above mean low-lower water, occurred around sunrise on the 15th at Pleasure Pier.
In Brazoria County, 2 single family homes were destroyed, 10 received major damage, and 39 received minor damage. 2 businesses were destroyed and 9 received major damage totaling $655,000. Total damage, including beach erosion, was estimated at $1.27 million. The highest recorded tide level, 6.99 feet above mean low-lower water, occurred in Freeport at the Brazos River levee on the morning of the 15th.
In Matagorda County, 85 homes and 75 mobile homes were destroyed. 70 homes and 26 mobile homes received major damage. 105 homes and 117 mobile homes received minor damage. 52 businesses were destroyed or received major damage and 50 businesses received minor damage. One tornado (F1) damaged a couple buildings at the Baptist Youth Camp in Palacios. Total storm damage was estimated at $716,300. The highest recorded tide level occurred at the Colorado River Locks at Matagorda where the tide level reached 8.00 feet above mean low-lower water on the morning of the 15th.
In Jackson County, all damage was wind related. Numerous homes suffered roof damage and numerous trees were down in the southern portion of the county. 4 single family homes were destroyed, 13 suffered major damage and 38 had minor damage. One business received major damage from wind. There were two injuries. Total damage was estimated at $593,860.
The highest reported wind gust was at the South Texas Nuclear Power Plant in Matagorda County where an 86 mph wind gust was recorded at 1000 CDT on July 15th. The highest recorded sustained wind (58 mph) was recorded at East Matagorda Bay (PORTS/TCOONS site) in Matagorda County.
A track map of Claudette can be found here. Rainfall history with Claudette can be found here.
Much more information on Claudette is available in our special Hurricane Claudette page, and in the Tropical Prediction Center's Tropical Cyclone Report.

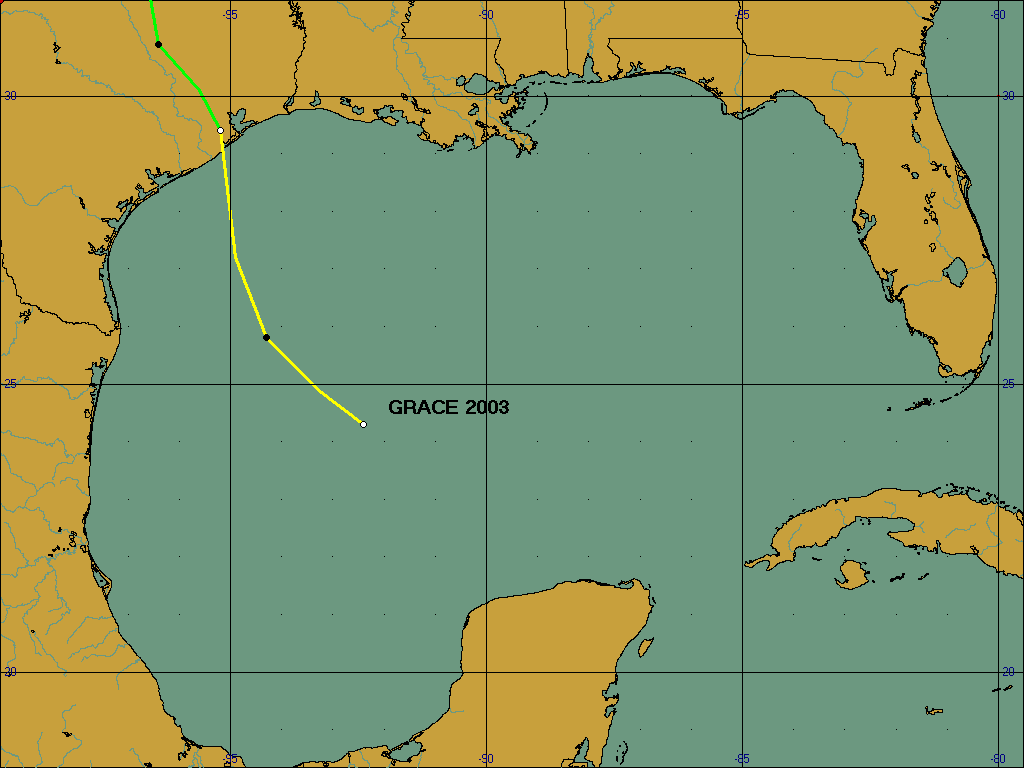
The broad circulation of poorly organized Tropical Storm Grace made landfall between Port O'Connor and Freeport on August 31st. Grace was the second tropical cyclone to affect this portion of the Texas coast in less than two months (Hurricane Claudette moved through the Port O'Connor area on July 15th). Grace ended up being a heavy rain producer for portions of the Upper Texas Coast where some flooding was observed. There was no damage due to Grace's winds.
Grace developed from a tropical wave that moved across the Yucatan Peninsula and into the southeastern Gulf of America late on August 29th. Development was inhibited by strong vertical wind shear. On August 30th, the shear lessened and a tropical depression formed about 335 miles east southeast of Corpus Christi. Reports from a ship and a reconnaissance aircraft indicated that the cyclone had strengthened into Tropical Storm Grace later that day. Grace moved in a general northwestward direction and remained poorly organized until it made landfall along the Texas coast between Port O'Connor and Freeport on August 31st. The system continued to move inland and quickly weakened to a depression. Outer rain bands containing heavy rainfall continued to develop near the coast well after Grace had weakened and produced additional heavy rainfall that lead to some flooding on into the first two days of September.
Heavy rainfall between 6 and 15 inches was observed from extreme eastern Galveston County to across the Bolivar Peninsula and northward into Chambers and portions of Liberty Counties. A secondary area of heavy rainfall was over southern Matagorda County where an estimated 6 to 12 inches was observed. The majority of this location's rain fell in the early morning hours of September 1st. The Corps of Engineers at the Matagorda Locks reported 9 inches of rain between 2 AM and 8 AM CDT that day. Some roads were flooded in all of these areas.
Beach erosion was minor. Water did get up to the dunes but little additional damage was done to the beaches beyond what Hurricane Claudette had already done in July.
There was one waterspout observed in association with Grace just off of Pirates Beach on the west end of Galveston Island. The waterspout dissipated before moving inland.
A track map of Grace can be found here.
More detailed information on Grace is available in our Post Storm Report, and in the Tropical Prediction Center's Tropical Cyclone Report.

Tropical Storm Fay began as an area of disturbed weather associated with a broad low pressure system in the northwest Gulf of America during the first week of September. On Thursday, September 5th, this disturbance became the sixth tropical depression of the 2002 hurricane season with a poorly defined center located approximately 125 miles southeast of Galveston, Texas. That evening, just six hours after formation, the depression became Tropical Storm Fay as winds strengthened to 40 mph.
Fay remained nearly stationary Thursday night and through most of Friday. However, Fay did manage to slowly strengthen with winds reaching 60 mph late Friday morning (September 6th). On Friday evening, Fay began to redevelop further west near a cluster of strong thunderstorms. These thunderstorms began pushing inland along the southeast Texas coastline between San Luis Pass and Palacios around 11 PM CDT. As this cluster of thunderstorms moved inland, it produced extremely heavy rainfall, tornadoes, and strong damaging wind gusts. The center of Fay moved inland early Saturday morning (September 7th) near Palacios and weakened to a tropical depression late that morning.
There were no deaths in Southeast Texas associated with Fay. Three people were injured when a tornado damaged a mobile home in southern Fort Bend County Friday night. Fay produced a total of five tornadoes along a path from Freeport in Brazoria County to near Hungerford in Wharton County.
Flooding was significant in Brazoria, Matagorda and Wharton counties due to high tides and severe rainwater flooding. Between 10 and 20 inches of rain fell in an area from Freeport north-northwest to Boling in eastern Wharton County. The hardest hit area was near the community of Sweeny in southwest Brazoria County. In Brazoria County, over 1500 homes were flooded. Over 800 homes received damage from winds and tornadoes. Nearly 100 businesses and nearly 100 multi-family buildings were damaged. Nearly 500 cars were flooded. In Matagorda County, 130 single family homes and 32 businesses were damaged mainly by flood waters. As a result of high tides and heavy rain, over $1.2 million in damage was done to public facilities including roads, bridges and public buildings. In Wharton County, over 200 single family homes were damaged or destroyed. Tornadoes damaged 7 homes while the remainder of the damage was due to flooding.
It is estimated that beach erosion from high tides produced $3.5 million in damage to public roads, bridges and recreational areas across Galveston County. Another half a million dollars in damage from the high tides was inflicted on 135 residential structures. Of these 135 structures, 23 received major damage.
The highest reported wind gust was in the town of Clute in Brazoria County where an 83 mph wind gust was recorded at 120 AM CDT on Saturday.
The highest recorded tide level occurred at Jamaica Beach where the tide level reached 5.40 feet above mean low-lower water at 830 AM CDT Saturday morning, September 7th.
A track map of Fay can be found here.
More detailed information on Fay is available in our Post Storm Report and in the Tropical Prediction Center's Tropical Cyclone Report.

Hurricane Lili developed as a tropical depression in the central Atlantic Ocean on September 21st and became a tropical storm two days later. Lili brought heavy rains and gusty winds over 70 mph to the southern Windward Islands on September 23rd (400 homes were damaged and 275,000 people lost electric power in Barbados, half the banana crop of St. Lucia was destroyed and there were four fatalities in St. Vincent from mudslides) before briefly losing its identity on the 26th as it moved west-northwestward across the central Caribbean Sea. Lili regained tropical storm strength on the 27th, took a slow jog around the north coast of Jamaica on the 28th to the 30th and dumped heavy rain there as well as southern Haiti and eastern Cuba. There were four flood related deaths in Jamaica. Lili reached hurricane strength on the 30th while passing near the Cayman Islands and strengthened into a category 2 hurricane before crossing western Cuba on October 1st. Lili was the second hurricane in less than two weeks to strike western Cuba, and it forced the evacuation of thousands of people.
Lili pulled away from the western tip of Cuba and strengthened into a major category 4 hurricane on October 2nd, reaching maximum sustained winds of 145 mph in the central Gulf of America. As Lili passed just west of a moored meteorological buoy (42001) approximately 235 miles south of Buras, LA, a wind gust to 150 mph was recorded, along with wave heights of 37 feet! Another buoy along Lili’s path (42041) approximately 145 miles south of Houma, LA recorded wave heights of 40 feet! Prior to Lili, the highest wind gust ever recorded by a National Weather Service buoy in the Gulf of America was 131 mph (during Hurricane Kate on November 20, 1985) and the highest wave height ever recorded by a National Weather Service buoy was 35.6 feet on May 24, 1996). Luckily for Louisiana residents, Lili weakened prior to making landfall along the central coast in Vermillion Bay early on October 3rd. Maximum sustained winds were near 100 mph, or category 2 intensity, as the storm crossed into Vermillion Parish. The storm prompted the evacuation of an estimated nearly half-million people as it approached the Louisiana coast. Lili was the first landfalling U.S. hurricane since Irene in October 1999, and the total dollar damage was around $860 million.
Lili caused very little beach erosion along the Upper Texas Coast. The threat of Lili led East Texas emergency management officials to recommend the evacuation of Jefferson and Orange Counties (to the east of our county warning area). Southeast Texas emergency management officials recommended a voluntary evacuation of the Bolivar Peninsula and the low-lying areas of Chambers County due to the fact they might be cut off from the mainland by high tides. Please refer to our "Storm Signals" Vol. 63 article, "Hurricane Lili: Educated Evacuation Decision Making" for some details on what local emergency management officials had to deal with as Hurricane Lili rapidly strengthened and moved toward the northwest Gulf of America.
For more information on the impact Hurricane Lili had along the central Louisiana coast, please refer to the Lake Charles National Weather Service report on Lili.
A track map of Lili can be found here. Rainfall history with Lili can be found here.
More detailed information on Lili is available in our Post Storm Report and in the Tropical Prediction Center's Tropical Cyclone Report.
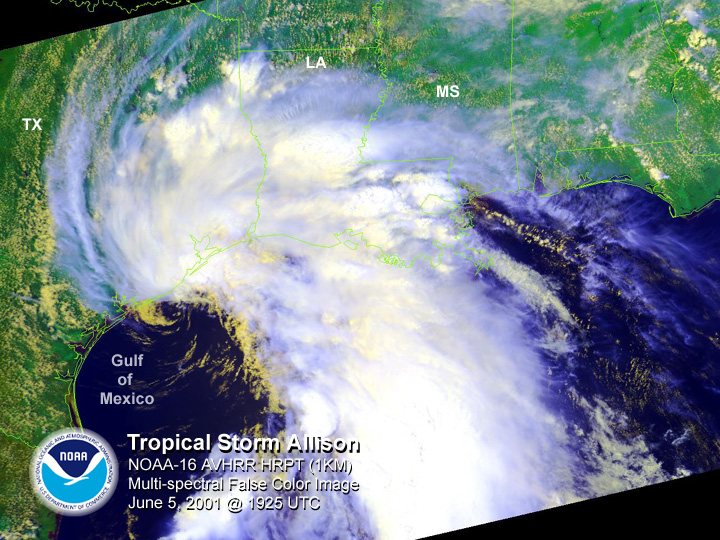


Tropical Storm Allison formed in the northwest Gulf of America on June 5th, only five days into the 2001 Hurricane Season. The system that became Allison could be traced all the way back to May 21st as a tropical wave that moved off the west coast of Africa. By the 29th, the disorganized system reached the western Caribbean Sea and then crossed into the Pacific Ocean on June 1st. The system then moved north into the Bay of Campeche late on the 4th. Organization began to take place on the 5th and by the afternoon hours, reconnaissance aircraft along with ship and buoy reports indicated that Tropical Storm Allison was born while located 80 miles south of Galveston. At her peak, Allison had tropical storm force winds up to 60 mph which were confined to offshore oil platforms and the Sea Rim State Park area in western Jefferson County. 2 to 3 foot tides along the Texas coast had little impact on the area. Allison moved inland that evening less than 12 hours after forming on the west end of Galveston Island, and during the next five days produced record rainfall that led to devastating flooding across portions of Southeast Texas, including the Houston area.
The first significant flooding occurred as Allison was a tropical storm and poised to move onshore on the 5th. A large spiral band with very heavy rainfall moved inland from Galveston to the Houston area while Allison's low level circulation center was still offshore. The rain began late in the afternoon, and by mid evening 8 to 12 inches totals were common from northern Galveston County into southern Harris County. As a result, flash flooding was observed across these areas, but no deaths or injuries occurred with this first round of storms. Heavy rain continued over inland portions of Southeast Texas overnight with 3 to 5 inch amounts common.
Allison, being steered by two subtropical ridges (one centered east of Florida and one centered west of Texas), moved inland and weakened overnight. On Wednesday the 6th, the remnants of Allison steadily moved northward into East Texas. By the evening hours, the center was near Lufkin and moving less than 5 mph. Rainfall amounts averaged 4 to 6 inches across the northern portions of our county warning area (CWA), well north of the Houston area, resulting in some minor flooding. The most significant rainfall on the day was found across east Texas and on into Louisiana.
On Thursday the 7th, the subtropical ridge off Florida weakened and drifted to the south. At the same time, the ridge west of Texas strengthened. This caused the circulation center of Allison (which was still well defined on radar) to make a clockwise loop and begin a drift to the southwest. By the time the center was around the Huntsville area (before sunrise), a band of heavy rain began to back build from Louisiana and the Beaumont area westward into Liberty County. This band produced 5 to 10 inches of rain. Another area of thunderstorms developed over the Sugar Land-Stafford areas of Fort Bend and Harris Counties during the same overnight hours and produced another 8 to 12 inches of rain. No deaths or injuries were observed with these rains, but there was abundant street flooding, and water did get into some homes. During the day, moderate to heavy rains continued to wrap around the circulation center in our northern CWA resulting in additional reports of street flooding.
Friday the 8th began with another 5 to 10 inch swath of rain developing during the early morning hours along the immediate coast from around Freeport to the Beaumont area. This rain band moved onshore and weakened during the morning hours, resulting in clear skies across most of the CWA by the beginning of the afternoon. With the circulation center now between College Station and Huntsville and drifting slowly to the southwest, it became evident that daytime heating combined with a strong moist feed across the center of the CWA would set up the most significant round of rainfall so far. Rains just east of the center drifted south over Montgomery County and produced heavy rain all day long. During the mid to late afternoon hours, convection began to develop where skies had been sunny and thunderstorms began to rapidly intensify over southern Montgomery and eastern Harris counties. At this time, thunderstorms began to train and merge across the Houston metro area, and the system evolved into a powerful complex right over the most populated portion of our CWA that evening. This complex progressed south and east into the early morning hours of Saturday the 9th. Very heavy rainfall was observed for up to 10 hours in some locations, and rainfall rates of 4 inches or more per hour were observed throughout the night. A station in northeast Houston recorded over 26 inches of rain in almost 10 hours.
Flash flooding initiated quite rapidly during rush hour late Friday afternoon and on into the evening hours. Widespread street flooding was the initial threat, but the high rainfall amounts forced almost all the major Houston area bayou systems into severe flooding, with some to record levels. All major freeways in the Houston area were severely flooded at at least one location during this event. During this single event alone, rainfall in Harris County ranged from just 2 inches in the extreme west to in excess of 20 inches over Green's Bayou in the east. Countywide, the average rainfall was 8 inches with over two-thirds of the county receiving over 10 inches.
The center gradually made its way toward Palacios by the evening on the 9th. Before moving offshore, another round of heavy rain - between 4 and 8 inches - developed across extreme southern Harris and extreme northern Galveston Counties. Some homes along Clear Creek which had escaped significant flooding from the heavy rains on Friday night ended up flooding from these rains on Saturday. The Federal Emergency Management Agency (FEMA) declared a large part of east and southeast Texas and portions of Louisiana disaster areas.
The center finally moved off to the east on Sunday the 10th and ended the event for our area. The remnants of Allison went on to wreak havoc across several Gulf Coast states with tornadoes and heavy rainfall, and eventually made its way up the east coast of the United States and continued to produce devastating flooding. Allison will go down as the costliest tropical storm in United States history.
Estimates place the total damage across Southeast Texas close to $5 billion ($4.88 billion in Harris County alone). Twenty-two deaths were caused by Allison, with each of these fatalities occurred in Harris County. By comparison, Hurricane Alicia, the last major hurricane to strike the Upper Texas Coast, caused $2 billion damage and 21 fatalities.
An interactive track map of Allison can be found here.
Advisories from the National Hurricane Center can be found here.
The Tropical Cyclone Report from the National Hurricane Center can be found here.
The Service Assessment from the DOC/NOAA/NWS can be found here.
The Atlantic Hurricane Season of 2001 summary from the Monthly Weather Review can be found here.
The summary from the Houston/Galveston National Weather Service Office (Summer 2001) can be found here.
The summary from TSARP/FEMA/HCFCD can be found here.
The 10th Anniversary of Allison was remembered from the Houston/Galveston National Weather Service Office here.

