
A cold front will linger over Florida through Tuesday, bringing widespread showers and thunderstorms, and potential flash flooding concerns. Showers and thunderstorms will be most widespread across eastern and central Florida. Gusty winds and dry conditions will promote elevated to critical fire weather conditions across the southern Plains and southern Rockies through Monday. Read More >
|
Epic Outbreak of Tornadoes Across the Southeast on 27-28 April 2011 Impacts Northeast Georgia and Western North Carolina
The same supercell thunderstorm that produced the violent tornado that devastated Tuscaloosa, Alabama, tracked across north Georgia and into Rabun County, Georgia, around 11 pm on 27 April 2011. The supercell produced a tornado over Lake Burton that caused at least one fatality. Author's Note: The following report has not been subjected to the scientific peer review process.
1. Introduction
An epic tornado outbreak occurred across parts of the eastern United States
during the afternoon and evening of Wednesday, 27 April 2011, and continued
into the early morning hours of Thursday, 28 April 2011.  The number of
tornadoes for the 24 hour period ending at 1200 UTC on 28 April 2011
shattered the previous record set during the "Super Outbreak" of 3-4 April
1974 (Fujita 1975).  The death toll was second only to the outbreak of
18 March 1925, which included the infamous "Tri-State Tornado" (Changnon
et al. 1966).  The number of strong to violent tornadoes (EF3 intensity or
greater on the Enhanced Fujita Scale) over the southern Appalachian Mountains
of North Carolina, Tennessee, and north Georgia (Table 1) was the most since
the Palm Sunday tornadoes of 1994, and the third instance of multiple violent
tornadoes in the same day since 1950.  The devastating tornadoes of 27 April
2011 were part of a larger outbreak of severe weather, mainly across the
Southeast, that spanned four days from 25 April to 29 April (Fig. 1).
Click here to read the official NWS Service Assessment
Go here for a clickable map of event reviews from other NWS offices

Table 1. F3/EF3 and F4/EF4 tornadoes in the southern Appalachian Mountains of
North Carolina, Tennessee, and north Georgia since 1950.  Click on image to
enlarge.
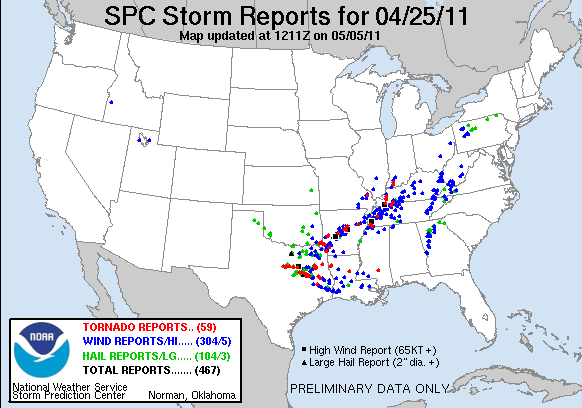
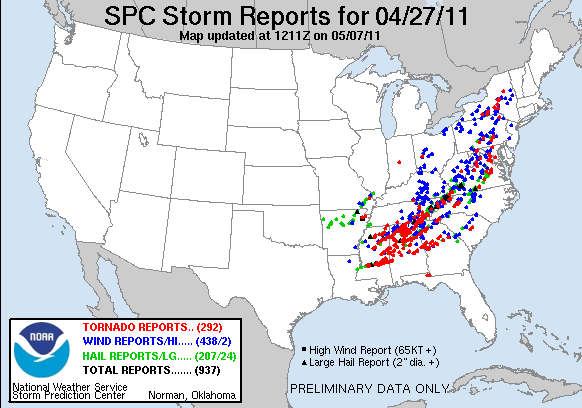
Figure 1.  Preliminary reports of tornadoes, large hail, and thunderstorm wind
damage collected by the Storm Prediction Center from NWS local storm reports
for the 24 hour period ending at 1200 UTC on 26 April 2011 (upper left),
27 April 2011 (upper right), 28 April 2011 (lower left), and 29 April 2011
(lower right).  Click on images to enlarge.
As in the Super Outbreak, northeast Georgia and western North Carolina did not bear the brunt of the tornadic activity on 27-28 April 2011. However, those locations were not entirely spared either. In fact, the events of 27-28 April bore an eerie resemblance to the Super Outbreak over the western Carolinas and northeast Georgia (Figs. 2 and 3). In both events, a supercell thunderstorm moved across north Georgia and produced tornadoes in extreme northeast Georgia. Furthermore, both events had two tornadoes reported over the northern foothills of North Carolina. At least two tornadoes briefly touched down in the mountains of North Carolina on 27 April, although several more tornadoes occurred in southwest North Carolina during the Super Outbreak.
Click here to view a map of tornado tracks on 27-28 April 2011

Figure 2. Tornado tracks during the "Super Outbreak" of 3-4 April 1974 (Fujita 1975). The 148 tornadoes documented during the outbreak are numbered sequentially in the figure. 
Figure 3.  Preliminary tornado tracks for 24-29 April 2011 across the
southeastern United States.  The tracks are color coded by maximum EF-scale
rating as shown in the legend.  Click on image to enlarge.
The events of 27-28 April 2011 were highly anticipated by the forecasters at the Storm Prediction Center (SPC) and at the Greenville - Spartanburg (GSP) Weather Forecast Office (WFO), even if the convective mode was not entirely appreciated until the evening of 27 April. The potential for severe thunderstorms was first mentioned by GSP in the Hazardous Weather Outlook issued in the afternoon of 23 April. By that time, the SPC had already included the western part of the Carolinas in the severe weather outlook for Day 5 (1200 UTC 27 April to 1200 UTC 28 April), which mentioned the possibility of isolated tornadoes. Every subsequent outlook issued by the SPC had part or all of the GSP county warning area (CWA) in a severe weather risk area for that time period. The expected threat gradually increased, with the potential for a tornado outbreak in the Tennessee Valley first mentioned in the Day 3 outlook issued at 0730 UTC on 25 April, and continued on the Day 2 outlooks issued at 0600 UTC and 1730 UTC on 26 April. The threat culminated in a moderate risk over the western half of the CWA on the Day 1 outlook issued at 0610 UTC on 27 April, with the significant tornado potential extending into the southern mountains of North Carolina, northeast Georgia, and the western tip of South Carolina.
2. Tornado Summary
Four distinct supercell thunderstorms moved across north Georgia and western North Carolina, producing at least five tornadoes within the GSP CWA during the late evening of 27 April 2011 and early morning hours of 28 April 2011 (Fig. 4). The first supercell moved across Cocke and Greene counties in Tennessee and produced a brief and weak tornado northwest of Hot Springs (Madison County), North Carolina. The second supercell was by far the most intense and quite possibly the most impressive storm of the entire outbreak. The supercell reached northeast Georgia in the late evening and produced a long-track significant tornado that began in northeast Lumpkin County. The tornado remained on the ground across northern White County, the northwest corner of Habersham County near Goshen Mountain, and then crossed Rabun County from Lake Burton to just northeast of Mountain City, where it lifted on the side of Oakey Mountain. The damage along most of the track from Lumpkin to northwest Habersham counties was rated at EF2 on the Enhanced Fujita Scale. The damage at Lake Burton was rated at EF3 and caused one fatality and at least five injuries, making this tornado the strongest in the GSP CWA since the Dudley Shoals (Caldwell County), North Carolina, F4 tornado on 7 May 1998. It was also the first significant tornado to strike Rabun County since the Palm Sunday Outbreak on 27 March 1994. The third supercell moved on a nearly identical path across Rabun County, Georgia, and across Macon County, North Carolina, where it produced a brief, weak tornado in the Scaly Mountain community. The fourth supercell moved along the Blue Ridge and then across the northern foothills of North Carolina, eventually producing tornadoes southeast of Lenoir in Caldwell County, North Carolina, and west of Taylorsville in Alexander County, North Carolina. The damage from both tornadoes was rated at EF1 intensity. 
Figure 4.  At least five tornadoes tracked across northeast Georgia and western
North Carolina on 27-28 April 2011.  The color of the line shows the intensity
of the tornado.  Click on image to enlarge.
All five tornadoes occurred with a Tornado Watch in effect. The first tornado had no warning in effect, but the other four had a Tornado Warning. The average initial lead time was 17.8 minutes and the average event lead time was 22.6 minutes.
3. Synoptic and Pre-Storm Environment
The synoptic weather pattern was highly conducive to an outbreak of severe
thunderstorms over the Southeast on 27-28 April.  A high amplitude upper trough
at 500 mb was situated over the Plains at 1200 UTC on 27 April, with a short
wave trough evident over Oklahoma and Texas (Fig. 5).  A mid-level jet streak
of 80-90 kt was rounding the base of the trough over the southern Plains.  A
similar arrangement was noted at 700 mb, with a 70 kt wind observation over
north Texas (Fig. 6).  Water vapor satellite imagery showed evidence of the
strong mid-level winds moving with the short wave as the area of relatively
dry air over Texas, Louisiana, and southwest Mississippi (Fig. 7).  At 850 mb,
a 50 kt low level jet over the area from Louisiana to Georgia advected warm,
moist air northward from the Gulf of America (Fig. 8).  Morning upper air
observations over the Southeast showed a capping inversion around 800-850 mb
and steep mid-level lapse rates from the remnants of an elevated mixed layer.
At the surface, a broad warm sector covered the entire Southeast and Carolinas
ahead of a quasi-stationary front stretched across east Texas and Arkansas
(Fig. 9).  The updated Day 1 Convective Outlook issued at 1300 UTC maintained
the threat for severe thunderstorms and tornadoes over the western Carolinas
and northeast Georgia.
Click here to view a 25 frame loop of GOES-13 water vapor channel satellite imagery from 1145 UTC on 27 April to 1145 UTC on 28 April 2011. 
Figure 5. SPC objective analysis of 500 mb geopotential height (dm; dark gray contours), temperature (oC; dashed red contours), and wind (kt; barbs) at 1200 UTC on 27 April 2011. Click on image to enlarge. 
Figure 6. SPC objective analysis of 700 mb geopotential height (dm; dark gray contours), temperature (0C; dashed red contours), dewpoint (0C greater than or equal to -4; green contours), and wind (kt; blue barbs) at 1200 UTC on 27 April 2011. Click on image to enlarge. 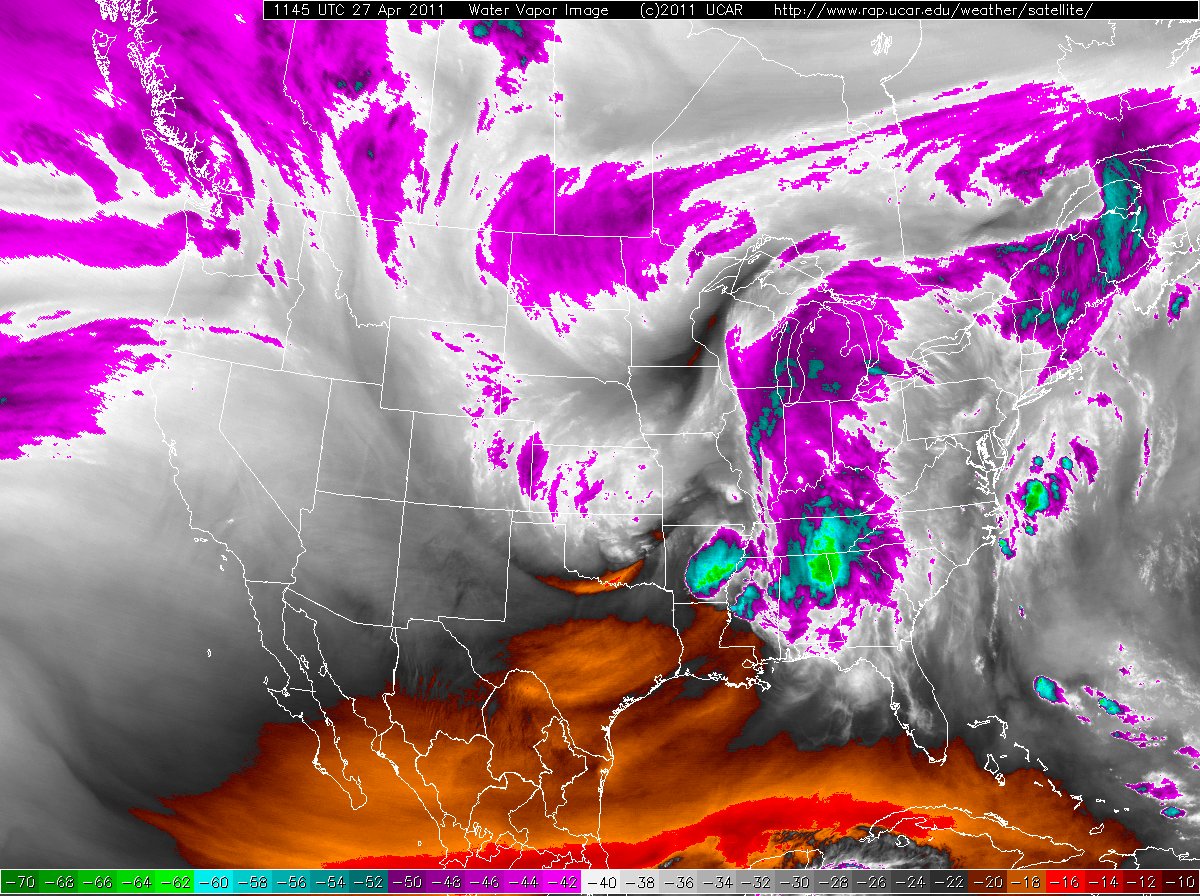
Figure 7.  GOES-13 water vapor satellite imagery at 1145 UTC on 27 April 2011.
Brightness temperatures are given by the color scale at the bottom of the figure.
Click on image to enlarge.
Figure 8. SPC objective analysis of 850 mb geopotential height (dm; dark gray contours), temperature (oC; dashed red contours), dewpoint (greater than 8 oC; green contours), and wind (kt; barbs) at 1200 UTC on 27 April 2011. Click on image to enlarge. 
Figure 9.  Hydrometeorological Prediction Center (HPC) surface analysis of
sea level pressure (mb; black contours) and fronts (traditional symbols) at
1200 UTC on 27 April 2011.  Click on image to enlarge.
An initial squall line weakened during the middle part of the morning over eastern Tennessee and eastern Kentucky. Debris cloudiness from that system helped to suppress deep convection across the mountains and foothills of the Carolinas through the middle part of the day, although a few storms managed to form on the eastern edge of the cloud boundary over the western Piedmont of North Carolina. These storms did not become severe until after leaving the GSP forecast area. Meanwhile, partial clearing over northern Alabama, northwestern Georgia, and Tennessee allowed for rapid destabilization as dewpoints in the upper 60s and lower 70s allowed surface-based parcels to break the cap. The 1630 UTC update to the Day 1 Convective Outlook did not change the threat for the western Carolinas. Special upper air soundings taken at 1800 UTC at Birmingham, Alabama, and Peachtree City, Georgia (Fig. 10), showed moderate to high instability in part due to relatively steep lapse rates from about 700 mb to 400 mb and strong shear indicated by long curving hodographs. This led to another refinement of the Day 1 Convective Outlook at 1911 UTC. An initial wave of severe thunderstorms moved northeast up the Great Valley of eastern Tennessee through the late afternoon without affecting the mountains of North Carolina, perhaps due to a relative lack of buoyancy. However, during the early evening, several tornadic supercells moving across northern Alabama and southeast Tennessee into an environment with improving shear prompted the SPC to issue a "Particularly Dangerous Situation" Tornado Watch (#241) for northeast Georgia and most of the western Carolinas. Click here to view a 14 frame loop of GOES-13 visible satellite imagery from 1045 UTC to 2333 UTC on 27 April 2011. Click here to view a 16 frame loop of a composite reflectivity mosaic from 0900 UTC to 2358 UTC on 27 April 2011. 
Figure 10.  Skew-T, log P, diagram and hodograph for the upper air observation
taken at Peachtree City, Georgia (FFC), at 1800 UTC on 27 April 2011.  The
temperature sounding is shown by the red line, the dewpoint sounding is
shown by the green line, and the hypothetical path of a parcel lifted from
the most unstable layer is shown by the brown dashed line.  A table of
convective parameters is given at the bottom.  Click on image to enlarge.
By 2200 UTC on 27 April, it was already clear that a remarkable event was well underway across the Southeast with numerous tornadic supercells over parts of Alabama and Tennessee, although the western Carolinas and northeast Georgia had not been affected at that time. At 0000 UTC on 28 April 2011, a short wave trough was analyzed at 500 mb from southern Missouri to the Arklatex Region, with a strong mid-level jet streak of at least 90 kt lifting out from the trough axis northeastward across the Tennessee Valley (Fig. 11). Similar features were noted at 700 mb. Meanwhile, a southerly low level jet of 40-60 kt was observed at 850 mb across Alabama and western Georgia to the Tennessee Valley (Fig. 12). The upper air sounding taken at Peachtree City, Georgia (FFC), was representative of the environment immediately ahead of the supercells moving northeast from Alabama (Fig. 13). The sounding was moderately buoyant with a convective available potential energy (CAPE) of 2100 J kg-1 but with a relatively dry boundary layer as compared to locations to the west. The surface dewpoint was only 62 oF which resulted in a lifting condensation level (LCL) of greater than 1200 m and limited CAPE below about 600 mb. Storm relative helicity (SRH) of greater than 250 m2s-2 in the surface to 1 km layer and around 400 m2s-2 in the surface to 3 km layer was highly supportive of the development and maintenance of supercell thunderstorms. The surface front moved east as a cold front and stretched from south to north across Mississippi to western Tennessee and western Kentucky (Fig. 14). Surface observations showed two plumes of moisture: one along the Georgia coast and the eastern half of the Carolinas, and the other from the Gulf Coast northward across Alabama. In between the two plumes, a relatively dry patch of air was located from central and northeast Georgia to Upstate South Carolina and the foothills of North Carolina. Again, no change was made to the severe weather risk for the western Carolinas and northeast Georgia when the Day 1 Convective Outlook was updated at 0050 UTC on 28 April. 
Figure 11. As in Fig. 5, except for 0000 UTC on 28 April 2011. Click on image to enlarge. 
Figure 12. As in Fig. 8, except for 0000 UTC on 28 April 2011. Click on image to enlarge. 
Figure 13. As in Fig. 10, except for 0000 UTC on 18 April 2011. Click on image to enlarge. 
Figure 14.  As in Fig. 9, except for 0000 UTC on 28 April 2011.  Click on
image to enlarge.
The objective mesoanalysis from the Storm Prediction Center (SPC) at 0200 UTC on 28 April highlighted the effects of the relatively dry air near the surface (Fig. 15), which by this time remained across northeast Georgia and the western part of the Carolinas. A plume of higher dewpoint was evident across the eastern half of the Carolinas in the southerly flow off the Atlantic, while moisture also surged north across Alabama, western Georgia, and southeastern Tennessee ahead of the frontal zone. In between, the dewpoints were only in the upper 50s to lower 60s from northeast Tennessee to east central Georgia. The surface based CAPE analysis showed a minimum of less than 500 J kg-1 across this zone (Fig. 16). The three-hour change in surface based CAPE was negative, indicating no increase in instability even though a very active surface boundary was approaching from the west. The SRH in the surface to 3 km layer was extremely high and greater than 500 m2s-2 across the western Carolinas and north Georgia, with modest increases in the previous three hours. The 100 mb mean LCL height showed an area greater than 1250 m covering much of northeast and east central Georgia and Upstate South Carolina (Fig. 17). The energy-helicity index, supercell composite parameter, and significant tornado parameter indices all showed a minimum in the zone from northeast Tennessee to east central Georgia. As a result, the supercellular convection across north central Georgia faced a more hostile environment as it moved northeast. 
Figure 15. Surface fronts analysis and SPC objective mesoanalysis of surface temperature (oF; red contours), surface dewpoint (oF; dashed blue contours and color fill > 56), wind (kt; barbs), and mean sea level pressure (mb; black contours) at 0200 UTC on 28 April. Click on image to enlarge. 
Figure 16. SPC objective mesoanalysis at 0200 UTC on 28 April 2011 of (a) surface based CAPE (J kg-1; orange contours), surface based convective inhibition (CIN, J kg-1; dashed blue contours and color fill), (b) 3 hour SBCAPE change (J kg-1; solid red contours positive and dashed blue contours negative) and SBCIN (J kg-1; color fill), (c) 0-3 km SRH (m2s-2; blue contours) and storm motion (kt; brown barbs), and (d) 3 hour 0-3 km SRH change (m2s-2; solid red contours positive and dashed blue contours negative) and current storm motion estimate (kt; brown barbs). Click on image to enlarge. 
Figure 17.  SPC objective mesoanalysis at 0200 UTC on 28 April 2011 of
(a) 100 mb mean parcel LCL (m AGL, contours), (b) 3 km energy-helicity index
(solid contours greater than 1, dashed contours less than 1), (c) supercell
composite parameter (solid contours greater than 1, negative contours less
than 1) and Bunkers storm motion (kt; barbs), and (d) significant tornado
parameter (solid contours greater than 1, negative contours less than 1)
and mixed layer CIN (J kg-1; color fill).  Click on image to enlarge.
4. Radar Observations
Through 0230 UTC on 28 April, two supercells were being closely monitored for potential impact on western North Carolina and northeast Georgia (Fig. 18). The first supercell was moving northeast across the easternmost counties of Tennessee while the second supercell was moving across north Georgia. A third "supercell of interest" was located over north central Georgia and was on course for the GSP CWA. 
Figure 18.  Composite reflectivity mosaic centered on GSP at 0157 UTC on
28 April 2011.  Click on image to enlarge.
a. The NW Madison County Tornado The first supercell moved northeast across the eastern-most counties of Tennessee in the early part of the evening, then reorganized over Cocke County around 0230 UTC on 28 April. The center of a broad mesocyclone was on track to move west of the western tip of Madison County, North Carolina, to the northwest of Hot Springs. Two brief tornadoes touched down in southern Cocke County: near Hartford at 0230 UTC, and near Del Rio at 0238 UTC. Both tornadoes were unknown at the time, but WFO Morristown (KMRX) had a Tornado Warning for that part of Cocke County adjacent to Madison County valid until 0300 UTC. While the main mesocyclone strengthened as it moved past Madison County, a smaller low-level circulation developed by 0242 UTC about three miles north of Round Mountain along what appeared to be a rear flank downdraft (Fig. 19). This weaker feature moved across the extreme northwestern part of Madison County between 0242 UTC and 0251 UTC. Maximum rotational shear quickly climbed above 0.020 s-1 and peaked at 0.031 s-1 over northwest Madison County at 0247 UTC on the 0.5 degree scan from the KMRX radar (Fig. 20). A tornado touched down four miles northwest of Hot Springs, and just one-half mile east of the state line, at approximately 0247 UTC. The tornado felled and snapped numerous trees in multiple directions and damaged three outbuildings along a path 50 yards wide and 100 yards long. The damage was rated at EF0 on the Enhanced Fujita Scale. An additional swath of straight line wind damage was noted to the south of the tornado track. Click here to view a 10 frame loop of reflectivity on the 0.5 degree scan from the KMRX radar from 0215 UTC to 0256 UTC on 28 April 2011. Click here to view an 8 frame loop of storm relative motion on the 0.5 degree scan from the KMRX radar from 0215 UTC to 0256 UTC on 28 April 2011. 
Figure 19. KMRX 0.5 degree scan of (a) base reflectivity and (b) storm relative motion at 0242 UTC on 28 April 2011. The yellow �X� denotes the location where the brief tornado touched down in western Madison County at 0247 UTC. Click on image to enlarge. 
Figure 20.  Rotational Velocity (solid lines) and rotational shear (dashed
lines) calculated from the 0.5 degree scan of the KMRX radar from 0224 UTC to
0310 UTC for the Cocke - NW Madison County mesocyclone (red) and the Greene
County mesocyclone (blue).  The light red shaded area corresponds to the time
the NW Madison tornado was on the ground, while the light blue shaded area
corresponds to the time the tornado was on the ground across Greene County,
Tennessee, including the Camp Creek area.  Click on image to enlarge.
b. The Lumpkin - White - Rabun County Tornado The second supercell actually began in east central Mississippi during the early part of the afternoon, and then grew to monstrous proportions over central Alabama in the early evening (Fig. 21). This supercell spawned the deadly Tuscaloosa and Pleasant Grove tornadoes before moving into north Georgia after 0000 UTC on 28 April. At least two more significant tornadoes were produced as this long-lived supercell tracked steadily across north central Georgia on a line from Polk and Floyd counties at 0045 UTC to northern Lumpkin County at 0230 UTC. As the storm approached northeast Georgia, it retained its classic structure with a hook echo, bounded weak echo region (BWER), and very strong mesocyclone (Figs. 22 and 23). Although it was not known at the time, tornadogenesis occurred over northeast Lumpkin County at 0230 UTC. At that time, maximum rotational velocity peaked at 72.5 kt and shear peaked at 0.054 s-1 (Fig. 24). Both values were well within the range for a strong mesocyclone with a tornado likely, and would remain that way for the next 48 minutes while the tornado remained on the ground. Click here to view a 21 frame loop of reflectivity on the 0.5 degree scan from the KGSP radar from 0201 UTC to 0331 UTC on 28 April 2011. Click here to view a 21 frame loop of storm relative motion on the 0.5 degree scan from the KGSP radar from 0201 UTC to 0331 UTC on 28 April 2011. 
Figure 21. Evolution of 0.5 degree reflectivity for the central Alabama - north central Georgia supercell. Snapshots are approximately every 30 minutes from 1940 UTC on 27 April to 0340 UTC on 28 April. Image courtesy of Brian Tang, National Center for Atmospheric Research. 
Figure 22. KGSP base reflectivity at 0230 UTC on 28 April for (a) 0.5 degrees, (b) 0.9 degrees, (c) 1.3 degrees, and (d) 2.4 degrees. The county names are shown in the lower right panel, where R and H correspond to Rabun and Habersham counties. Click on image to enlarge. 
Figure 23. As in Fig. 22, except for storm relative motion. The red shades represent motion away from the radar, located to the right side of each panel, while green and blue shades represent motion toward the radar. The purple areas are ambiguous because of range folded data. Click on image to enlarge. 
Figure 24.  Maximum rotational velocity and rotational shear on the lowest
three elevation scans from the KGSP, KMRX, and KFFC radars for the Lumpkin -
White - Rabun mesocyclone from 0148 UTC to 0340 UTC on 28 April.  The large
pink shaded area represents the time the tornado was on the ground.  The
tornado moved across the Lake Burton (Rabun County) area around 0300 UTC.
Click on image to enlarge.
The tornado moved over a remote part of northern White County over the next 20 minutes and then crossed the county line into extreme northwest Habersham County around 0252 UTC. The tornado proceeded to move across the remote terrain near Goshen Mountain and tracked across the northern part of Goshen Mountain Road, damaging eight homes. A concentrated path of extensive tree damage was noted by an aerial survey. The tornado moved into Rabun County around 0256 UTC and struck the Lake Burton area around 0300 UTC. The 0301 UTC volume scan continued to show a well-developed hook echo and BWER in the base reflectivity, as well as a very strong mesocyclone in the storm relative motion (Figs. 25 and 26). The lowest elevation scan showed a cyclonically convergent signature with a maximum of 70 kt outbound adjacent to 76 kt inbound. Several well-constructed homes were completely destroyed along Meeting House Mountain Road, including one that was removed from a slab foundation and thrown into the lake. Two fatalities occurred in that area. At one point, all vegetation was scoured down to bare earth. The damage path was a half mile wide. An apparent debris ball was evident in the base reflectivity on the 0.5 degree scan at 0310 UTC, halfway between Lake Burton and Mountain City, Georgia (Figs. 27 and 28). If true, it would be the first tornado debris signature observed on the KGSP radar. The tornado weakened as it moved northeast of the lake and over Black Rock Mountain State Park. It crossed the west and north side of Mountain City and then lifted east of U.S. Highway 441 on the side of Oakey Mountain around 0318 UTC. The supercell weakened quickly as it moved into southeast Macon County, North Carolina. The higher terrain of the Balsam Mountains appeared to rip apart the storm across southern Jackson County, North Carolina, after 0330 UTC. 
Figure 25. As in Fig. 22, except for 0301 UTC. The location of Lake Burton is to the upper left corner of the "LB" in the upper left image at the leading edge of the hook echo. The BWER is indicated in the upper right image. Click on image to enlarge. 
Figure 26. As in Fig. 23, except for 0301 UTC. Click on image to enlarge. 
Figure 27. As in Fig. 22, except for 0310 UTC. The location of the debris ball is indicated in the upper left panel, which corresponds to the 0.5 degree scan. Click on image to enlarge. 
Figure 28. As in Fig. 23, except for 0310 UTC. Click on image to enlarge. c. The Scaly Mountain Tornado The third supercell moved along a nearly identical path compared to the previous supercell, but about 90 minutes later and a few miles displaced to the north. As the previous supercell continued to weaken over the Balsams between 0330 UTC and 0400 UTC, the next supercell approached Rabun County (Fig. 29). A visual inspection of reflectivity features at 0352 UTC suggested much weaker organization, although the supercell contained an inflow notch on the lowest elevation scan, a weak echo region, and a long- lived radar-defined mesocyclone (Figs. 30 and 31). Cyclonic rotation was clearly discernible on the lowest four elevation scans, although relatively broad with a diameter greater than 3.0 nm on all scans. The rotational velocity was in the 35 kt to 40 kt range at a distance of greater than 70 nm, which placed the circulation in the "moderate mesocyclone" area of the mesocyclone recognition nomogram. However, the broad diameter resulted in relatively weak shear, which placed the storm in the "minimal mesocyclone" area of the rotational shear nomogram. Click here to view a 21 frame loop of reflectivity on the 0.5 degree scan from the KGSP radar from 0331 UTC to 0500 UTC on 28 April 2011. Click here to view a 21 frame loop of storm relative motion on the 0.5 degree scan from the KGSP radar from 0331 UTC to 0500 UTC on 28 April 2011. 
Figure 29. Mosaic of 0.5 degree base reflectivity at 0400 UTC on 28 April. As in fig. 30, Supercell 1 was responsible for the NW Madison County tornado, supercell 2 produced the Lumpkin-White-Rabun tornado, supercell 3 produced the Scaly Mountain tornado, and supercell 4 ultimately produced both tornadoes over the North Carolina Foothills. Click on image to enlarge. 
Figure 30. Base reflectivity from the KGSP radar at (a) 0.5 degrees, (b) 0.9 degrees, (c) 1.3 degrees, and (d) 1.8 degrees, at 0352 UTC. Click on image to enlarge. 
Figure 31.  Storm relative motion from the KGSP radar at (a) 0.5 degrees,
(b) 0.9 degrees, (c) 1.3 degrees, and (d) 1.8 degrees, at 0352 UTC.  The
radar is located to the right of each image.  Warmer colors represent motion
away from the radar and cooler colors represent motion toward the radar.
Click on image to enlarge.
The supercell essentially maintained its intensity, albeit weak, while losing its supercell presentation on the 0.5 degree scan as it crossed northwest Rabun County and into southern Macon County through 0430 UTC (Figs. 32 and 33). The strongest reflectivity and rotational couplet crossed the area around Scaly Mountain, North Carolina, between 0430 UTC and 0434 UTC. A brief tornado touched down along Dryman Ridge Road off State Highway 106 at approximately 0430 UTC. One mobile home was flipped over and trees were knocked down and twisted along an intermittent path 200 yards long and 30 yards wide. The damage was rated at EF0 intensity. The rotational shear peaked at 0.011 s-1 on the 0434 UTC scan, which was in the lower range of the "tornado possible" area of the rotational shear nomogram. This supercell also died crossing the mountainous terrain of the Balsams after 0500 UTC. 
Figure 32. As in Fig. 30, except for 0430 UTC. Click on image to enlarge. 
Figure 33. As in Fig. 31, except for 0430 UTC. Click on image to enlarge. d. The North Carolina Foothills Tornadoes The fourth supercell lagged the third by about 15 minutes and moved along its southwest flank. This storm crossed into western Habersham County around 0430 UTC and then moved along the edge of the higher terrain across southeast Rabun County and northern Oconee County through the next half hour (Fig. 34). The storm remained relatively weak with rotational shear and velocity generally in the range of a minimal mesocyclone (Fig. 35). In fact, a mesocyclone was not identified in the KGSP radar data for several volume scans in a row from 0512 UTC to 0525 UTC. Around 0530 UTC, the bulk of the higher reflectivity associated with the supercell moved up the gap in the higher terrain between Lake Jocassee and Rosman, North Carolina (Fig. 36). The change in elevation was approximately 500 to 1000 feet. Meanwhile, the reflectivity associated with the hook-like appendage on the southwest flank of the supercell moved over the higher terrain of the Blue Ridge from Sassafras Mountain to Cedar Mountain, North Carolina, from 0529 UTC to 0550 UTC. The rotational velocity and shear increased as the supercell moved up the terrain, and peaked at 0550 UTC over southeastern Transylvania County (Figs. 37 and 38). Some weakening was noted as the supercell moved down the upper part of the French Broad River basin past Brevard and the low level mesocyclone crossed the Dupont State Forest and into southwestern Henderson County through 0559 UTC. However, a rapid increase in rotational shear occurred as the entire supercell moved across the relatively smoother terrain near Hendersonville. Another peak in low level rotational velocity and shear was noted at 0611 UTC to the east of East Flat Rock (Figs. 39 and 40). A public report of a funnel cloud was received from the area southeast of Hendersonville, but no damage was reported until the storm passed Edneyville, where some tree and power line damage was noted. Subsequent weakening occurred again as the storm moved over the higher terrain of eastern Henderson County and western Rutherford County through about 0630 UTC. The storm moved off the Blue Ridge and over southern McDowell County from 0630 UTC to 0645 UTC. During the prior 75 minutes as the storm ascended and descended the higher terrain, it retained its supercell characteristics with a low level reflectivity appendage and inflow notch, weak echo region, and low- to mid-level mesocyclone. Click here to view an 18 frame loop of reflectivity on the 0.5 degree scan from the KGSP radar from 0632 UTC to 0744 UTC on 28 April 2011. Click here to view an 18 frame loop of storm relative motion on the 0.5 degree scan from the KGSP radar from 0632 UTC to 0744 UTC on 28 April 2011. 
Figure 34. As in Fig. 30, except for 0500 UTC. Click on image to enlarge. 
Figure 35. KGSP 0.5 degree maximum rotational velocity and shear for the Blue Ridge supercell from 0422 UTC to 0801 UTC. The pink shaded areas represent the time of the Eastern Caldwell tornado and the Ellendale tornado. Click on image to enlarge. 
Figure 36. KGSP base reflectivity on the 0.5 degree scan (a) at 0529 UTC and topography grid (b). The track of the Blue Ridge supercell (labeled as "Storm B9") is shown as the black line with a dot placed at the reflectivity centroid for the previous volume scans. The black line with the "+" markings is the projected track of storm B9 determined by the storm cell and tracking algorithm. Click on image to enlarge. 
Figure 37. KGSP base reflectivity on the (a) 0.5 degree, (b) 0.9 degree, (c) 1.3 degree, and (d) 2.4 degree elevation scans at 0550 UTC on 28 April. Click on image to enlarge. 
Figure 38. KGSP storm relative motion on the (a) 0.5 degree, (b) 0.9 degree, (c) 1.3 degree, and (d) 2.4 degree elevation scans at 0550 UTC on 28 April. The KGSP radar is located off the bottom right corner of each image. Red and yellow shades represent motion away from the radar and green colors represent motion toward the radar. Click on image to enlarge. 
Figure 39. As in Fig. 37, except for 0611 UTC. Click on image to enlarge. 
Figure 40. As in Fig. 38, except for 0611 UTC. Click on image to enlarge. The supercell quickly regained a classic appearance as it moved across eastern McDowell County and into western Burke County through 0653 UTC, with the re-emergence of a hook echo and bounded weak echo region. Rotational shear soared from 0.0163 s-1 to 0.0532 s-1 and rotational velocity increased to 70 kt as the low level mesocyclone strengthened through the 0702 UTC scan (Figs 41 and 42). From that point onward, rotational shear remained in the "tornado likely" category of the rotational shear nomogram, and was "off the chart" through the 0735 UTC scan. The rotational shear reached a maximum of 0.0968 s-1 on the 0710 UTC scan and rotational velocity reached a maximum of 73.5 kt on the 0714 UTC scan as the supercell crossed the border into Caldwell County. 
Figure 41. As in Fig. 37, except for 0702 UTC. Click on image to enlarge. 
Figure 42. As in Fig. 38, except for 0702 UTC. Click on image to enlarge. Tornadogenesis occurred at approximately 0724 UTC about 3 miles north of Great Falls. The tornado was on the ground for 4.5 miles over eastern Caldwell County and lifted briefly at 0729 UTC. Numerous trees were blown down or snapped, outbuildings were destroyed, and structures incurred minor damage along its path. A double-wide manufactured home suffered significant damage near the location where the tornado lifted. Another tornado touched down in western Alexander County, about 3 miles southwest of Ellendale, at 0732 UTC. This tornado produced intermittent damage to trees and outbuildings until it reached the Ellendale community. From there, numerous structures were damaged and trees were uprooted along the remainder of the path. The tornado finally lifted around 0740 UTC. The damage from both tornadoes was rated at EF-1 intensity.
Discussion
Situational awareness was very high in the hours leading up to the event.
Forecasters were able to monitor the events through the media as they unfolded
over central Alabama and north Georgia throughout the evening.  However, it
was not entirely clear that the supercell approaching Rabun County around
0230 UTC on 28 April was in fact the same storm that decimated Tuscaloosa and
Pleasant Grove, Alabama.  An examination of the data from the Alabaster,
Alabama (KBMX), radar revealed that a merger of supercells occurred over
northeast Jefferson County and St. Clair County, Alabama, between 2315 UTC and
2345 UTC on 27 April.  During that time, the old mesocyclone weakened and a
new one formed, making it unclear as to whether or not it was the same storm.
Details about the nature of the severe weather associated with the supercell were sketchy as it moved across north central Georgia between 0100 UTC and 0230 UTC. The NWS office in Peachtree City, Georgia, sent several Local Storm Reports (LSR) between 0100 UTC and 0130 UTC for large hail (up to 1.75 inch diameter) and thunderstorm wind damage in Floyd and Bartow counties in Georgia. Additional reports of large hail and wind damage across Bartow, Pickens, and Cherokee counties were included in LSRs received between 0142 UTC and 0242 UTC. None of the LSRs indicated the damage was caused by a possible tornado. No other reports were received as the storm moved across the sparsely populated southern reaches of the Chattahoochee National Forest over Dawson, Lumpkin, and White counties. Between 0200 UTC and 0230 UTC, the supercell moved across the area nearly equidistant from the KGSP and KFFC radars. Furthermore, the area across Dawson and Lumpkin counties was plagued by range folding on both radars. As the storm approached Rabun County at 0230 UTC, it was moving into an environment that was increasingly unfavorable with less buoyancy and a higher LCL. Thus, there was no guarantee the supercell would produce another tornado as it moved into northwest Habersham County and Rabun County, much less a significant tornado. The KGSP radar operated in volume coverage pattern (VCP) 12 as the storm approached from the west in order to receive the most frequent updates. However, the supercell had to traverse a large area of range folding across north Georgia beyond the western border of Rabun and Habersham counties. The radar was switched to VCP 212 at 0245 UTC in an attempt to alleviate the excessive loss of velocity data. The change was successful in restoring the amount of useful velocity data, but resulted in poorer resolution of the reflectivity data. The radar was switched back to VCP 12 after the 0305 UTC scan. The supercell that crossed north Georgia into Rabun County and struck the Lake Burton area at 0300 UTC on 28 April was arguably the strongest supercell ever observed by the KGSP radar within the CWA since the WFO assumed forecast responsibility in October 1995 (Fig. 43). In fact, the next two strongest maximum rotational velocities were associated with the same mesocyclone, that of the Blue Ridge supercell that produced the Eastern Caldwell and Ellendale tornadoes later in the event. As a comparison to the next known strongest tornado, the Dudley Shoals EF4 of 7 May 1998 only had a maximum rotational velocity of just under 42 kt. At 0310 UTC, the KGSP radar showed a maximum outbound storm relative motion of 85 kt away from the radar and 78 kt toward the radar, although not along adjacent radials (Fig. 44). Meanwhile, a debris ball-like feature was apparent on the 0.5 degree reflectivity scan. The radar beam was approximately 6500 feet above mean sea level, or 4000 feet above ground level, at that point. This was the first debris ball observed on the KGSP radar. 
Figure 43. Maximum rotational velocity for the Lumpkin-White-Rabun mesocyclone observed by the KGSP, KFFC, and KMRX radars from 20 minutes prior to 20 minutes after tornadogenesis, corresponding to 0210 UTC to 0250 UTC on 28 April 2011. The zero point on the X-axis corresponds to the approximate moment of tornadogenesis over northeast Lumpkin County, Georgia, at 0230 UTC. The pink shaded area represents the tornado on the ground as it moved across White County and reached the border of Habersham County around 20 minutes after tornadogenesis. The points for other significant tornadoes within the GSP CWA correspond to the maximum calculated rotational velocity plotted relative to the time of tornadogenesis for that particular storm. The rotational velocity of the Lumpkin-White-Rabun mesocyclone reached another peak of 81.4 kt at 0310 UTC (about 40 minutes after tornadogenesis) when the storm was over Rabun County between Lake Burton and Mountain City, Georgia. Click on image to enlarge. 
Figure 44.  KGSP radar 0.5 degree (a) base reflectivity and (b) storm relative
motion at 0310 UTC on 28 April.  Click on image to enlarge.
Another remarkable feature of the Lumpkin-White-Rabun tornado was the complex terrain over which the tornado tracked (Fig. 45). An aerial survey showed a continuous path of extensive tree damage that climbed over four significant ridges and valleys with a relief of almost 2000 feet. The tornado crossed the valley of the Chestatee River shortly after touching down in Lumpkin County, and then moved along Bee Ridge before crossing over Cowrock Mountain and Wildcat Mountain, where the elevation exceeded 3500 feet above mean sea level. The tornado proceeded to cross the valley of the Chattahoochee River, then up and over the Hickorynut Ridge and Tray Mountain in White County. The track went across Lake Burton in Rabun County and then up and over Black Rock Mountain, followed by the valley of the Little Tennessee River, before ending on Oakey Mountain. 
Figure 45.  Approximate vertical profile of the track of the Lumpkin-White-
Rabun tornado from 0230 UTC to 0318 UTC on 28 April 2011.  The tornado crossed
four valleys from left to right (Chestatee River, Chattahoochee River, Lake
Burton, and Little Tennessee River) and three mountain ridges (Wildcat Mountain,
Hickorynut Ridge, and Black Rock Mountain).  Click on image to enlarge.
The first tornado in far western Madison County, 4.5 miles west of Hot Springs, was a missed event. The damage was associated with a high-end tornadic thunderstorm over Greene County, Tennessee, at the same time that another tornadic supercell was bearing down on Rabun County, Georgia. The primary mesocyclone stayed in Tennessee (producing a multiple-fatality tornado near Camp Creek), which prompted forecasters to refrain from warning issuance. However, the KMRX radar showed an appendage of the storm, likely associated with the rear flank downdraft (RFD), extending into Madison County. Although it was not known at the time, two brief tornadoes associated with the appendage occurred over Cocke County, Tennessee. There was also a secondary cyclonic circulation that passed over the damage area in Madison County near the tip of the appendage. Forecasters should be aware that the actual location of tornadoes is often displaced to the right (in a storm relative sense) of the cyclonic shear couplet in WSR-88D storm relative velocity data by a mile or more. Speheger and Smith (2006) determined the mean error distance between the tornado location and the radar-indicated circulation center was 0.6 miles when the radar was 20 to 50 miles away from the tornado. At that range, more than 50 percent of radar signatures had an error greater than one-half mile. Furthermore, the RFD associated with tornadic storms often produces damaging downbursts of 60 to 80 mph that can extend as much as 5 to 10 miles away from the main core (Justin Lane, personal observation). The KGSP radar provided a visual reminder of the potential error in tornado pathcasting as the Blue Ridge supercell produced the tornadoes over eastern Caldwell County and western Alexander County. The center point of the inbound/outbound couplet on the 0.5 degree storm relative motion scan was located between 1 to 1.5 miles north (left) of the track of the eastern Caldwell tornado (Fig. 46) during its lifetime. The center point of the velocity couplet was located closer to the spot where the Ellendale tornado began, but drifted about 1.3 miles to the right of the tornado track toward the end of its lifetime. Thus, forecasters should take into account the uncertainty of the position of a possible tornado on the ground when interpreting radar data. 
Figure 46.  KGSP storm relative motion on the 0.5 degree scan at (a) 0723 UTC,
(b) 0727 UTC, (c) 0731 UTC, and 0735 UTC.  The track of the eastern Caldwell
tornado is shown by the thick white line H-H' and the track of the Ellendale
tornado is shown as the thick white line E-E�.  The radar is located off the
lower left corner of each image.  The warmer colors represent motion away
from the radar and the cooler colors represent motion toward the radar.
Click on image to enlarge.
As bad as the events of 27-28 April 2011 were, with one significant killer EF3 tornado and one long-track (albeit small) tornadic supercell crossing the entire CWA, it could have been worse. It seems likely that the GSP CWA would have experienced a more widespread and devastating impact, especially the area along and south of Interstate 85, if not for the presence of the relatively dry surface air and unfavorable time of day. As it was, the supercells moving across central Georgia in the late evening congealed into a quasi-linear convective system after 0600 UTC, and no further severe weather was reported to the south of the track of the Blue Ridge supercell in the GSP CWA.
References
Changnon, S. A., Jr., and R. G. Semonin, 1966:  A great tornado disaster in
     retrospect.  Weatherwise, v. 19, n. 2, pp. 56-65.

Fujita, T., 1975: Super Outbreak of tornadoes of April 3�4, 1974.  Map printed
     by University of Chicago Press. [Available from Wind Science and
     Engineering Research Center, Texas Tech University, Lubbock, TX 79409.]

Speheger, D. A, and R. D. Smith, 2006:  On the imprecision of radar signature
     locations and storm path forecasts.  Nat. Wea. Dig., 30, pp. 3-10.
Acknowledgements
The author wishes to express his thanks to Brian Tang of the National Center for Atmospheric Research for sharing his montage of the Tuscaloosa - Birmingham supercell. The tornado track maps were created using Google Earth Pro 2010.The upper air analyses and sounding plots were obtained from the Storm Prediction Center. The surface analyses were obtained from the Hydrometeorological Prediction Center. Radar mosaics and satellite imagery were obtained from the University Corporation for Atmospheric Research. The radar loops from the TCLT radar were made using the NOAA Weather and Climate Toolkit. |


 Hourly Weather