
Scattered strong to severe thunderstorms may produce damaging winds, large hail, and a couple of tornadoes from east Texas through the lower Mississippi and Tennessee Valleys today and Wednesday. Late-season snow will continue over parts of the central Rockies including the Denver Metro into Wednesday. Read More >
|
The Heavy Snow of 29-30 January 2010
Author's Note: The following report has not been subjected to the scientific peer review process.
1. Introduction
A major winter storm affected portions of the southeastern United States
on the 29th and 30th of January 2010.  Heavy snow, along with sleet and
freezing rain, fell across much of western North Carolina and a small
part of Upstate South Carolina and extreme northeast Georgia (Fig. 1).
The storm also produced significant snowfall across the northern half of
North Carolina and the Tidewater region of Virginia.  The greatest snow
accumulations across the County Warning Area (CWA) of the National Weather
Service (NWS) office at the Greenville - Spartanburg Airport (GSP) extended
from just south of Asheville, North Carolina, east-northeast to Catawba,
Iredell, and Davie counties in North Carolina.  Observers at several
locations measured a foot of snow.  Rain was the predominant form of
precipitation over southern portions of the CWA.  The primary weather
features responsible for the wintry weather were a high pressure system
over the northeastern United States and a low pressure system that traveled
eastward across the Gulf Coast states, then northward along the coast of
the Carolinas where it moved out to sea.
Click here to view a summary of snowfall reports for the event.

Figure 1.  Storm total snow accumulation for 29 and 30 January 2010.
Click on image to enlarge.
2. Development
At 1200 UTC on 29 January 2010, the surface analysis from the
Hydrometeorological Prediction Center (HPC) showed a developing low
pressure system located near the Texas Gulf Coast (Fig. 2).  A high
pressure system was centered over the upper Mississippi River Valley.
A cold front extended from the Atlantic Ocean west through south Georgia
and the southern Gulf Coast states to the Texas low.  A 500 mb low was
over the Texas-New Mexico border (Fig. 3).  Clouds and precipitation
covered much of the lower Mississippi and Ohio river valleys west into
the southern Great Plains (Figs. 4 and 5).
Click here to view a 36 frame loop of GOES-12 water vapor satellite imagery from 1245 UTC on 29 January to 2345 UTC on 30 January. 
Figure 2. HPC Surface fronts and pressure analysis at 1200 UTC on 29 January 2010. Click on image to enlarge. 
Figure 3. Storm Prediction Center (SPC) objective analysis of 500 mb geopotential height (dm; dark gray contours), wind (kt; barbs), and temperature (degrees C; dashed red contours) at 1200 UTC on 29 January. Click on image to enlarge. 
Figure 4. GOES-12 infrared satellite image at 1215 UTC on 29 January. Cloud top temperatures are given by the color table in the upper left corner. Click on image to enlarge. 
Figure 5.  National radar reflectivity mosaic at 1208 UTC on 29 January.
Rain intensity is given by the color table on the right.  Click on image
to enlarge.
A look at several diagnostic charts from the North American Mesoscale (NAM) model (80 km horizontal grid spacing, hereafter referred to as the NAM-80) revealed why upward motion was occurring across the area from the Texas Gulf Coast to the mid-Mississippi Valley (Fig. 6):
1.  500 mb trough and cyclonic vorticity advection were approaching the
    surface trough over the western Gulf of America,
2.  Differential cyclonic vorticity advection (500-300 mb) was occurring
    east of the cutoff low,
3.  Divergence aloft (250 mb) and convergence near the surface (850 mb)
    were over eastern Texas and Oklahoma into the Lower Mississippi River
    valley,
4.  An axis of strong isentropic lift (e.g., 300K surface) extended along
    the Texas coast northeast through Arkansas to Tennessee and Kentucky,
5.  Frontogenetical forcing and upward motion existed in a deep layer from
    the surface near the Gulf Coast to approximately 400 mb over Oklahoma
    and Kansas, and
6.  Strong Q-vector convergence in the 500-250 mb layer extended from
    Oklahoma south through Texas
Figure 6.  Diagnostic charts from the NAM-80 model initial analysis at
1200 UTC on 29 January showing (a) 500 mb geopotential height (dm; green
contours), vorticity (10-5 s-1; dashed orange contours and color fill), and
mean sea level pressure (mb; blue contours), (b) 500-300 mb mean
geopotential height (dm; green contours) and differential vorticity
advection (10-9 s-1; tan contours and color fill), (c) 300 mb divergence
(10-5 s-1; color fill) and 1000 mb divergence (10-5 s-1; blue contours,
dashed negative), (d) 300 K isentropic analysis of pressure (mb, green
contours), wind (kt; barbs), and omega (microbars s-1; orange contours and
color fill, warm shades upward), (e) cross-section from South Dakota (left)
to the southern Gulf of America (right) showing frontogenesis (K m-1 x 10⁻¹⁰ s-1;
color fill), and omega (microbars s-1; tan contours), and (f) 500-250 mb
Q vectors (K m-2 x 10-12 s-1; light blue arrows) and divergence of Q
(K m-2 x 10-16 s-1; green contours (upward) and color fill (warm colors
upward)).  Click on each image to enlarge.
The divergence aloft and convergence near the surface were occurring in the right rear quadrant of an upper level wind maximum (170 kt at 300 mb) that extended from Missouri east through the northern mid-Atlantic states and offshore (Fig. 7). The upper level divergence and low level convergence were also just ahead of a smaller, but nonetheless strong (105 kt at 300 mb), wind maximum over southwest Texas. 
Figure 7.  SPC objective analysis of 300 mb wind (kt; barbs), isotachs (kt;
dark gray contours and color fill), streamlines (black contours), and
divergence (yellow contours) at 1200 UTC on 29 January.  Click on image to
enlarge.
Another cross-section view from the 80-km NAM model initialization at 1200 UTC, this time from the Gulf of America to North Dakota (Fig. 8), showed the vertical motion linked to the processes mentioned above. The potential temperature isotherms sloped upward toward the north through a deep layer of the atmosphere, the isotherms being analogous to surfaces along which air parcels moved in response to the southerly wind flow ahead of the trough over west Texas. The cross-section also depicted the upward motion (omega) and wind speed. On the 300K potential temperature surface (Fig. 6d), a vertical motion maximum over northern Louisiana and southern Arkansas coincided with the region where the highest wind speeds were ascending the steeply sloped 300K surface. 
Figure 8.  NAM-80 model initial analysis cross-section of potential
temperature (K; green contours), vertical motion (microbars s-1; white
contours (solid upward, dashed downward), and isotachs (kt; light blue
contours and color fill above 70 kt) from North Dakota (left) to the
southern Gulf of America (right) at 1200 UTC on 29 January.  Click on image
to enlarge.
3. Precipitation Expands
By 1800 UTC on 29 January, the surface low pressure system was consolidating over Louisiana (Fig. 9). The forcing for upward motion, depicted by the convergence of Q in the upper levels, had moved eastward just ahead of the trough (Fig. 10). The moist, confluent southwest wind flow ascending the 300K surface was a key factor in producing the prefrontal precipitation and the expanding rain shield over the lower Mississippi River valley. The eastward spread of precipitation from Oklahoma to Tennessee can be attributed to the forcing for upward motion provided by the frontogenesis in the 850-500 mb layer seen in Fig. 11. 
Figure 9. As in Fig. 2, except at 1800 UTC on 29 January. Click on image to enlarge. 
Figure 10. NAM-80 model initial analysis of 500-250 mb average geopotential height (dm; green contours), Q vectors (K m-2 x 10-12 sec-1; blue arrows), and divergence of Q (K m-2 x 10-16 sec-1; color fill, blue and purple indicate forcing for upward motion) at 1800 UTC on 29 January. Click on image to enlarge. 
Figure 11.  NAM-40 model initial analysis of 850-500 mb layer frontogenesis
(K m-1 x 10⁻¹⁰ sec-1; green contours and color fill) at 1800 UTC on 29 January.
Maximum values are dark green and orange.  Click on image to enlarge.
The high pressure system was still centered over Wisconsin at 1800 UTC, but a surface ridge extended southeast into Virginia and the Carolinas. A northeast surface wind indicated the dry, cold air over the mid-Atlantic states was spreading south, to the east of the Appalachians. Dewpoints were in the teens in Upstate South Carolina and much of central and western North Carolina (Table 1). Single digit dewpoints were common in Virginia. The low dew points in combination with dry bulb temperatures in the 30s and 40s indicated the potential existed for precipitation to lower the surface temperature to near, or below, freezing.
Table 1.  Surface temperature observations taken at selected sites across the
western Carolinas at 1800 UTC on 29 January 2010.
The subfreezing wet bulb temperatures at the Asheville Regional Airport (AVL) and Hickory Regional Airport (HKY) focused attention on the likelihood of freezing or frozen precipitation. The Charlotte-Douglas International Airport (CLT), GSP, and Anderson wet bulb temperatures were above freezing but sufficiently close to 32oF so that, absent cold advection, the height of the freezing level and the potential for cooling by melting snow would be critical in determining whether or not frozen precipitation reached the surface before completely melting. An examination of model soundings revealed the vertical temperature and moisture structure across the region in advance of the precipitation. The initial hour profiles from the 1800 UTC run of the NAM-80 model at AVL and HKY were quite dry, but a visual inspection showed the wet bulb temperature through the entire layer at both locations was subfreezing (Fig. 12). The wet bulb temperature on the CLT and GSP profiles (Fig. 13) was below freezing except at the surface. A northeast low-level wind associated with shallow cold air damming was seen in wind profiles at HKY, CLT, and GSP.  
Figure 12. NAM-80 initial analysis skew-T, log P diagram of temperature (right curve), dewpoint (left curve), and wind profile for Asheville (AVL; top) and Hickory (HKY; bottom) at 1800 UTC on 29 January. The zero degree Celsius isotherm is highlighted white. The vertical coordinate is pressure (mb). Click on images to enlarge.  
Figure 13.  NAM-80 initial analysis skew-T, log P diagram of temperature
(red curve), dewpoint (green curve), and wind speed and direction (lines and
numbers on the right) for Charlotte (CLT; left) and Greenville-Spartanburg
(GSP; right) at 1800 UTC on 29 January.  The zero degree Celsius isotherm
is highlighted white.  The vertical coordinate is thousands of feet.  Click
on images to enlarge.
Close examination of the 1800 UTC radar mosaic (Fig. 14) revealed a narrow eastward extension of the precipitation area from the Tennessee River valley to the western tip of North Carolina and Upstate South Carolina. The NWS Doppler radar at the Greenville - Spartanburg Regional Airport (the KGSP radar) provided a more detailed view (Fig. 15). At that time, precipitation in the form of snow had already started in the North Carolina-Georgia-South Carolina border area. Apparently, the near-surface, above-freezing temperature was decreased by cooling caused by melting snow. The rapid eastward spread and slow northward drift of snow in this narrow band can be seen in the KGSP radar displays from 1905 UTC, 2002 UTC, and 2105 UTC (Fig. 16). The small bands of enhanced reflectivity embedded within the larger ribbon of precipitation indicated rapid rates of precipitation. Indeed, a public report from south Asheville revealed 2.8 inches of snow fell between 2130 and 2230 UTC. Spotter reports elsewhere across the region documented the significant precipitation associated with the east-west oriented radar reflectivity maximum. At 2245 UTC, an 8.0 inch accumulation was reported about five miles north of Franklin in Macon County, North Carolina. Four miles west of Robbinsville in Graham County, North Carolina, at an elevation of 4,000 ft MSL, 6.0 inches of snow was measured at 2320 UTC. Click here to view a 13 frame loop of a regional reflectivity mosaic from 1158 UTC to 2359 UTC on 29 January. 
Figure 14. As in Fig. 5, except at 1808 UTC on 29 January. Click on image to enlarge. 
Figure 15.  KGSP composite reflectivity at 1802 UTC on 29 January.
Reflectivity values are given by the color table at the upper left.  Click
on image to enlarge.
Figure 16.  As in Fig. 15, except for 1905 UTC (left), 2002 UTC (center),
and 2105 (right) on 29 January.  Click on images to enlarge.
Light snow began at AVL at 1946 UTC when the surface temperature was 37oF. The snow became heavy and the temperature decreased to 32oF at 2008 UTC. Moderate to heavy snow continued for the next four hours, then the precipitation intensity became light. The snow changed to freezing rain and sleet during the early morning hours on Saturday, 30 January. As the band of enhanced radar reflectivity developed rapidly eastward across western North Carolina and Upstate South Carolina, snow spread into the southern Piedmont of North Carolina. Light snow reached CLT at 2047 UTC while the temperature was 39oF. The temperature dropped steadily, finally reaching the freezing mark at 2252 UTC. Snow continued at CLT, with a couple of interruptions, until 0723 UTC on 30 January when the precipitation became mixed with freezing rain and sleet. The rather narrow band of precipitation developed northward reaching HKY at 2143 UTC. Light snow became heavy at 2215 UTC and lasted for about an hour a half before once again becoming light in intensity. Light snow or sleet continued until approximately 1730 UTC the next day. The onset of heavy snow coincided with the presence of a small area of enhanced radar reflectivity. Careful examination of the composite reflectivity from the KGSP radar at 2230 UTC (Fig. 17) showed the highest reflectivity (indicated by the darkest shade of green) extending from Burke County, North Carolina, into Catawba County, North Carolina. Click below to view weather observations on 29 January 2010.
Table 2. Surface observations taken at selected sites across the western Carolinas during the calendar day of 29 January 2010. Click on the four-letter identifier to view the observations. 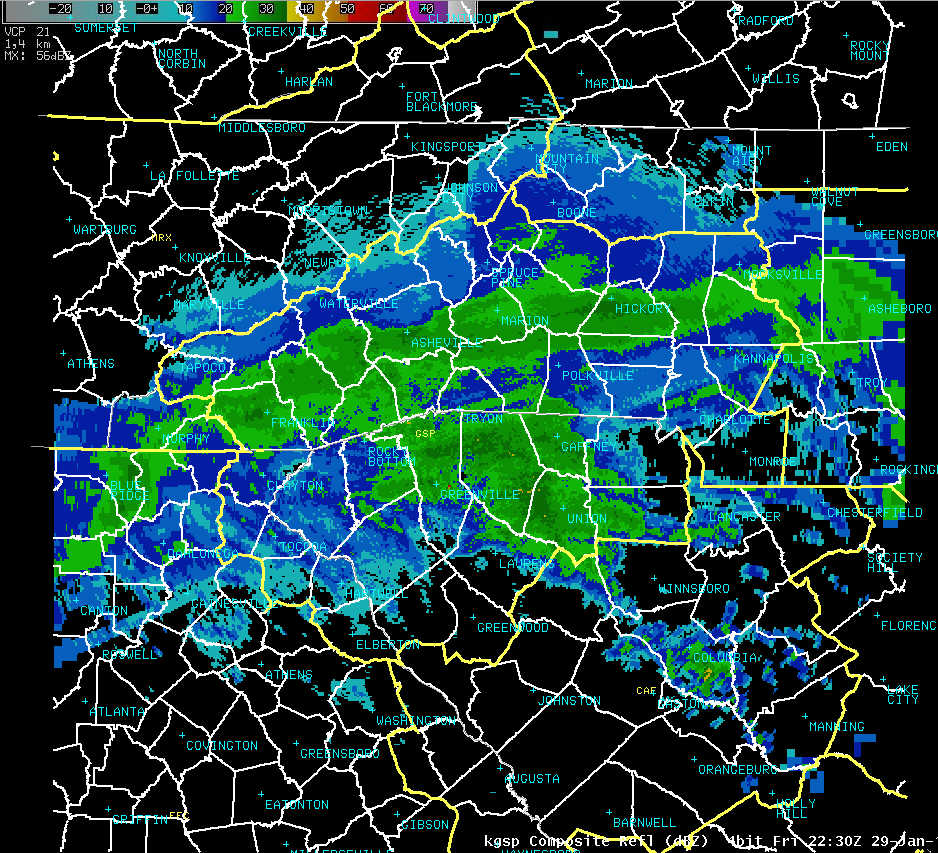
Figure 17.  As in Fig. 15, except for 2230 UTC on 29 January.  Click on
image to enlarge.
The vertically pointing MicroRain Radar (MRR) located at Newton in central Catawba County, operated by the Renaissance Computing Institute (RENCI), provided another interesting view of the heavy snow in the Hickory area. The onset of precipitation occurred with the rapid increase in reflectivity through a deep layer at approximately 2100 UTC (Fig. 18). The heavy snow was associated with even higher reflectivities detected at approximately 2230 UTC. Precipitation intensity decreased near 2330 UTC, but another period of heavy snow occurred at 0130 UTC on 30 January. The fall velocity, also in Fig. 18, showed precipitation particles were descending at around 2 ms-1 or less, values typically associated with snow.  
Figure 18.  Vertically pointing radar reflectivity (top) and fall velocity
(bottom) at Newton, North Carolina, at 1600 UTC on 29 January.  The values
are given by the color tables on the right.  The vertical coordinate is
feet above ground.  Click on images to enlarge.
Frontogenesis was the primary forcing mechanism that helped identify the reason for the narrow east-west band of precipitation. The NAM 700 mb frontogenetical forcing at 2100 UTC and 0000 UTC (Fig. 19) showed the strong southwest wind (greater than 60 knot over north Georgia) at 700 mb blowing nearly perpendicular to the tight temperature gradient. This tended to enhance the gradient even further thus producing the atmosphere�s response in the form of vertical motion along that boundary.
Figure 19.  NAM-80 model forecast of 700 mb frontogenesis (K m-1 x 10⁻¹⁰ s-1;
color fill), geopotential height (dm; green contours), and temperature
(degrees C; red contours) from the 1800 UTC 29 January cycle valid at
2100 UTC 29 January (left) and at 0000 UTC 30 January (right).  Click on
each image to enlarge.
The 2100 UTC composite reflectivity and the NAM 500 mb 3-hour forecast 500 mb omega pattern valid at 2100 UTC showed an areal distribution of precipitation that was very similar to the upward motion defined by the omega field (Fig. 20). As a matter of fact, the axis of highest reflectivity was nearly coincident with the axis of highest omega values. The cross-section from southeast Georgia to eastern Kentucky in Fig. 21 showed the upward motion was maximized over western North Carolina between 400 and 500 mb. The corresponding 3-hour NAM 310K isentropic forecast (Fig. 22) showed a narrow band of upward motion from southern Tennessee, east to north Georgia, and the western Carolinas. A 70 knot wind maximum on this isentropic surface where the slope was quite steep (corresponding to the tight temperature gradient on the 700 mb pressure surface) over north Georgia contributed to the upward motion maximum. The condensation pressure deficit (not shown) across the Southeast revealed that air parcels streaming northeastward did not reach saturation until arriving over the lower Tennessee River valley and southern Appalachians. The orientation of the isentropic surface along which the air parcels were ascending contributed to the east-west orientation of the major precipitation. 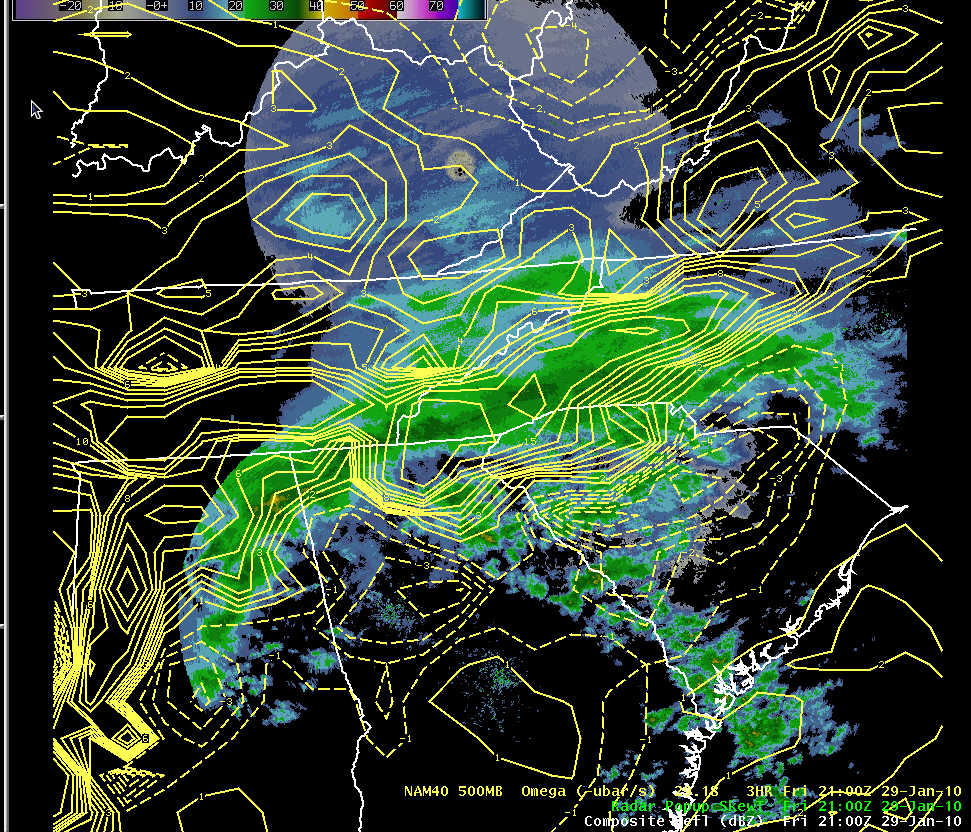
Figure 20. KGSP composite reflectivity (color fill, table at upper left) and NAM-80 three-hour forecast of omega (microbars s-1; yellow contours, solid lines denote upward motion) valid at 2100 UTC on 29 January. Click on image to enlarge. 
Figure 21. NAM-80 model forecast cross-section of potential temperature (K; green contours) and omega (microbars s-1; purple contours and color fill) from eastern Kentucky (left) to southeast Georgia (right) from the 1800 UTC model cycle valid at 2100 UTC on 29 January. Click on image to enlarge. 
Figure 22.  NAM-80 model forecast of omega (microbars s-1; color fill),
wind (kt; yellow barbs), wind speed (kt; orange contours), and pressure
(mb; green contours) on the 310K surface from the 1800 UTC model cycle
valid at 2100 UTC on 29 January.  Click on image to enlarge.
4. Warming Aloft and Mixed Precipitation
The pattern continued into the evening hours producing an extended period
of precipitation in central and western North Carolina.  Light snow occurred
across northern parts of Upstate South Carolina and northern counties in
western North Carolina, but the significant snowfall rates were limited to
the narrow region of frontogenetical forcing and strongest isentropic lift.
By 0000 UTC on 30 January, the 500 mb trough was over the Red River between Oklahoma and Texas and the surface low pressure system was over southeast Louisiana. The previously-referenced diagnostic tools displayed the following characteristics (not shown): 1. The differential cyclonic vorticity advection (300-500 mb) was maximized from the Mississippi River delta region across Mississippi to Alabama, 2. The upper level (250 mb) divergence maximum was nearly coincident with the low level (1000 mb) convergence maximum over southern Mississippi and Alabama, 3. The 310K isentropic analysis showed the omega maximum still oriented east-west across North Carolina (aligned with the frontogenetical forcing maximum), and another omega maximum over Alabama and Mississippi, apparently related to the forcing associated with upper level trough, 4. Frontogenetical forcing was maximized over the southern Appalachians, and 5. The upper-level (300-500 mb) forcing indicated by the convergence of Q was strongest from Missouri south to northern Louisiana. An interesting feature of the upper level divergence and low level convergence pattern was the lack of significant influence across the Carolinas where moderate to heavy snow occurred. This observation highlighted the importance of the mid-level frontogenetical forcing and resulting upward motion seen on the isentropic charts. The moderate to heavy snow that occurred in the Asheville area during the first six hours of the event became light, but continuous, as the heaviest precipitation in the frontogenetically-forced band moved east across the Piedmont. The cold air damming, although relatively weak, persisted and maintained a light northeast wind that kept the surface temperature near or below freezing across most of the area (Table 3).
Table 3.  Surface temperature observations taken at selected sites across the
western Carolinas at 0000 UTC on 30 January 2010.
An ensemble of the NAM model soundings at 0000 UTC at AVL, CLT, GSP, and HKY showed most stations were experiencing southwest winds above the surface-based cold layer where northeast winds predominated (Fig. 23). The exception was at AVL which had a southeast wind. Each temperature profile was subfreezing above the surface except at GSP (blue lines in the figure) where warm air advection near 850 mb had increased the temperature to +1 oC. In response to the warming, the light snow at GSP changed to sleet and freezing rain just before 0500 UTC. The mixed precipitation continued for the next 14 hours before changing to light snow prior to ending at 1900 UTC. Click below to view weather observations on 30 January 2010.
Table 4. Surface observations taken at selected sites across the western Carolinas during the calendar day of 30 January 2010. Click on the four-letter identifier to view the observations. 
Figure 23.  NAM-80 initial hour profiles of temperature, dewpoint, and wind
at HKY (light brown), GSP (blue), CLT (dark brown), and AVL (green) at
0000 UTC on 30 January.  Click on image to enlarge.
The surface low pressure system was over southern Alabama at 0600 UTC on 30 January. Precipitation was widespread, although the extreme southern portion of the CWA along with portions of central South Carolina and Georgia had less coverage (Fig. 24). The NAM six-hour 310 K isentropic forecast showed the maximum upward motion over east Tennessee and far western North Carolina.
Figure 24.  Regional mosaic of composite reflectivity at 0600 UTC on
30 January.  Click on image to enlarge.
Cold air damming was evident in the isotherm pattern along and to the east of the Appalachians on the 0600 UTC NAM 850 mb analysis (Fig. 25). However, one of the most significant features was the region of strong warm air advection from northern Alabama across north Georgia to Upstate South Carolina. The warm advection was the major factor in altering the vertical temperature structure so that the snow became mixed with and changed to sleet and freezing rain at nearly all observing sites during the overnight and morning hours on 30 January. 
Figure 25.  NAM-40 initial analysis of 850 mb geopotential height (dm;
green contours), temperature (C; red contours), and temperature advection
(C 12hr-1; color fill) at 0600 UTC on 30 January.  Click on image to enlarge.
The cold air damming that kept surface temperatures near or below freezing in combination with the warming aloft contributed to a common winter storm scenario across the western Carolinas in which snow becomes mixed with, or changes to, other forms of precipitation. During the period from 0000 UTC to 0600 UTC on 30 January, temperatures dropped at all sites, and fell below freezing at GSP and CLT (Table 4).
Table 5.  Surface temperature observations taken at selected sites across the
western Carolinas at 0600 UTC on 30 January.
5. Diminishing Precipitation
The 1200 UTC surface analysis placed the low pressure system over south
Georgia, but a weak wave was beginning to develop near the coast on the
warm front that stretched east over the Atlantic.  By this time, much
of the precipitation had moved east of the CWA (Fig. 26).  The NAM 310 K
isentropic analysis showed the strongest upward motion moving across
central and eastern North Carolina.  The wind flow on the 310K surface
across northeast Georgia and the western Carolinas was nearly parallel
to the pressure contours indicating virtually no upglide existed.
Click here to view a 19 frame Java loop of a regional reflectivity mosaic from 2359 UTC on 29 January to 1800 UTC on 30 January. 
Figure 26.  As in Fig. 24, except for 1200 UTC on 30 January.  Click on
image to enlarge.
The upper-level pattern also indicated the best forcing was moving away from the region. The NAM analysis in Fig. 27 showed the maximum upward motion at 500 mb had shifted eastward in the right rear quadrant of the 250 mb wind maximum south of Nova Scotia and ahead of the weaker wind maximum over the Gulf Coast. The divergence of Q in the 500-300 mb layer (Fig. 28) clearly indicated forcing for upward motion was along the East Coast and forcing for downward motion was moving into the central and southern Appalachians. 
Figure 27. NAM-80 initial analysis of 250 mb geopotential height (dm; green contours), isotachs (kt; blue contours), and 500 mb vertical motion (microbars sec-1; color fill, orange to red shades upward) at 1200 UTC on 30 January. Click on image to enlarge. 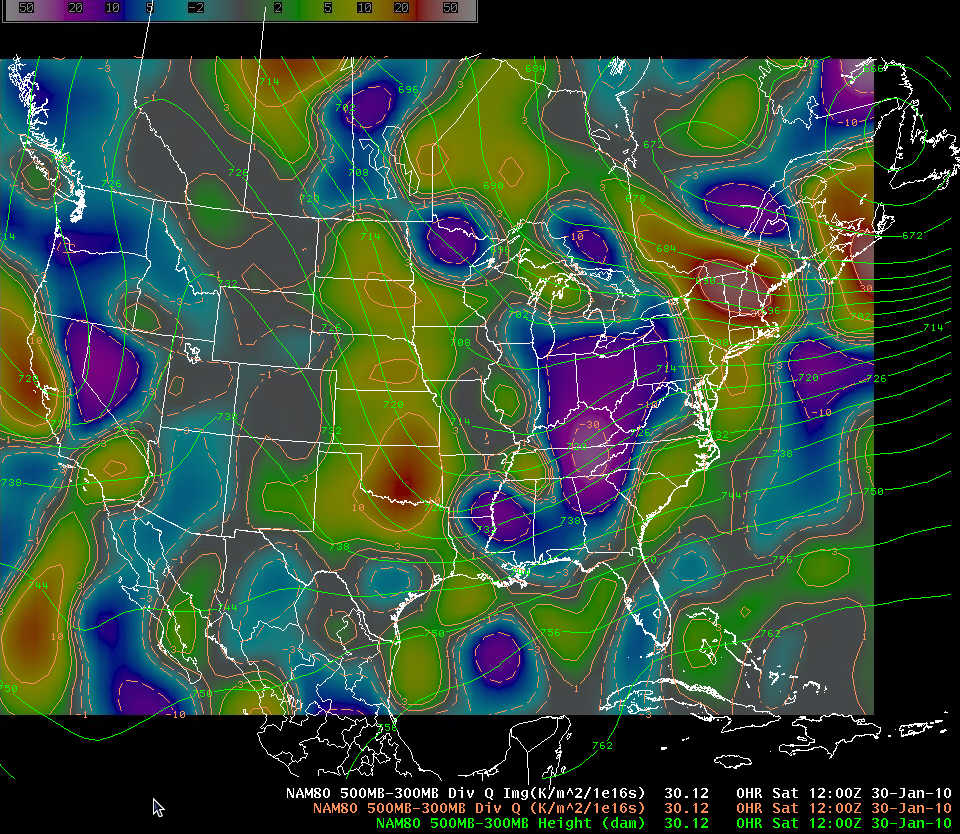
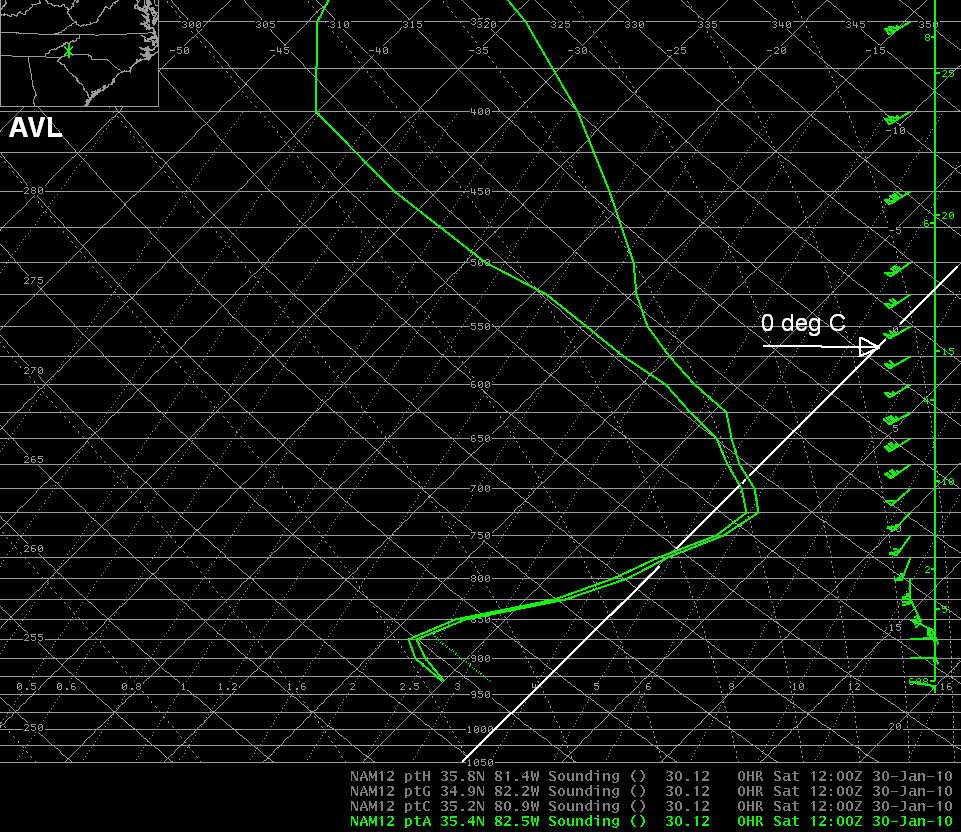
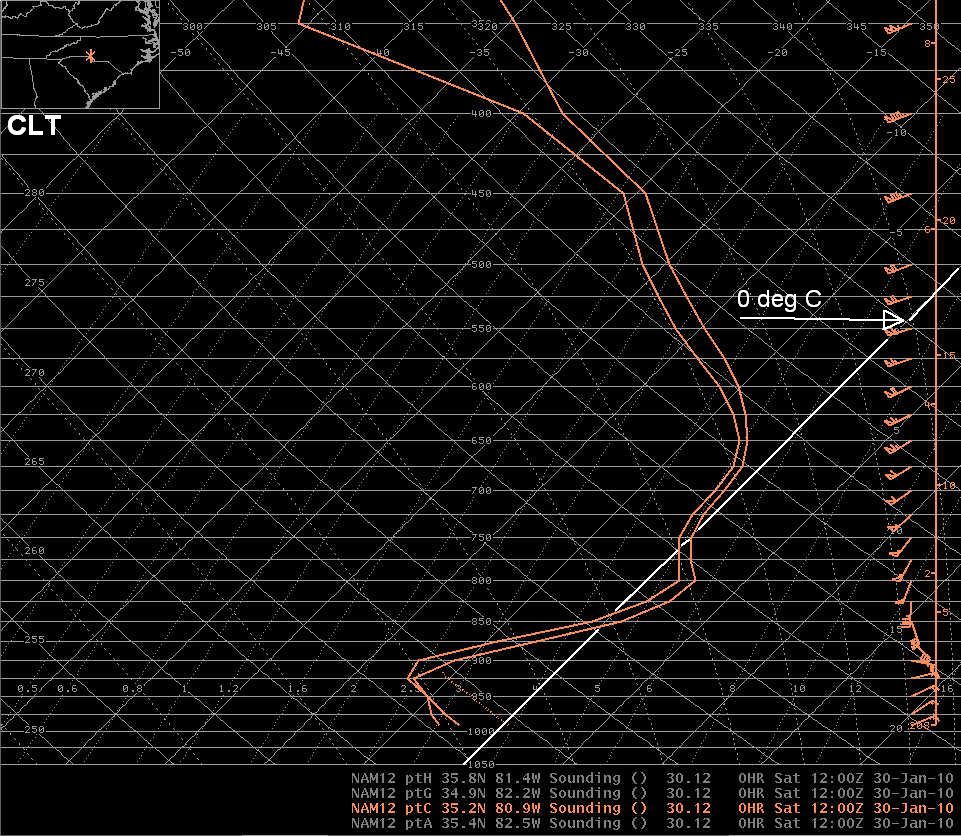
Figure 28.  NAM-80 initial analysis of 500-300 mb average geopotential
height (dm; green contours) and divergence of Q (K m-2 x 10-16 sec-1; color
fill, warm shades upward and cool shades downward) at 1200 UTC on 30 January.
Click on image to enlarge.
The 1200 UTC surface temperatures were freezing or below at all sites except in the extreme southern and far western portions of the CWA (Table 4). Even though surface temperatures were cold enough to support snow, many observations indicated sleet or freezing rain. The warm advection that was quite strong at 850 mb at 0600 UTC continued during the early morning hours and caused temperatures to rise above the melting point (except at HKY) in a layer that extended from approximately 4,000 to 10,000 feet above the surface. Vertical temperature profiles for AVL, CLT, GSP, and HKY confirmed the presence of the warm layer (Fig. 29).
Table 4.  Surface temperature observations taken at selected sites across the
western Carolinas at 1200 UTC on 30 January 2010.
Figure 29.  NAM-12 model initial hour profiles of temperature and dewpoint
for AVL (upper left), CLT (upper right), GSP (lower left), and HKY (lower
right) valid 1200 UTC 30 January.  Click on each image to enlarge.
Between 1200 and 1800 UTC, the precipitation rapidly diminished from west to east. By 1800 UTC, the surface pressure analysis displayed a complex organization consisting of several centers of low pressure extending from southeast Georgia to the vicinity of Cape Hatteras. The eastward progression of the upper-level trough and wind maxima caused the significant upward motion to shift offshore and toward the mid-Atlantic region where consolidation of the low pressure centers subsequently occurred.
6. Summary
The low pressure system that moved across the Gulf Coast states to the
Georgia and Carolina coast on the 29th and 30th of January 2010 resulted
in a major winter storm for western North Carolina and adjoining parts
of northeast Georgia and Upstate South Carolina.  Snowfall totals in
excess of a foot occurred in portions of the Mountains, Foothills, and
Piedmont of North Carolina.  The greatest accumulation was at Mills
River in Henderson County which is about three miles southwest of AVL.
The 12.0 inch accumulation at AVL made this the first winter season on
record that had two 10.0 inch or greater events in the Asheville area.
(The previous event was on 18 December 2009 when 10.1 inches fell.)  The
meteorological features of this event were typical of winter storms in
the southern Appalachian and Piedmont regions.  The low pressure system
traveled from the Gulf Coast to a position along the Carolina coast before
moving out to sea.  A high pressure system centered north of the area
contributed to a cold air damming event east of the Appalachians that
supplied subfreezing surface wet bulb temperatures for the CWA.  A strong
southwest wind near 850 mb eventually warmed the temperature profile so
that snow changed to sleet and freezing rain before the precipitation ended.
Acknowledgements
The snowfall accumulation map was created using ArcView GIS. The surface pressure and fronts analyses were obtained from the Hydrometeorological Prediction Center. The upper air analyses were obtained from the Storm Prediction Center. The regional reflectivity mosaics, water vapor imagery, and regional surface plots were obtained from the University Corporation for Atmospheric Research. The national radar mosaics and surface observations were obtained from the National Climatic Data Center. The Renaissance Computing Institute (RENCI) provided the images from the MicroRain Radar. |


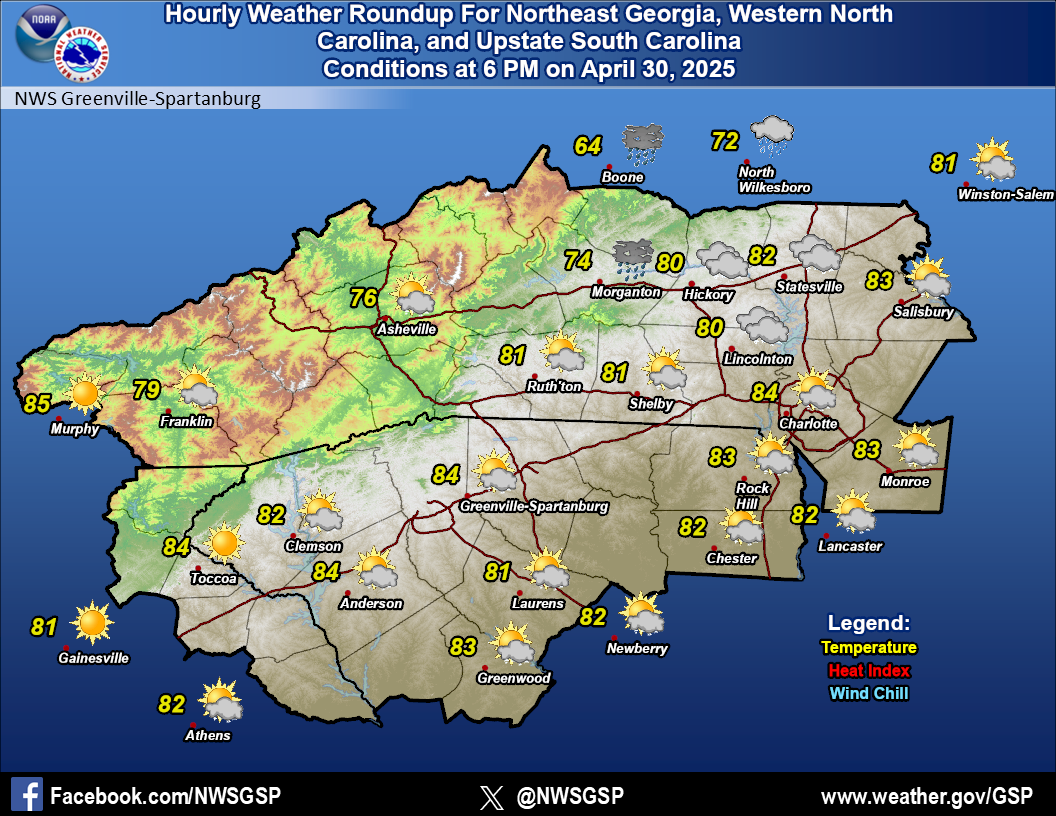 Hourly Weather