|
The 28 January 2014 All-Snow Event for the Western Carolinas and Northeast Georgia

Newly fallen snow on the ground at the Greenville - Spartanburg International Airport during the afternoon of 28 January 2014. 1. Introduction A significant winter precipitation event occurred across northeast Georgia and the western Carolinas on Tuesday, 28 January 2014, following the passage of a strong cold front late Monday, 27 January 2014. In the wake of the frontal passage, surface temperatures dropped approximately 30 degrees Fahrenheit in a 12-hour period through the early morning hours of 28 January, and then fell through the 20s during the day. Snow developed across north Georgia and spread across the County Warning Area (CWA) of the National Weather Service office at Greenville-Spartanburg (GSP), South Carolina, on 28 January, producing accumulations generally in the 1 to 3 inch (2 to 7 cm) range (Fig. 1). Click here to view a list of snowfall totals for this event. 
Fig. 1. Snowfall accumulation across the western Carolinas for the 24 hour period ending at 0500 UTC on 29 January 2014. Click on image to enlarge. Most winter precipitation events observed across the Piedmont of the Carolinas consist of multiple precipitation types. Keeter and Green (1977) determined that 52 percent of measurable frozen precipitation events at Charlotte, North Carolina, occurred with mixed precipitation. Moyer (2001) examined 183 winter precipitation events at GSP and discovered that 86 percent were a combination of two or more precipitation types. The 28 January event was notable in that snow was the only precipitation type observed at most locations across the CWA, except possibly for a period of rain at the onset across northeast Georgia and the Lakelands of South Carolina (Table 1). Even though accumulations on 28 January were relatively light (i.e., less than local Winter Storm Warning criteria), the impact on infrastructure and transportation was relatively significant. The same storm was responsible for paralyzing the Atlanta, Georgia, metropolitan area. Table 1. Surface observations taken at selected sites across the western Carolinas during the calendar day of 28 January 2014. Click on the four-letter identifier to view the observations. Click below to view weather observations on 28 January 2014.
2. Synoptic Features a. Aloft The upper air pattern across the continental United States consisted of a broad trough that encompassed most of the region east of the Rocky Mountains. Upper divergence associated with the right entrance region of a strong jet streak (greater than 150 kt) stretching from the upper Ohio Valley to the coast of New England at 300 mb was poised to move over the Carolinas at 1200 UTC on 28 January (Fig. 2). On the 500 mb analysis, a series of embedded short wave troughs denoted by 90 kt wind maxima over the northern Texas Panhandle and the Arklatex Region contributed to the deepening of the mean upper trough (Fig. 3). The core of the mid-level jet streak noted as the 90 kt wind observation at Shreveport, Louisiana, was expected to traverse north Georgia and the Carolinas during the day. 
Fig. 2. Storm Prediction Center (SPC) objective analysis of 300 mb wind (kt; barbs), isotachs (kt; blue contours and color fill), streamlines (gray contours), and divergence (s⁻¹ yellow contours) at 1200 UTC on 28 January 2014. Click on image to enlarge. 
Fig. 3. SPC objective analysis of 500 mb geopotential height (dm; dark gray contours), temperature (°C; dashed red contours), and wind (kt; barbs) at 1200 UTC on 28 January 2014. Click on image to enlarge. b. Surface As a result of the deepening upper trough, an Arctic air mass plunged southeastward from the northern Plains to the southeastern United States during 27-28 January. The leading edge of the arctic air mass was identified as a cold front that moved across the Appalachians during the late afternoon of 27 January to a position east of the Blue Ridge at 2100 UTC (Fig. 4). Temperatures ahead of the cold front were in the lower 60s across the southern Piedmont of North Carolina and Upstate South Carolina. The cold front moved off the southeast United States coast by 1200 UTC on 28 January (Fig. 5), with a weak low pressure system analyzed on the front east of Savannah, Georgia. During the overnight hours, temperatures dropped behind the front into the upper 20s to lower 30s across the Piedmont of the Carolinas. The significant drop in temperature over extreme northeast Georgia and the western Carolinas following the frontal passage was also evident by comparing the 925 mb (approximately 2,500 ft MSL) analyses at 2000 UTC on 27 January and 1500 UTC on 28 January (Fig. 6). Temperature changes of 10 to 15 degrees Celsius were common across north Georgia and the western Carolinas. 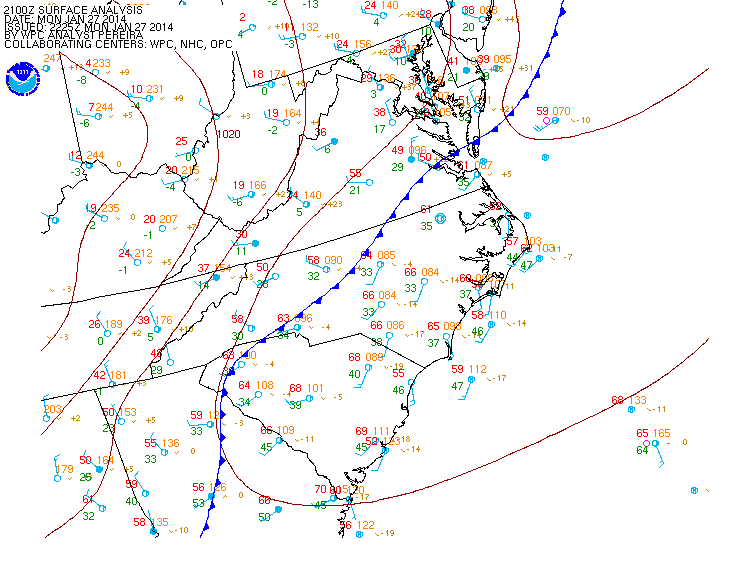
Fig. 4. Hydrometeorological Prediction Center (HPC) regional surface analysis of sea level pressure (mb; black contours) and fronts (traditional symbols) at 2100 UTC on 27 January 2014. Observations are indicated by the traditional station model plot. Click to enlarge. 
Fig. 5. As in Fig. 4, except for 1200 UTC on 28 January 2014. Click to enlarge. 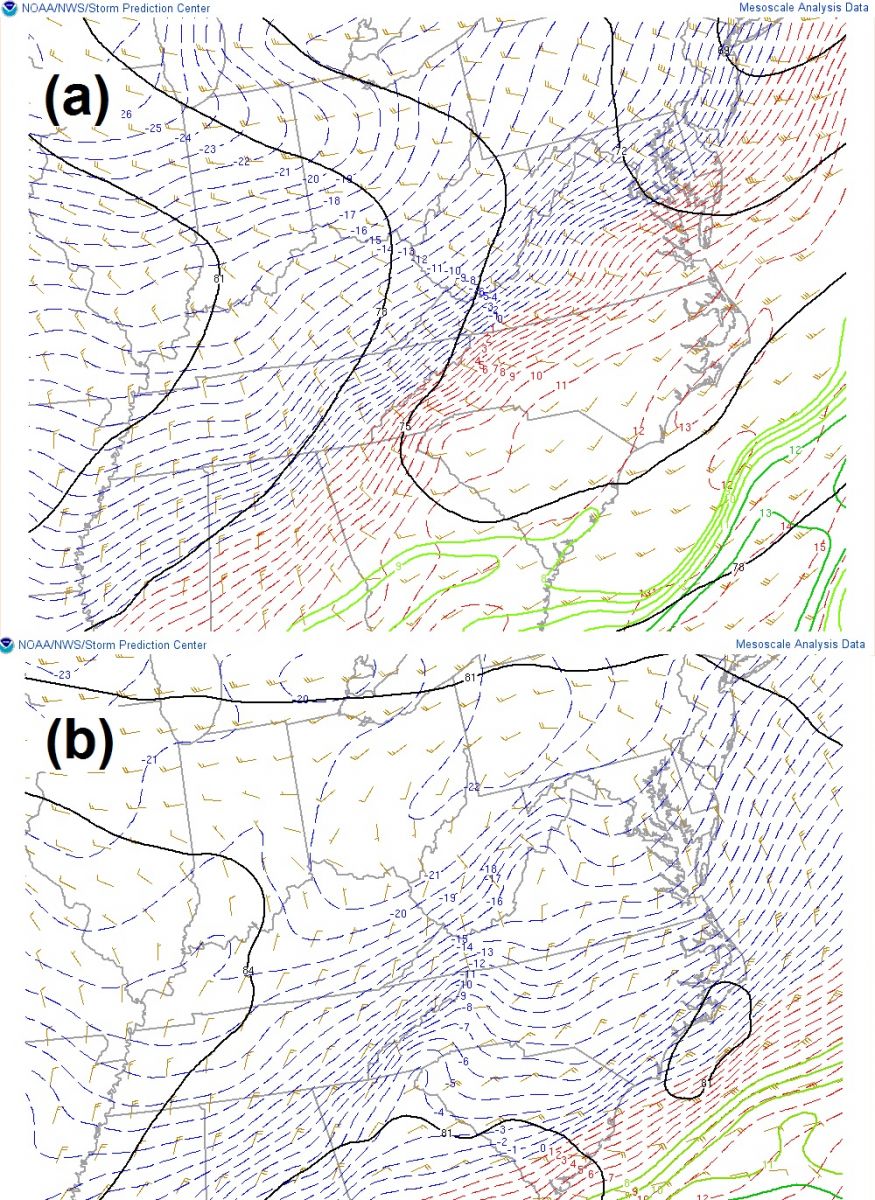
Fig. 6. SPC objective analysis of 925 mb geopotential height (dm; black contours), temperature (dashed blue, 0 °C or lower; dashed red, above 0 °C), dew point (°C; green contours greater than 8 °C), and wind (barbs, standard notation) at 2000 UTC on 27 January 2014 (a) and 1800 UTC on 28 January 2014 (b). Source: NOAA/NWS/Storm Prediction Center. Click to enlarge. c. Precipitation An area of frontogenetically forced upward motion produced precipitation just west of the mountains early in the morning on 28 January. The band of lower tropospheric frontogenetical forcing associated with the tight temperature gradient on the cool side of the front persisted as an identifiable feature as it translated eastward across the Carolinas throughout the day (Fig. 7). The interaction of the mid- and upper-level wind maxima and lower tropospheric frontogenetical forcing produced a southwest to northeast band of upward motion and precipitation. The NOAA wind profiling radar located at Marion, North Carolina, for the Hydrometeorological Test bed - Southeast (HMT-SE) Pilot Study showed the precipitation-sized hydrometeors were forming aloft by 0800 UTC on 28 January (Fig. 8). The precipitation progressively moistened the dry atmosphere as the snow descended for about 8 hours before reaching the surface. A regional composite radar reflectivity mosaic showed the southwest to northeast oriented precipitation band across north Georgia and western North Carolina at 1200 UTC (Fig. 9), but very little of the precipitation was reaching the ground. The light precipitation gradually spread across northeast Georgia and the western Carolinas during the late morning and afternoon (Fig. 10). The highest radar reflectivity was near the coast where more liquid and mixed phase precipitation occurred as opposed to the less reflective snow further inland. The leading edge of the light precipitation echoes (greater than 5 dBZ) reached the area around Anderson, South Carolina, around 1600 UTC but light snow was not observed at the Anderson Regional Airport (KAND) until after 1800 UTC (see Table 1). A similar delay of two hours or more occurred elsewhere across the western Carolinas at onset of precipitation during which the sub-cloud layer cooled and moistened sufficiently to allow hydrometeors to reach the ground. Low-level convergence and upper-level divergence were maximized over east central Georgia and the Carolinas by 2200 UTC (Fig. 11), which corresponded generally to the southwest to northeast oriented band of precipitation. 
Fig. 7. SPC objective analysis of 850 mb geopotential height (m; black contours), temperature (dashed blue, 0 °C or lower; dashed red, above 0 °C), wind (kt; barbs), and Petterssen frontogenesis (K per 100 km per 3 hr; purple contours), height (black contours), and temperature (dashed blue and dashed red contours) at 1800 UTC on 28 January 2014. Click to enlarge. 
Fig. 8. NOAA ESRL HMT-SE Pilot Study wind profiler data from 0000 UTC 27 January (right) to 0000 UTC 29 January (left) at Marion, North Carolina. Vertical radial velocity displayed per the legend. Wind barbs depict horizontal wind as a function of height. The red oval highlights the development of precipitation from aloft to the surface. Source: NOAA/ESRL/PSD. Click to enlarge. 
Fig. 9. Regional mosaic of composite radar reflectivity at 1201 UTC on 28 January 2014. Source: UCAR/NCAR. Click to enlarge. 
Fig. 10. Regional loop of composite radar reflectivity from 1500 UTC to 2300 UTC on 28 January 2014. Source: UCAR/NCAR. Click to enlarge. 
Fig. 11. SPC objective analysis of 850 mb divergence (10⁻⁵ µb s⁻¹ red contours), 250 mb divergence (10⁻⁵ µb s⻹ purple contours), and 850-250 mb differential divergence (dashed black contours and color fill) at 2200 UTC on 28 January 2014. Click to enlarge. 3. Vertical Temperature Structure Several numerical model temperature and moisture profiles identified the key features that contributed to snow formation. The Rapid Refresh (RAP) profiles at 2000 UTC on 28 January at Anderson (AND), Asheville (AVL), Charlotte (CLT), and Greenville-Spartanburg (GSP) showed the optimum temperature range for dendritic ice crystal and snowflake formation (approximately -12 °C to -18 °C) was saturated and it was in a region of upward motion. Snow was assured because the temperature was lower than 0 °C from the dendritic growth zone to the surface at each site (Fig. 12). In fact, the entire atmospheric column remained below freezing for the duration of the event at all four sites. 
Fig. 12. Bufkit Rapid Refresh temperature (red), dew point (green), and wind profiles at Asheville (AVL), Greenville-Spartanburg (GSP), Anderson (AND), and Charlotte (CLT) at 2000 UTC on 28 January 2014. The dendritic growth zone was indicated by yellow segment on temperature profiles. Click to enlarge. The upward motion (negative omega) was not as strong during the 28 January event as is typical in heavy snow events. The model guidance indicated that the combination of forcing and instability was not sufficient to produce a significant response in the form of upward vertical velocity. The six-hour North American Mesoscale (NAM) model displayed a pattern that was somewhat similar to a "cross-hair signature" (Waldstreicher 2001) at GSP during the mid to late afternoon, but it was relatively weak (Fig. 13). [Note: A true cross-hair signature should meet the following criteria: The intersection of an omega maximum of at least -10 µb s⁻¹ to -15 µb s⁻¹ (depending on model resolution) and the favorable dendritic growth zone and relative humidity greater than 75 percent. The upward motion in the present work was approximately -7 µb s⁻¹.] The region of upward motion extended into the dendritic growth zone, but the lift was not particularly strong nor did the maximum values extend through the entire growth zone layer. Accordingly, snowfall rates across the western Carolinas and northeast Georgia were generally light to moderate and accumulations at most locations were less than three inches. 
Fig. 13. Bufkit NAM time-height overview at GSP from the 1200 UTC 28 January 2014 cycle valid from 1200 UTC on 28 January 2014 (right) to 0000 UTC on 1 February 2014 (left) inside the yellow ellipse. Upward motion (µb s⁻¹) depicted by red contours, dendritic growth zone (-12 °C to -18 °C) bounded by purple contours, relative humidity (RH) indicated by color shades (RH > 95 percent in purple). Click to enlarge. The progression of the best combination of vertical velocity and snow growth temperatures during the afternoon can be deduced by examining the RAP hourly guidance from 1500 UTC on 28 January to 0000 UTC on 29 January (Fig. 14). An isosurface showing vertical velocity greater than 10 µb s⁻¹ in the layer bounded by temperature in the -12 °C to -18 °C range showed the best potential for dendritic snow crystal production mainly across central Georgia and the Midlands of South Carolina in the 2100 UTC 28 January to 0000 UTC 29 January time frame. The orientation of the isosurface corresponded roughly to the area of reflectivity greater than 15 dBZ seen at 2200 UTC on 28 January (Fig. 10d). That a more favorable combination of upward vertical velocity in the snow growth region was not diagnosed by the RAP across Upstate South Carolina and northeast Georgia during the event was yet another indication that snow accumulations would be limited across the GSP CWA. 
Fig. 14. RAP isosurface of vertical motion 10 µb s⁻¹ shaded according to temperature (-12 °C to -18 °C; red to blue) at the indicated times and dates. Source: McIDAS-V, UW-Madison SSEC. Click to enlarge. 4. Discussion Even though the amount of snow was generally insignificant, the formation of a thin layer of ice on streets and highways caused dangerous driving conditions. The lower- and middle-tropospheric thermal structure was the key factor to understanding the impact that 2 to 6 cm of snow would have on transportation and infrastructure across northeast Georgia and the western Carolinas on 28 January. The RAP initial hour profiles of temperature and dewpoint for the time period of the most significant snowfall at Anderson (2000 UTC 28 January to 0130 UTC 29 January) suggested saturation with respect to ice at temperatures ranging from -2 °C, through the depth of the dendritic growth zone, to less than -30 °C. Thus, production of snow was possible across the entire spectrum of crystal shapes, especially plates and dendrites. That the entire column remained below freezing during the event allowed the falling snow crystals to reach the ground without developing a film of liquid water. The effect of the relatively dry snow (following the definition in Bouilloud and Martin (2006), which is snow falling with an air temperature of less than -1.5 °C) on untreated roadways was three-fold. The soil temperature at four-inch depth at Clinton, South Carolina, in Laurens County was nearly 7 °C (44 °F) on the morning of 28 January before the snow reached the ground. Thus, the initial snowfall likely melted on impact with the relatively warm surface and quickly cooled road surface temperatures down to near 0 °C (as in Bouilloud and Martin 2006). Surface air temperatures well below freezing during the time of snow accumulation (see Appendix 2) would have promoted the formation of ice on the road surface and prevented melting by conduction near the top of the snow layer once the snow began to accumulate on roadways. Secondly, Bowden and Hughes (1939) demonstrated that dry snow had a lower coefficient of kinetic friction than wet snow. Left untreated, a roadway covered with a dry snow would be more slippery than one covered with a wet snow, at least up until a point that sufficient traffic compressed the snow into a relatively thin and dense layer on the road surface. Finally, automobile tires rolling over the dry compressed snow may have contributed to additional ice development on roadways through frictional effects. Bowden (1953) determined that frictional melting at the point of contact between a moving object and the surface of ice or snow would result in a thin film of water that reduced friction and allowed the object to slide more freely. The act of automobile tires moving repeatedly over the snow-covered road surface may have created additional ice through a succession of frictional melting and refreezing when the thin film of water was exposed to sub-freezing air temperatures. Not surprisingly, studies have shown the motor vehicle accident rate increases substantially as road friction decreases, although there are many different factors that contribute to the problem (Wallman and Astrom 2001). The net result of the snowfall on 28 January was hundreds of motor vehicle accidents, including a school bus that overturned in Henderson County, North Carolina. Most of the accidents occurred on untreated roadways due to the slippery conditions. The findings have important implications for road maintenance engineers and weather forecasters. A forecast of similar atmospheric conditions and snowfall amounts could be a trigger for additional pre-emptive road de-icing measures. Weather forecasters could consider adding specific enhanced wording to advisories to highlight the threat of treacherous driving conditions in spite of a forecast of light snow accumulation, or a Winter Storm Warning could be issued based on the expectation of a significant impact to transportation. 5. Summary A winter precipitation event occurred across the western Carolinas and northeast Georgia on 28 January 2014. The event was unremarkable in terms of accumulation, but it was unique in that the precipitation was entirely in the form of snow, with the possible exception of a brief period of mixed precipitation at the onset across portions of northeast Georgia and the Lakelands of South Carolina. More importantly, the snow was able to reach the ground without any melting during most of the event because the entire atmospheric column was below approximately -2 °C. The snow quickly cooled the ground and roadway surfaces to 0 °C or below, allowing additional snow to accumulate. Upper- and lower-level forcing was not particularly strong across the GSP CWA, which resulted in primarily light to moderate rates of precipitation and snow accumulations in the 1 to 3 inch (2 to 7 cm) range. However, the public impact of the light snow accumulation was significant due to the number of motor vehicle accidents due to slippery road conditions. Untreated roads quickly developed a thin layer of ice due to a combination of dry snow initially melting on road surfaces then re-freezing, followed by additional snowfall being compacted and converted to ice through a cycle of frictional melting from moving vehicle tires and subsequent freezing. Acknowledgments Figures 2 and 3 were obtained from the NOAA/NWS/NCEP/Storm Prediction Center objective upper air analysis. Figures 4 and 5 were obtained from the NOAA/NWS/NCEP/Weather Prediction Center. Figures 6, 7, and 11 were extracted from the NOAA/NWS/NCEP/SPC mesoscale analysis. The wind profiling radar data were acquired from the NOAA/ESRL/Physical Sciences Division HMT-SE Pilot Study. The radar imagery was obtained from the University Corporation for Atmospheric Research\NCAR Real-Time Weather Data web page. Figure 14 was generated by McIDAS-V which was developed at the University of Wisconsin Madison, Space Science and Engineering Center. Snowfall data used in this review were obtained from NWS cooperative observers, CoCoRAHS observers, and local reports provided by law enforcement, emergency management, the media, and the public. References Bouilloud, L., and E. Martin, 2006: A coupled model to simulate snow behavior on roads. J. Appl. Meteor. Climatol., 45, 500-516. Bowden, F. P., and T. P. Hughes, 1939: The mechanism of sliding on ice and snow. Proceedings of the Royal Society of London. Series A. Mathematical and Physical Sciences 172, 949, 280-298. Bowden, F. P., 1953: Friction on snow and ice. Proceedings of the Royal Society of London. Series A. Mathematical and Physical Sciences 217, 1131, 462-478. Keeter, K. and R. Green, 1977: Forecasting the predominance of frozen precipitation: An alternative for the classification of mixed precipitation events and the verification of precipitation type. Nat. Wea. Digest, 6, 17-20. Moyer, B., 2001: A Climatological Analysis of Winter Precipitation Events at Greenville- Spartanburg SC, Eastern Region Technical Attachment, No: 2001-01, 20 pp. Waldstreicher, J. S., 2001: The importance of snow microphysics for large snowfalls. [Available online at https://www.erh.noaa.gov/er/hq/ssd/snowmicro/]. Wallman, C.-G., and H. Astrom, 2001: Friction measurement methods and the correlation between road friction and traffic safety. Swedish National Road and Transport Research Institute, Technical Representative, 47 pp. |


 Hourly Weather