Sioux Falls, SD
Weather Forecast Office
Check Out Our Probabilistic Snowfall Experiment Page
Please Note: This Snowfall Forecast graphic reflects the total snow accumulation expected within the next 60-72 hours.
This graphic may often indicate ADDITIONAL snowfall expected, and will not always reflect the total snowfall for an entire event.
The times at the top of the graphic specify the time period during which this forecast graphic is valid.
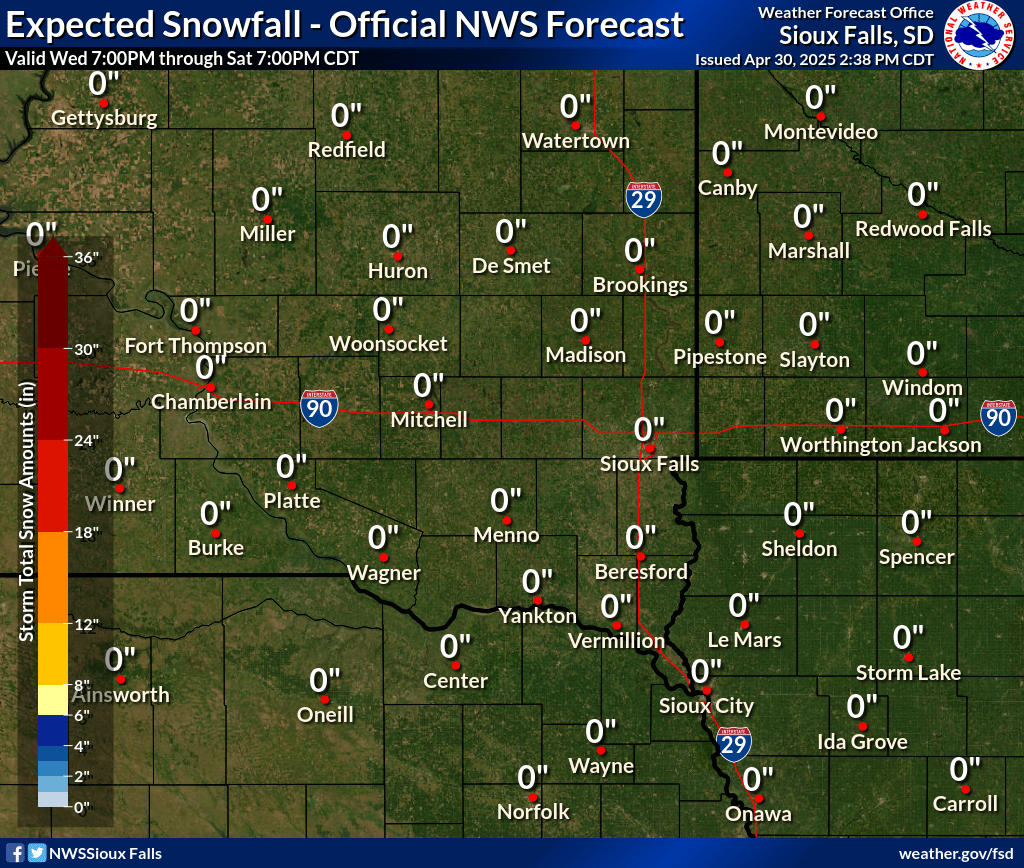
| Key for Total Snowfall Map: | |||||||||||||||||||||||
|
|
||||||||||||||||||||||
Popular Pages
Past Weather Events
Regional Weather Roundup
Daily Temp/Precip
Hazardous Weather
Local Climate Archives
Climate Graphs and Data
Seasonal
EvapoTranspiration
Fire Weather
Grassland Fire Danger
Flooding (River)
Summer Weather
Travel Forecasts
Winter Weather
Winter Preparedness
Forecast Snowfall Graphic
Winter Temp Climatology
US Dept of Commerce
National Oceanic and Atmospheric Administration
National Weather Service
Sioux Falls, SD
26 Weather Lane
Sioux Falls, SD 57104-0198
605-330-4247
Comments? Questions? Please Contact Us.


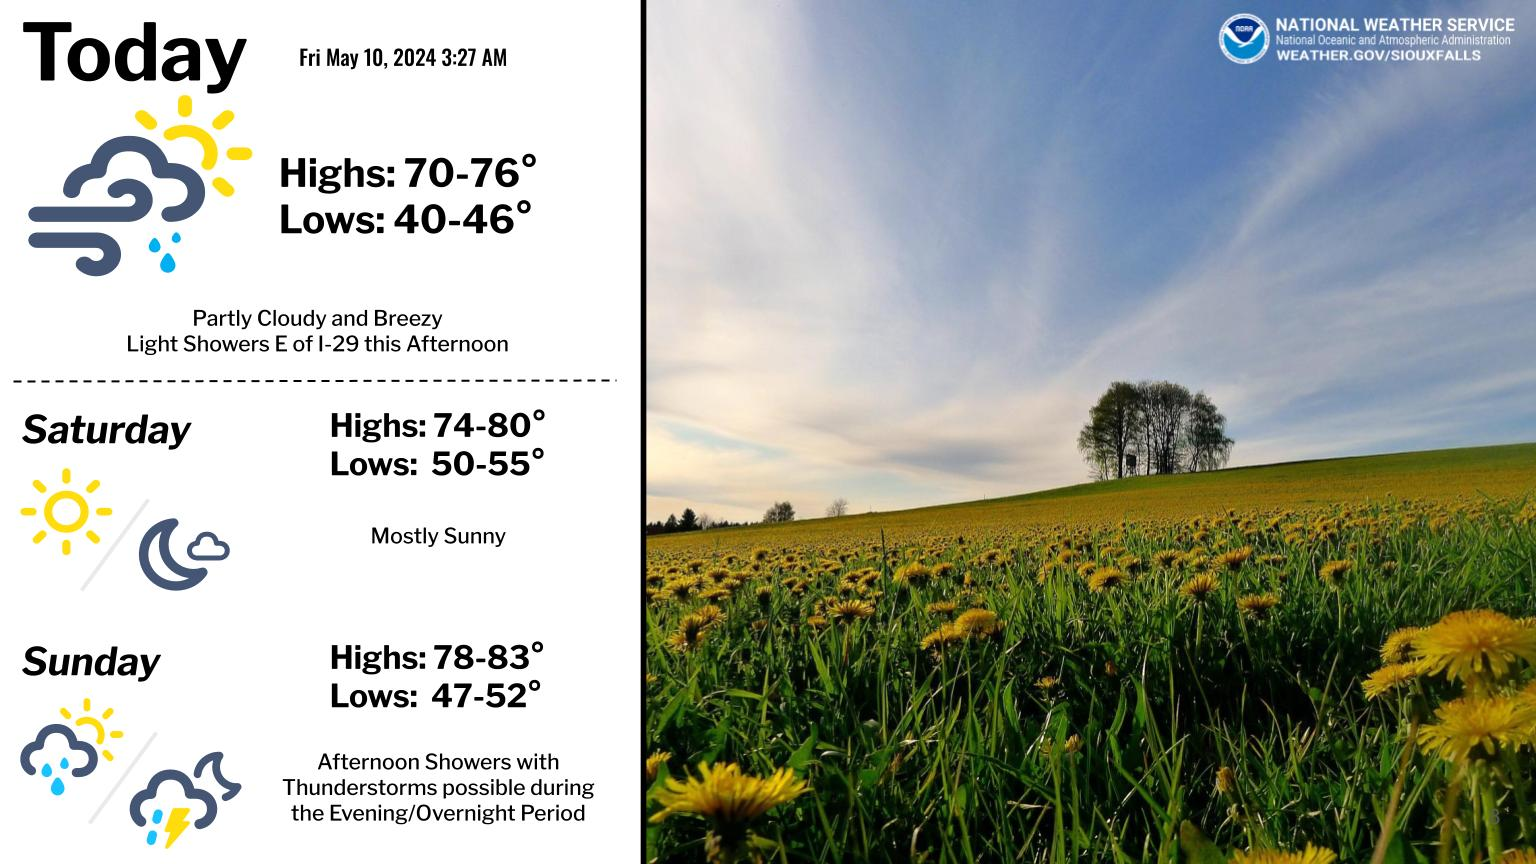 Weather Story
 Weather Map
 Local Radar