Updated on 08/09/2010
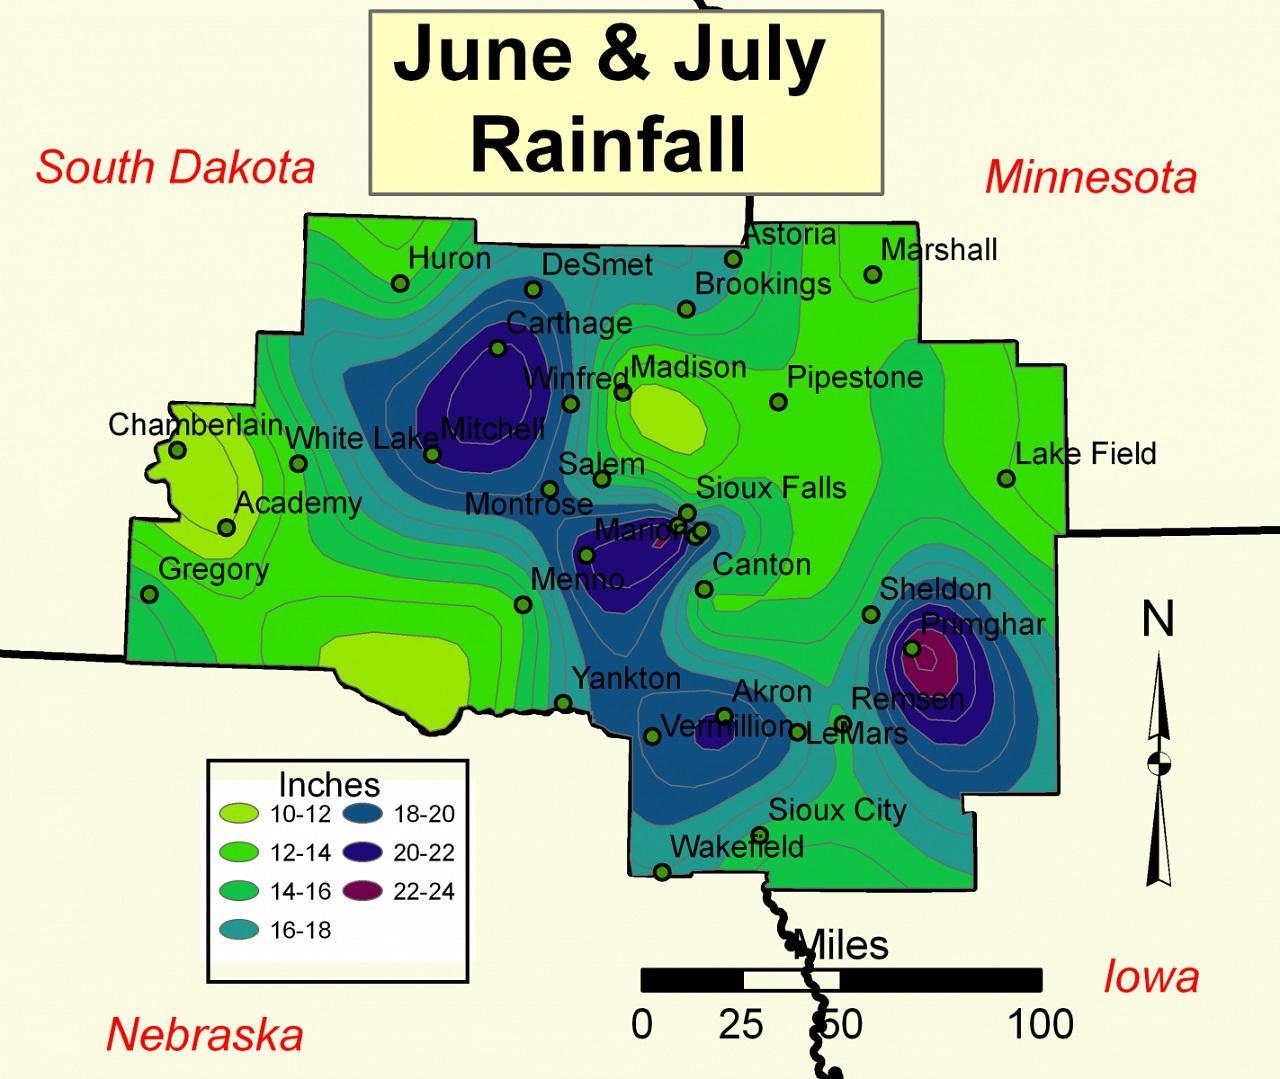
Below is a preliminary look at the precipitation totals in our area for June and July.
There is also a "wettest" ranking for how the June + July totals stand in the record book.
Numbers highlighted in Red are new records.
| Preliminary Look at June and July Precipitation Totals| and the June+July (J+J) Ranking |
||||
| June | July | June+July | J+J Rank Wettest |
|
| South Dakota | ||||
| Academy 2NE | 5.79 | 5.15 | 10.94 | 2nd |
| Astoria 4S | 10.32 | 5.86 | 16.18 | |
| Brookings 2NE | 9.48 | 6.75 | 16.23 | 2nd |
| Canton | 6.67 | 7.92 | 14.59 | 2nd |
| Carthage | 13.72 | 7.47 | 21.19 | |
| Centerville 6SE | 7.27 | 8.04 | 15.31 | 1st |
| Chamberlain 5S | 6.89 | 6.47 | 13.36 | 1st |
| DeSmet | 10.72 | 7.74 | 18.46 | 1st |
| Fedora 10S | 10.23 | 7.37 | 17.6 | |
| Flandreau | 7.57 | 6.29 | 13.86 | 2nd |
| Gregory | 9.87 | 4.82 | 14.69 | 1st |
| Huron | 7.52 | 6.43 | 13.95 | 1st |
| Madison 2SE | 6.03 | 6.43 | 12.46 | |
| Marion | 8.14 | 12.74 | 20.88 | 1st |
| Menno | 8.5 | 5.77 | 14.27 | 4th |
| Mitchell | 9.96 | 10.22 | 20.18 | 1st |
| Montrose | 8.46 | 7.23 | 15.69 | 2nd |
| Salem 5NE | 9.21 | 9.45 | 18.66 | |
| Sioux Falls Airport | 7.83 | 8.55 | 16.38 | 1st |
| Tyndall | 8.4 | 7.21 | 15.61 | 2nd |
| Vermillion 2SE | 7.26 | 11.99 | 19.25 | 1st |
| Wessington Springs | 10.43 | 10.78 | 21.21 | 1st |
| White Lake | 6.45 | 7.44 | 13.89 | 2nd |
| Winfred 2S | 10.36 | 8.04 | 18.4 | |
| Yankton 2E | 6.69 | 10.21 | 16.9 | 1st |
| Iowa | ||||
| Akron 11E | 8.92 | 11.19 | 20.11 | |
| Battle Creek 3NE | 10.87 | 12.88 | 23.75 | |
| Brunsville | 8.02 | 9.79 | 17.81 | |
| Lake Park | 7.61 | 8.35 | 15.96 | 3rd |
| LeMars | 9.38 | 8.39 | 17.77 | 1st |
| Orange City | N/A | 9.34 | 9.34 | |
| Primghar | 12.35 | 10.5 | 22.85 | 1st |
| Remsen | 8.28 | 7.49 | 15.77 | |
| Sanborn | 9.91 | 10.98 | 20.89 | 1st |
| Sheldon | 7.67 | 8.64 | 16.31 | 2nd |
| Sibley 3NE | 5.65 | 7.76 | 13.41 | 6th |
| Sioux Center 2SE | 9.08 | 10.23 | 19.31 | 1st |
| Sioux City Airport | 6.4 | 9.23 | 15.63 | 1st |
| Sioux Rapids 4E | 8.35 | 8.83 | 17.18 | 2nd |
| Spencer 1N | 12.81 | 6.96 | 19.77 | 1st |
| Spirit Lake | 6.5 | 7.53 | 14.03 | |
| Minnesota | ||||
| Lakefield 2NE | 6.79 | 6.28 | 13.07 | 1st |
| Marshall | 7.12 | 5.39 | 12.51 | |
| Pipestone | 7.78 | 6.02 | 13.8 | 3rd |
| Windom | 8.33 | 3.74 | 12.07 | 7th |
| Worthington 2NNE | 7.65 | 3.85 | 11.5 | 4th |
| Nebraska | ||||
| Wakefield | 9.18 | 7.77 | 16.95 | 1st |
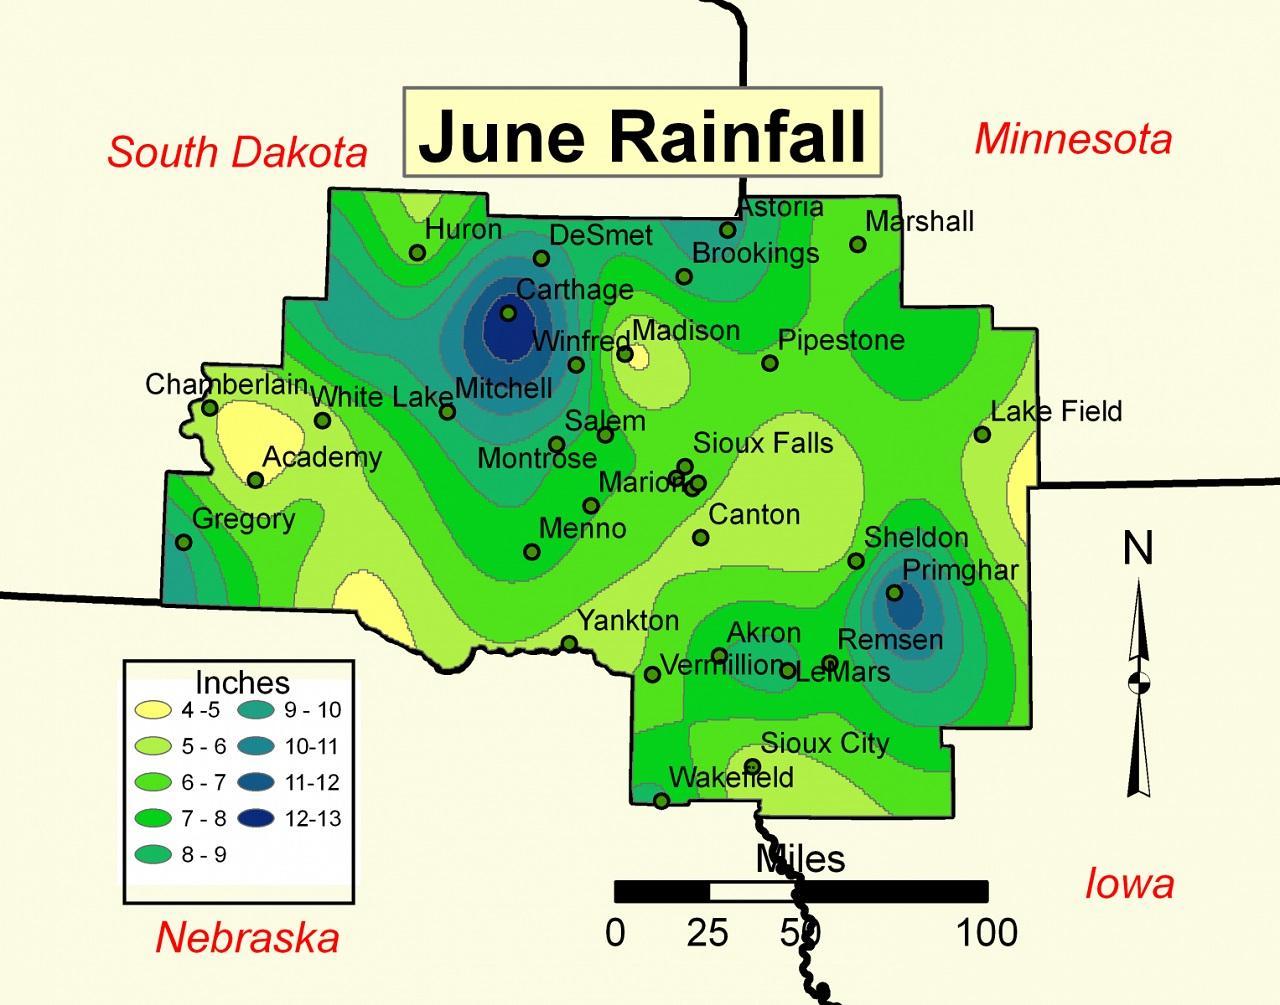
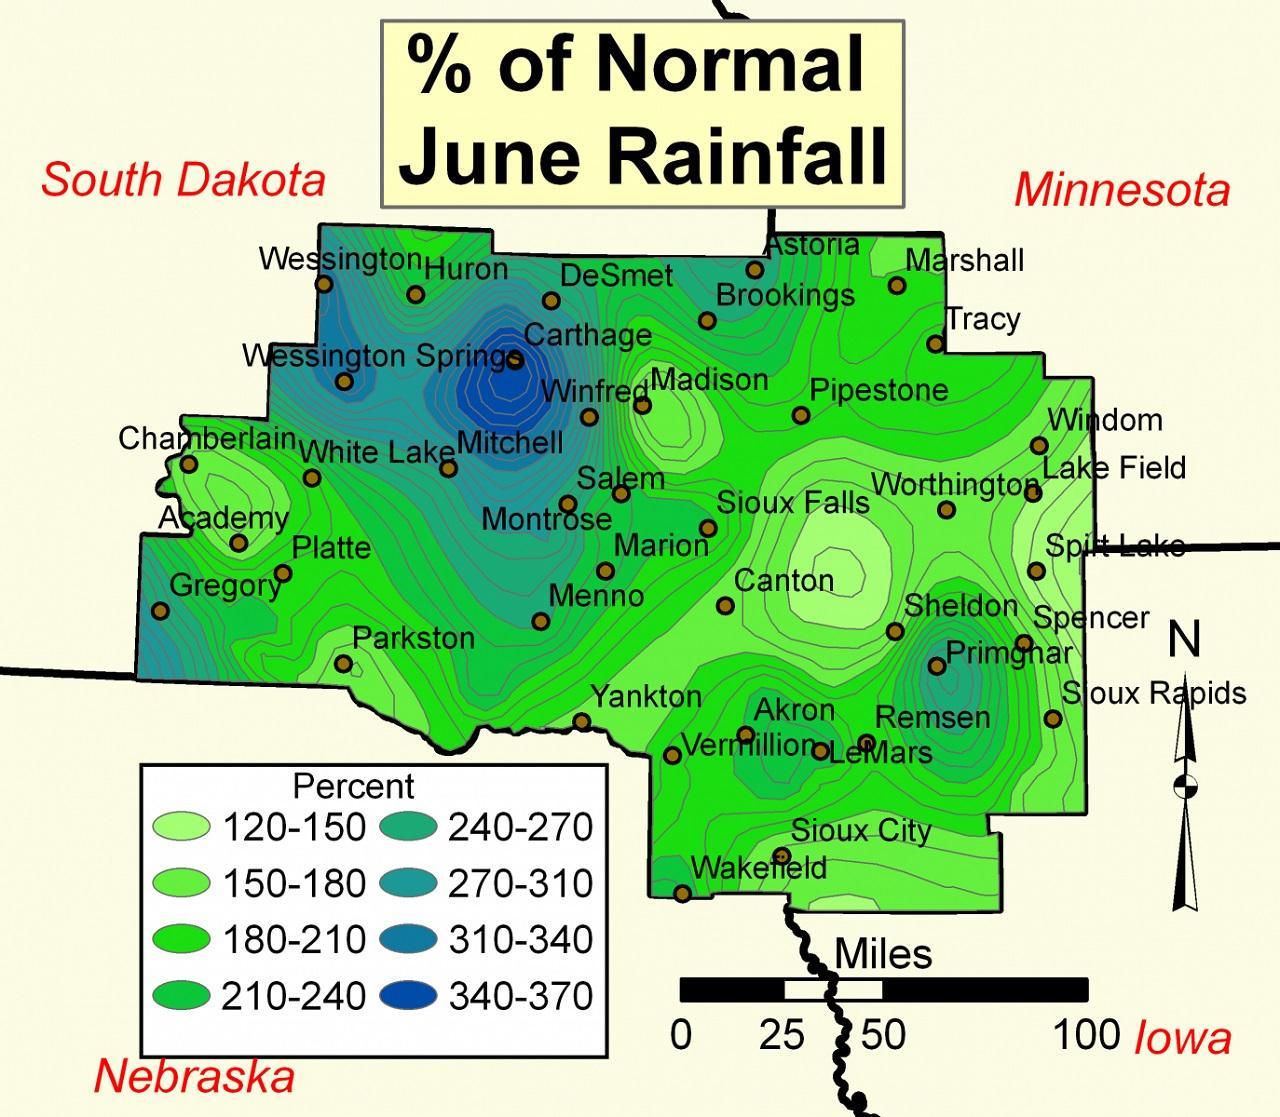
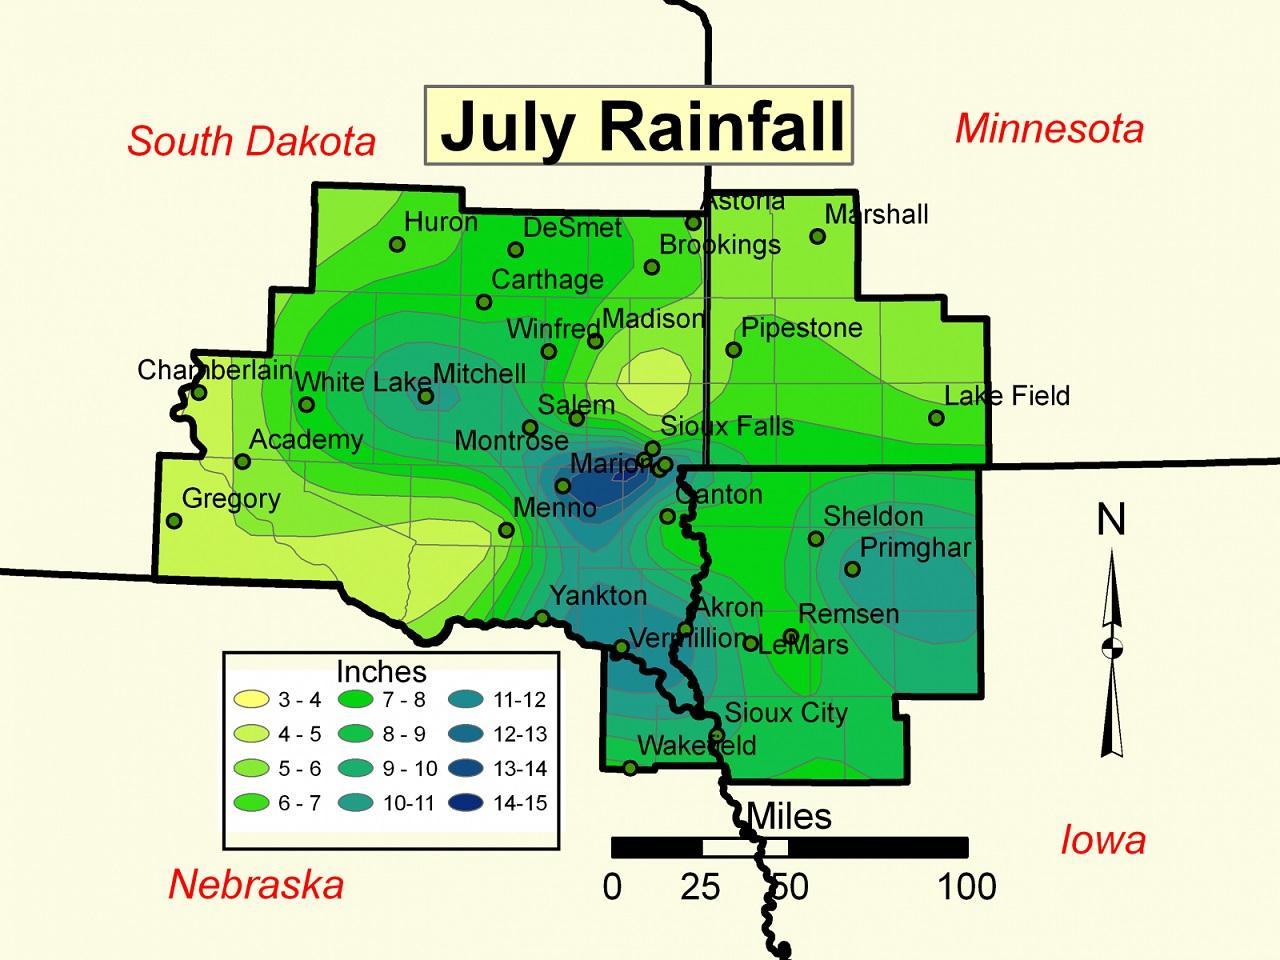
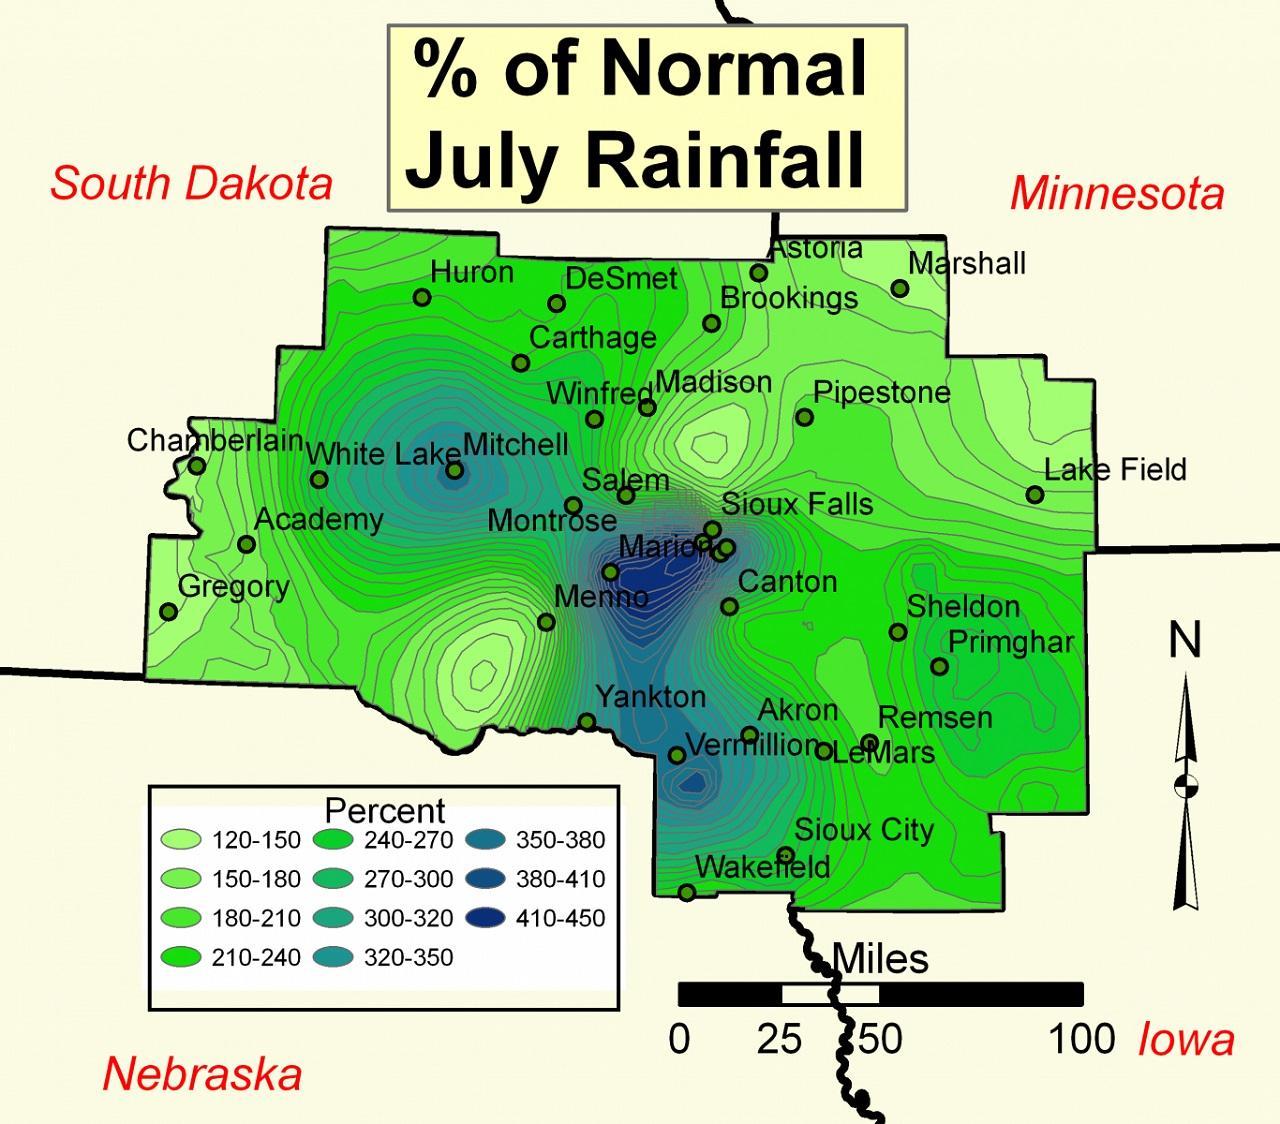
The maps below were created using preliminary precipitation reports. Rainfall amounts have been interpolated and may not necessarily be representative of actual rainfall amounts. These maps are only intented to show approximations of actual precipitation amounts.


 Weather Story
 Weather Map
 Local Radar