|
Local Drought Resource Page For Southeast South Dakota, Northwest Iowa, Southwest Minnesota and Far Northeast Nebraska
|
||||||||||
|
|
||||||||||
|
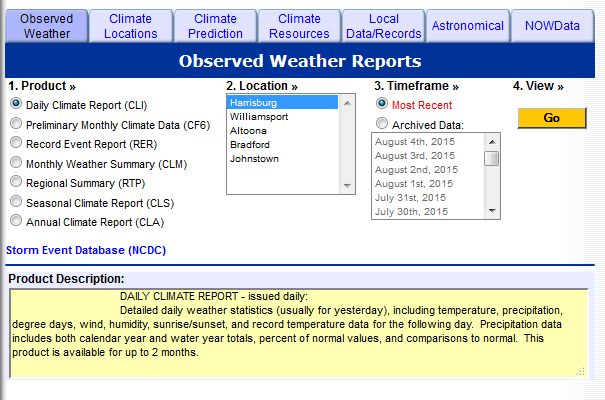
Observed Precipitation and Temperatures |
|
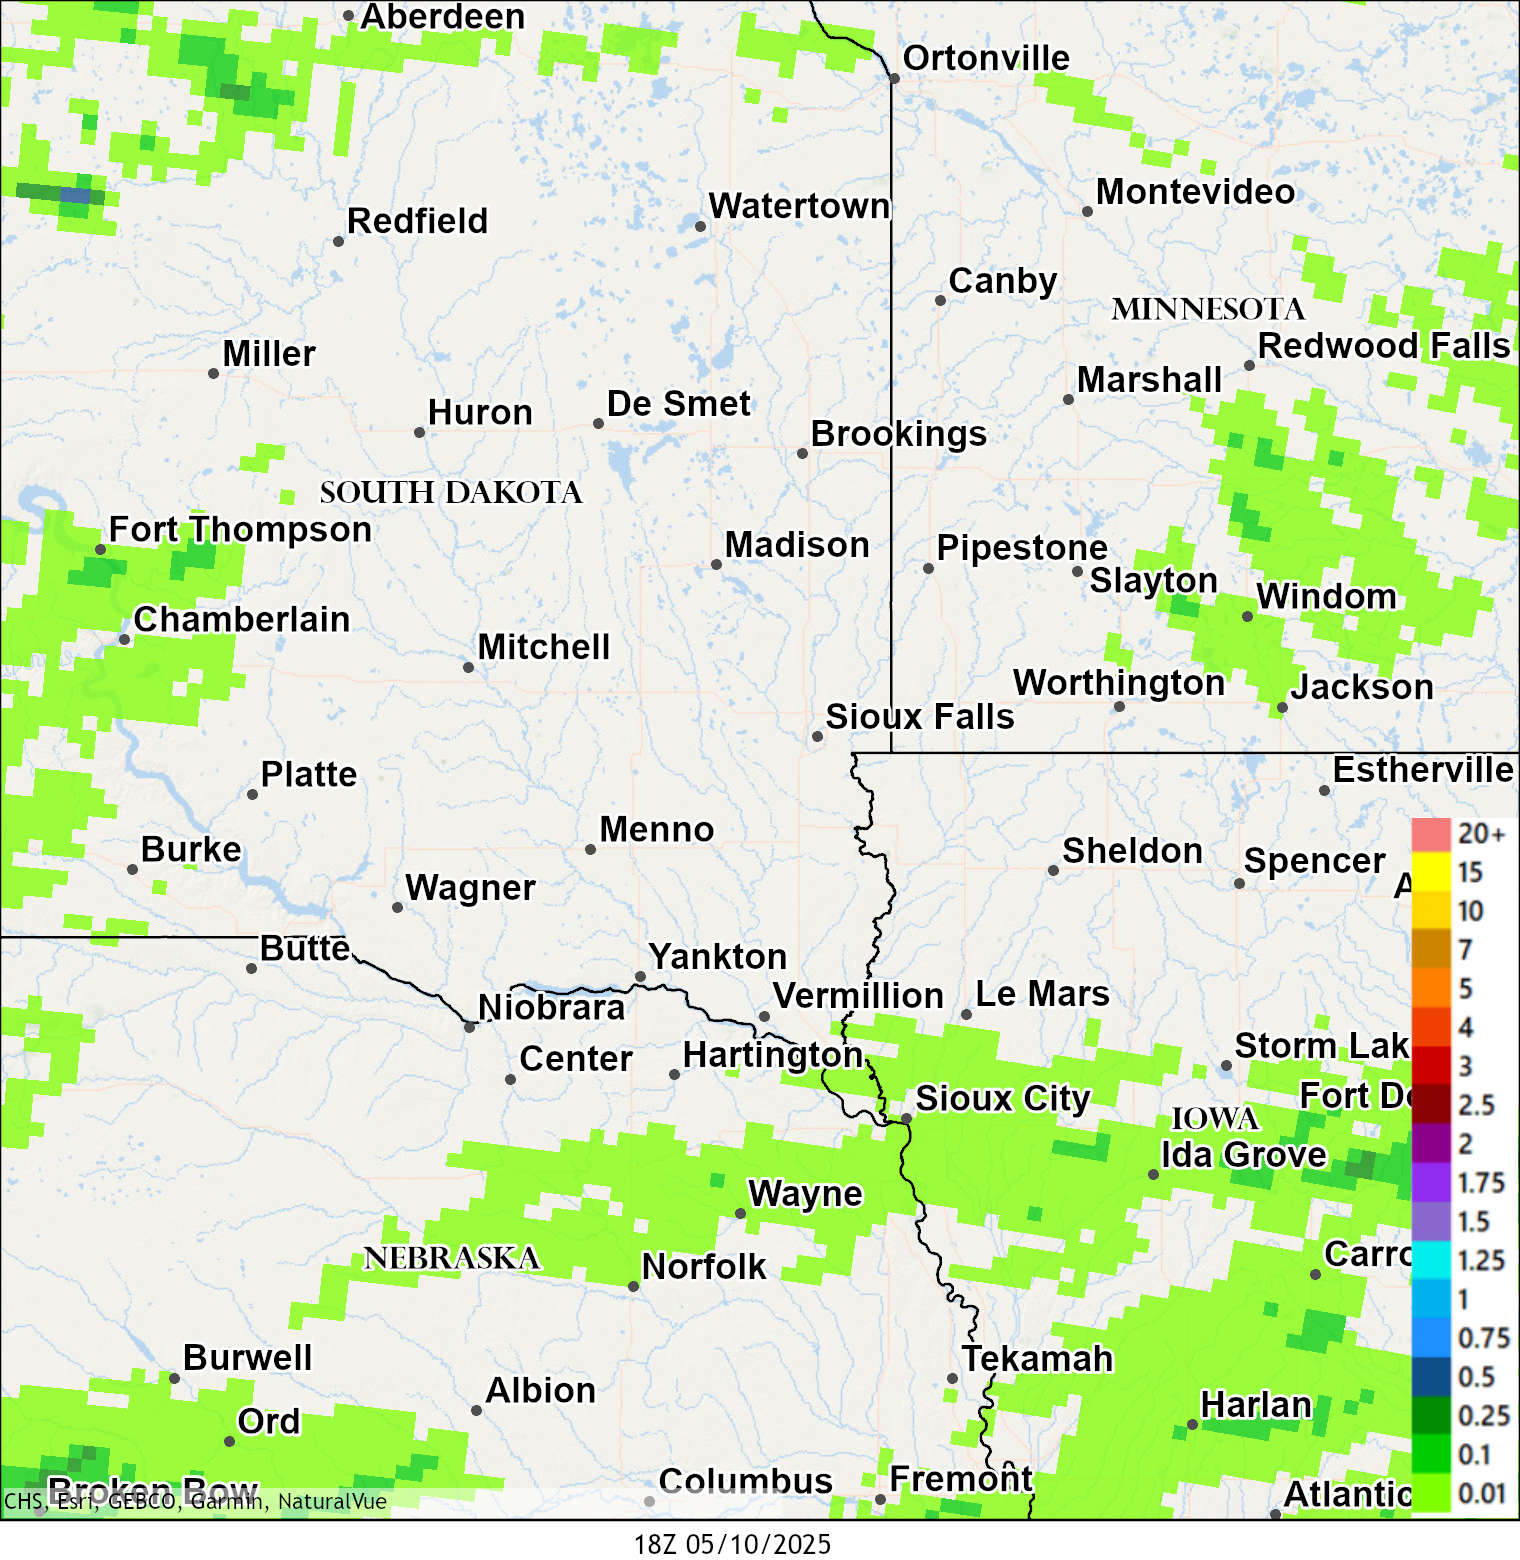
5 Day Observed Precipitation
|
CoCoRaHS Reports |
Climate Site Reports |
| Precipitation and Temperature Compared to Climatology |
Observed Precipitation
|
30 Days |
60 Days |
90 Days |
Year To Date |
Departure From Normal Precipitation
|
30 Days |
60 Days |
90 Days |
Year To Date |
Departure of Normal Temperatures
|
7 Days |
30 Days |
60 Days |
90 Days |
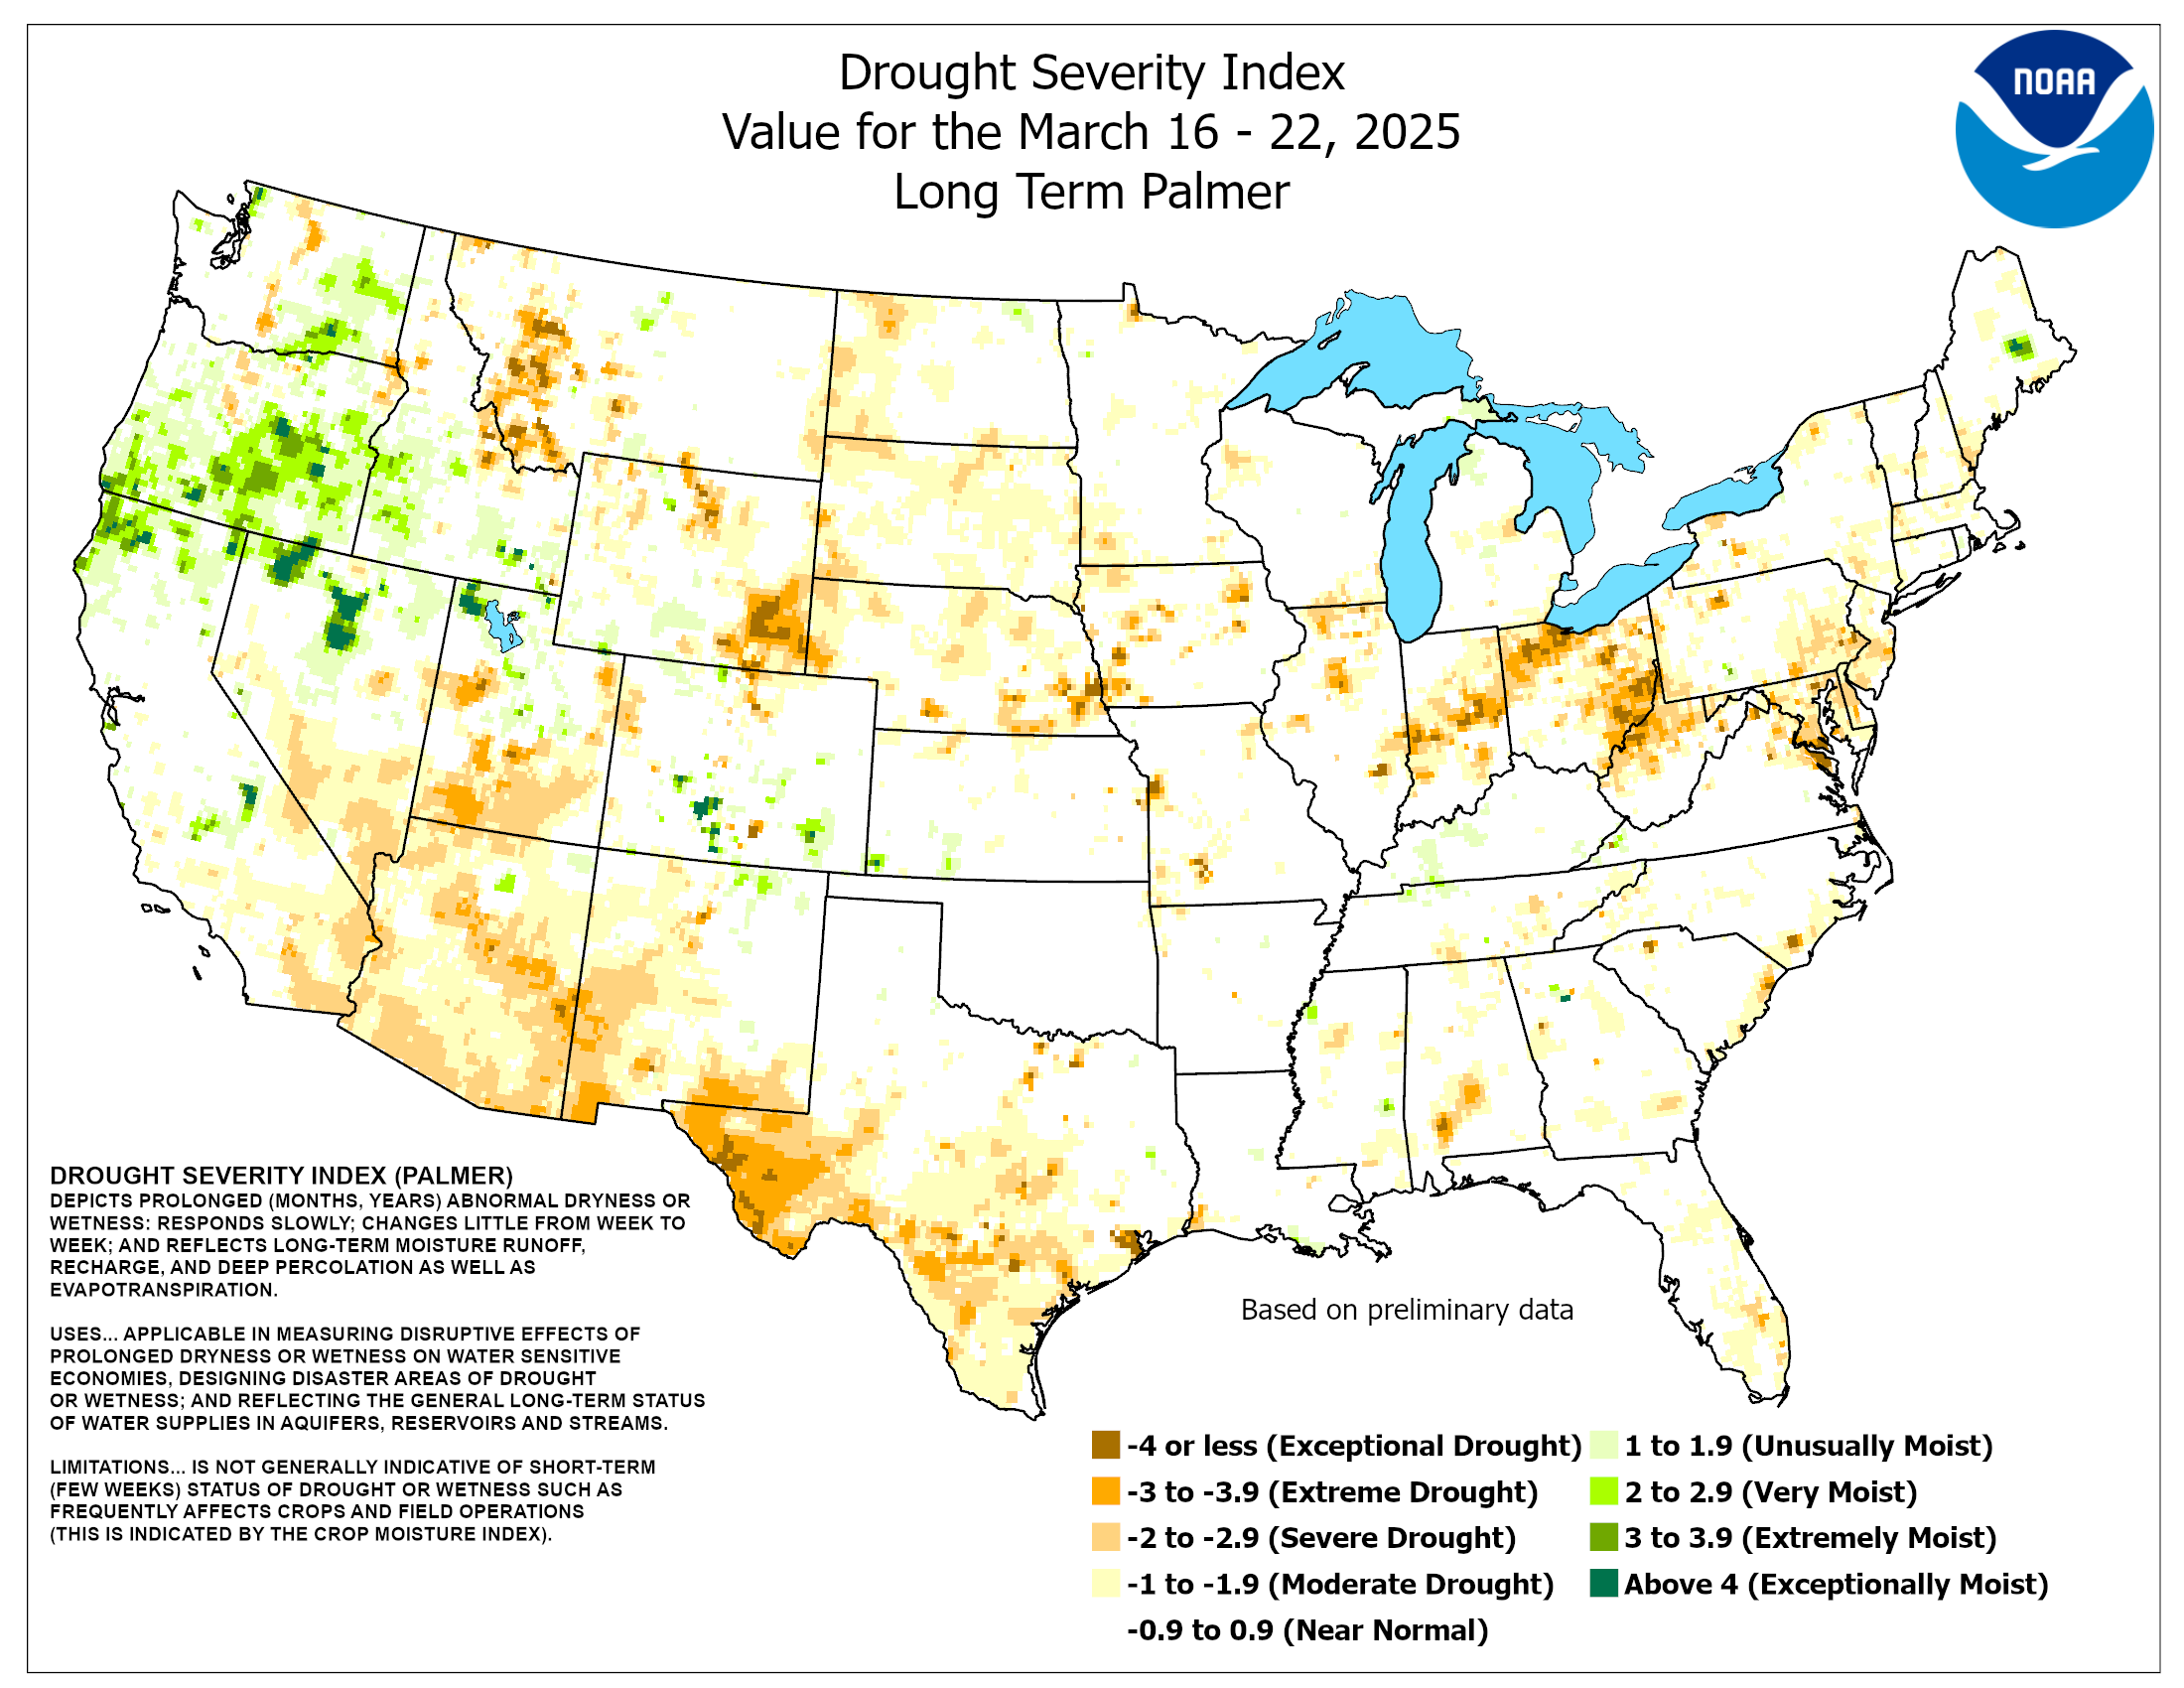
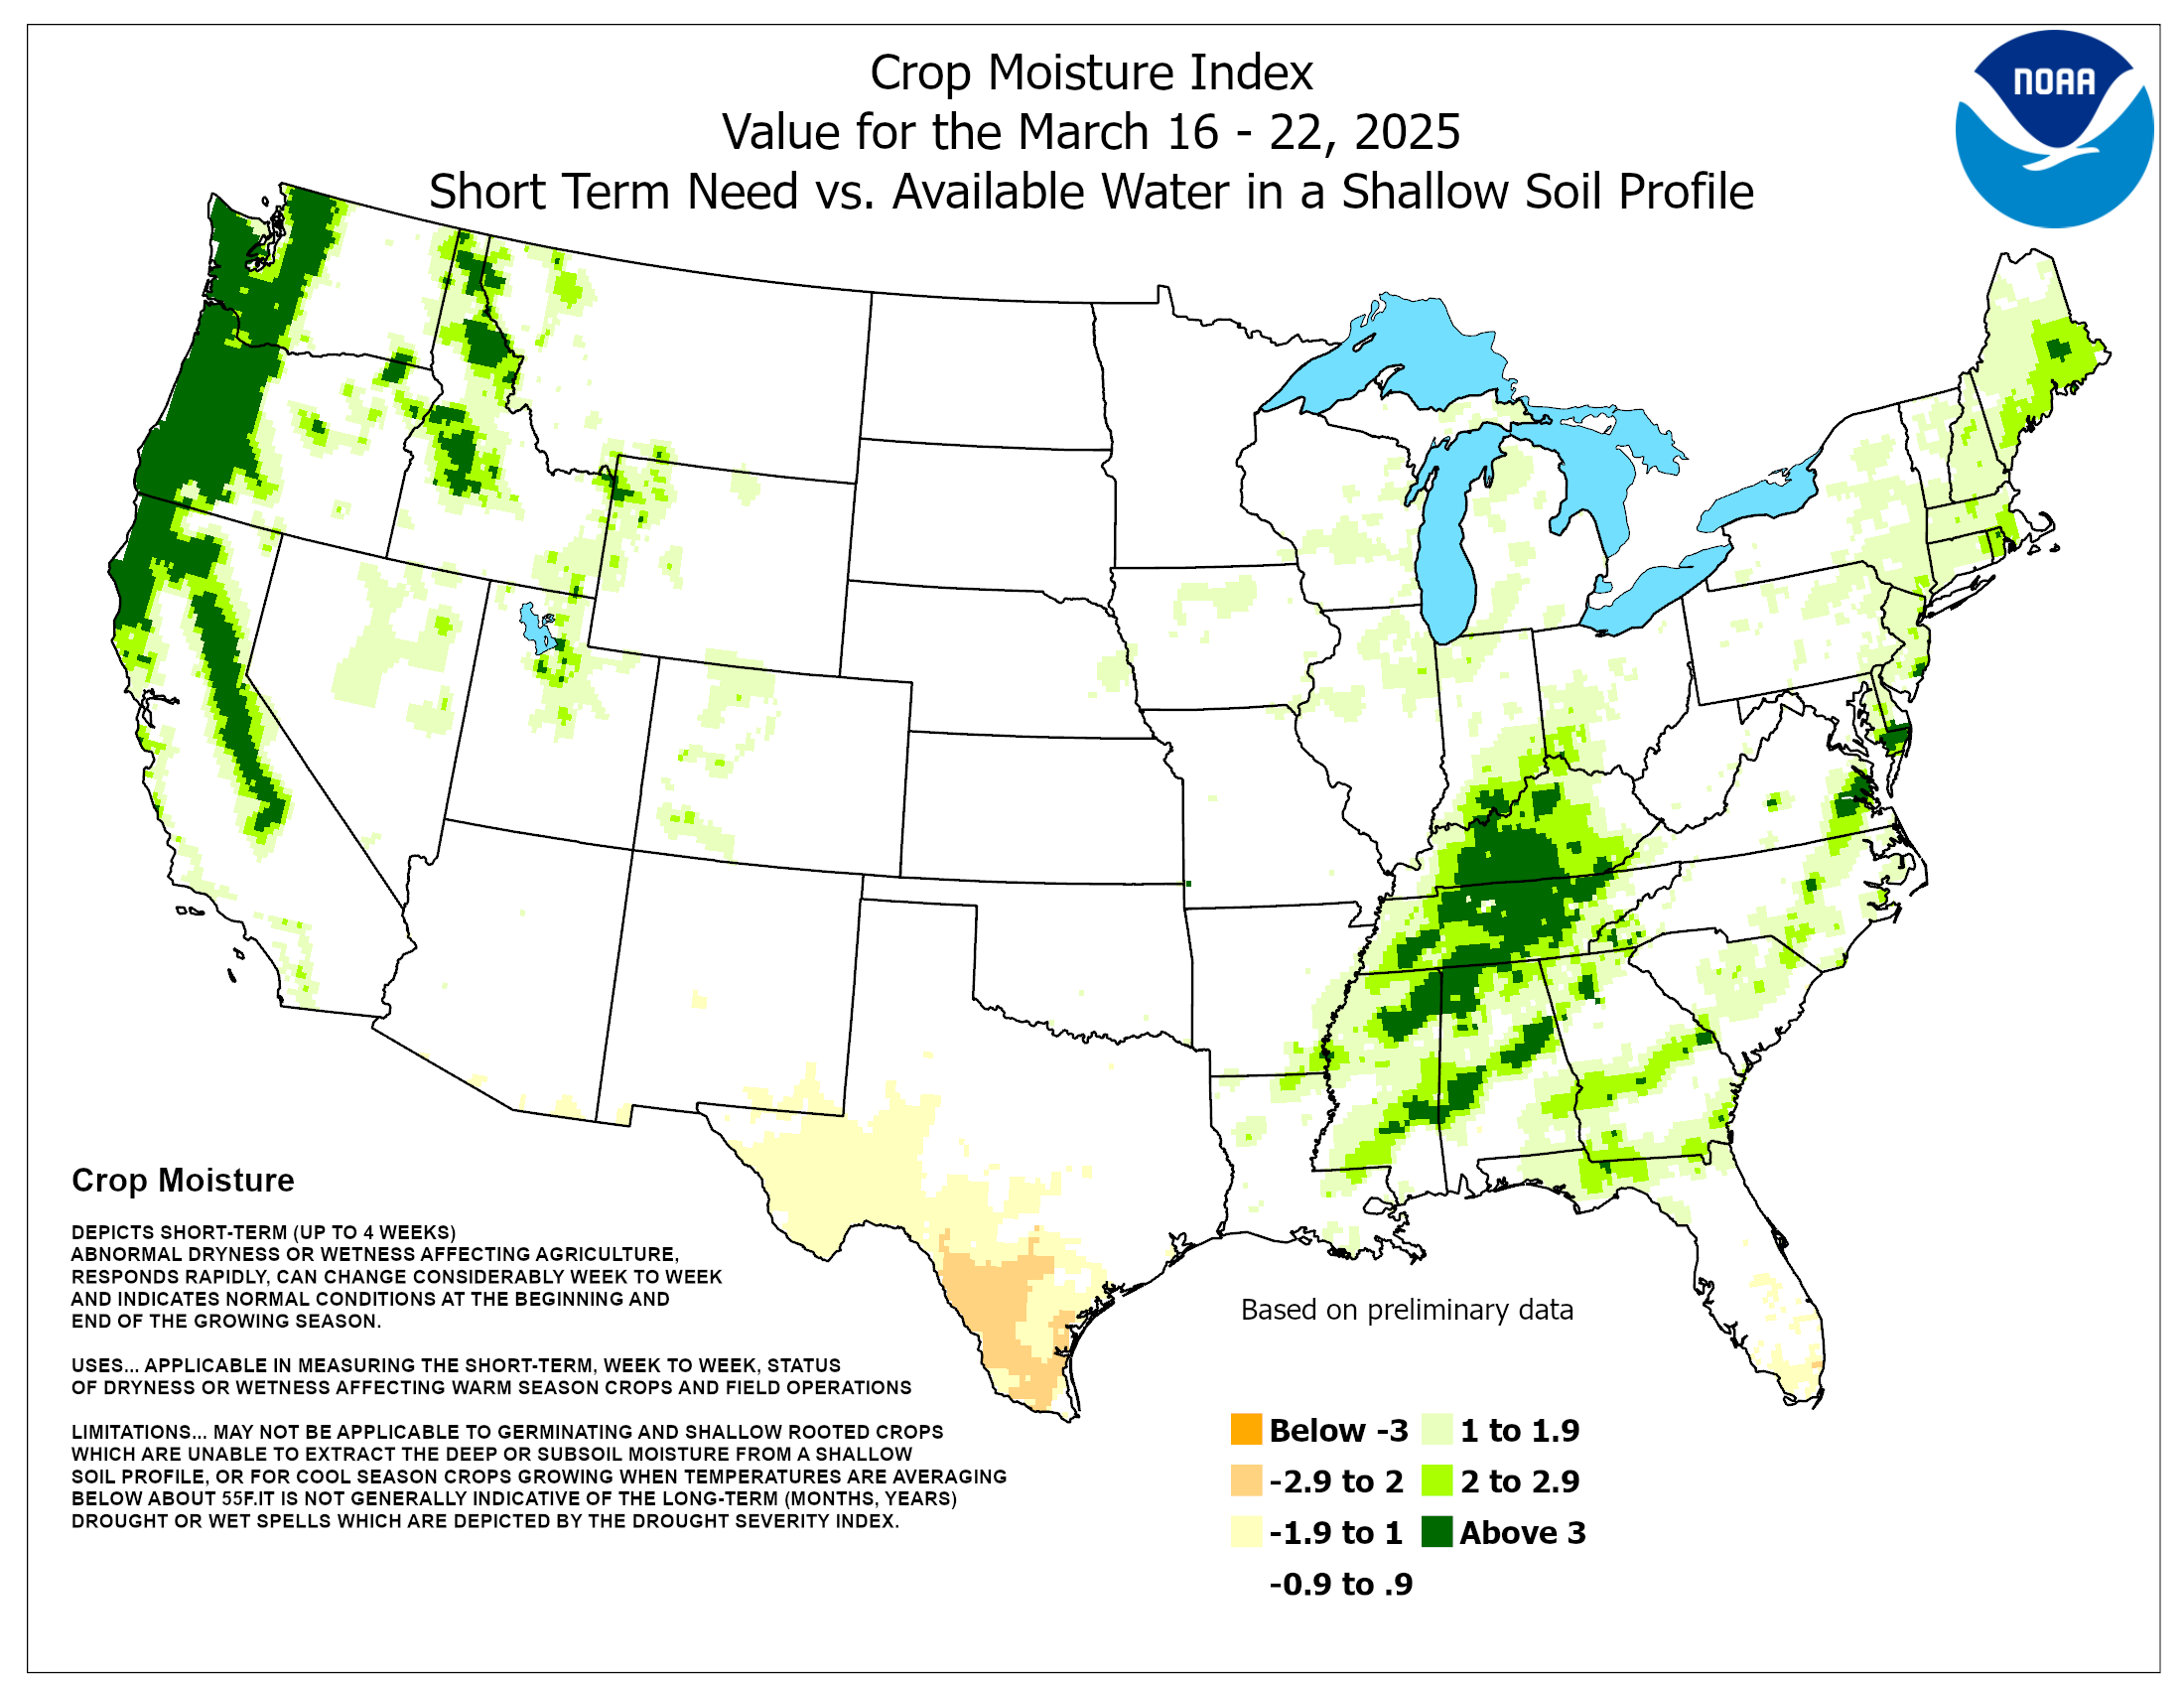
| Drought and Soil Moisture Indices |
|
|
|
| Current Soil Moisture Conditions |
|
Daily Calculated Soil Moisture Anomaly (mm) |
Monthly Calculated Soil Moisture Anomaly (mm) |
Monthly Change in Soil Moisture (Anomaly) |
Seasonal Change in Soil Moisture (Anomaly) |
 |
Crop Progress and Conditions |
Weekly Weather and Crop Bulletin USDA National Agricultural Statistics Service USDA County Drought Disaster List |
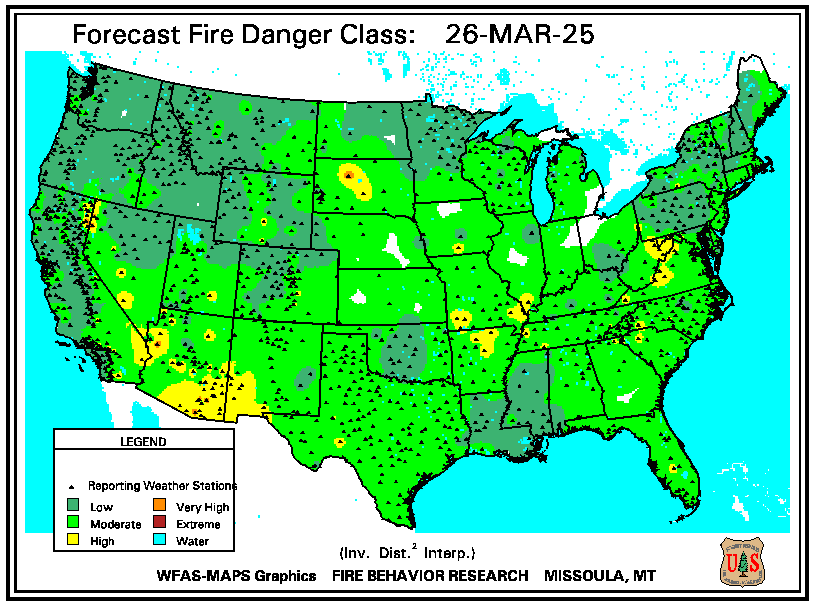
| Near-Term Fire Danger |
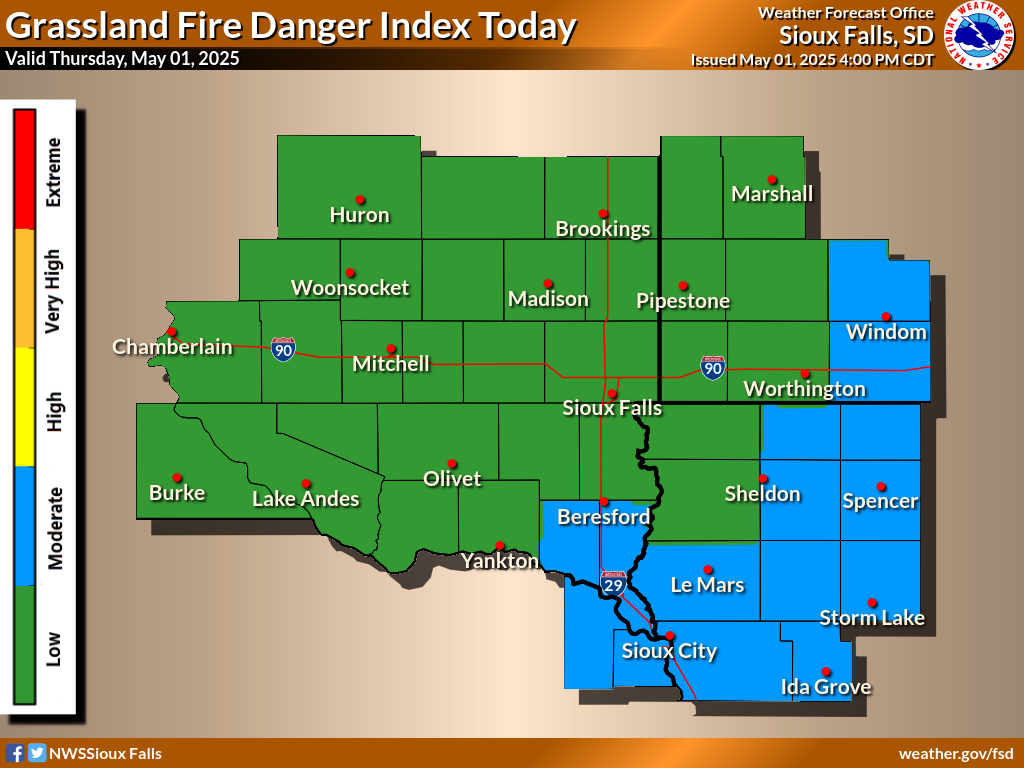 |
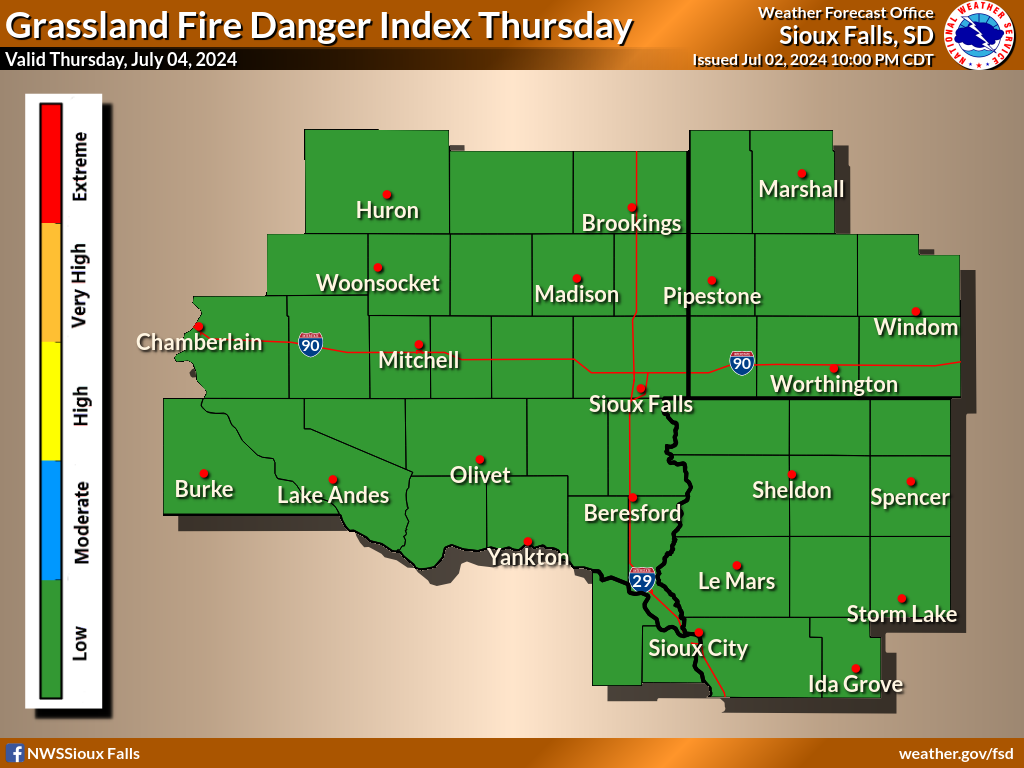 |
| Long Range Fire Outlook |
|
WFAS-MAPS Forecast Fire Danger Class |
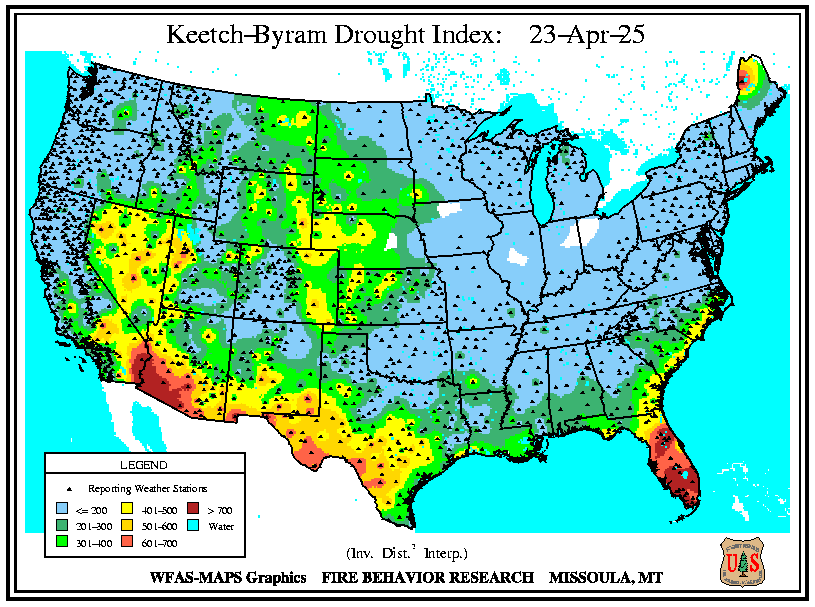
Keetch-Byram Drought Index |
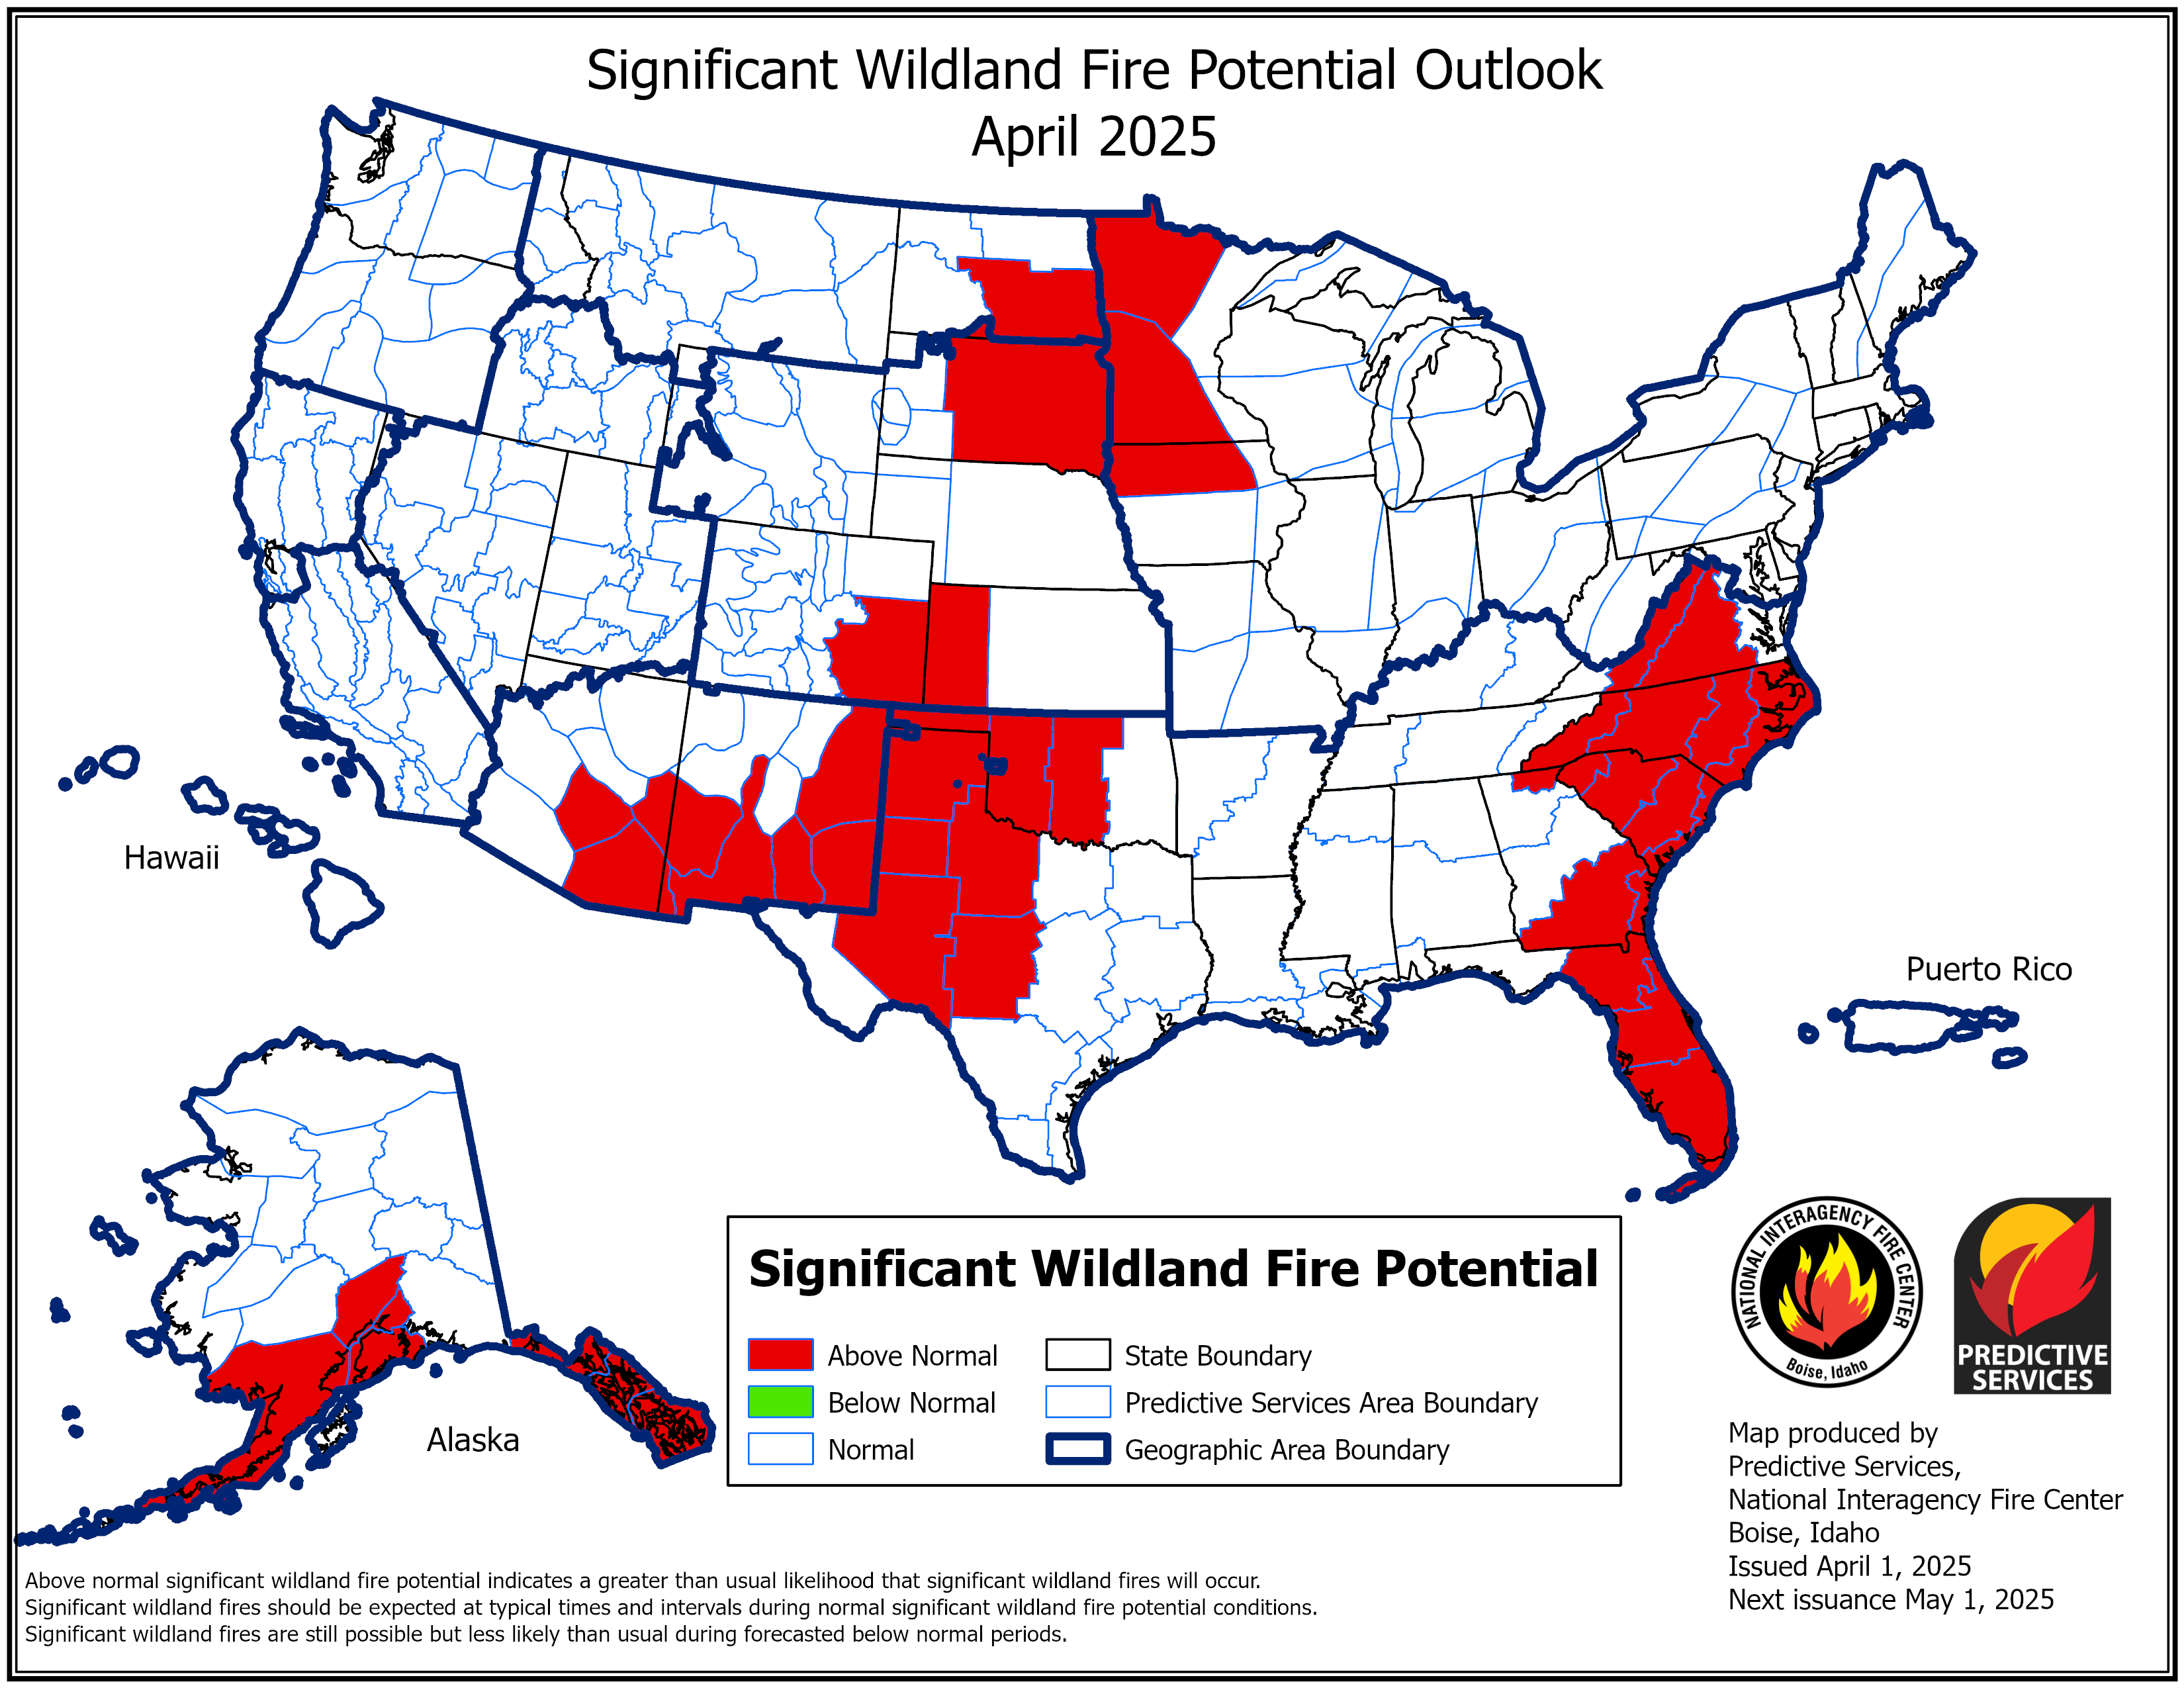
1-Month Significant Wildland Fire Potential Outlook |
| Medium-Range Outlooks |
|
|
 |
 |
 |
| 3 Month Outlooks |
 |
 |
| Drought Outlook |
 |
 |
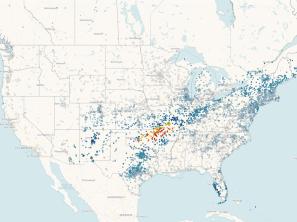
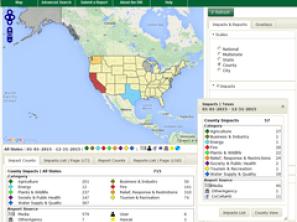
| Drought Impact Reports |
|
Send Your Drought Reports |
View Drought Reports |
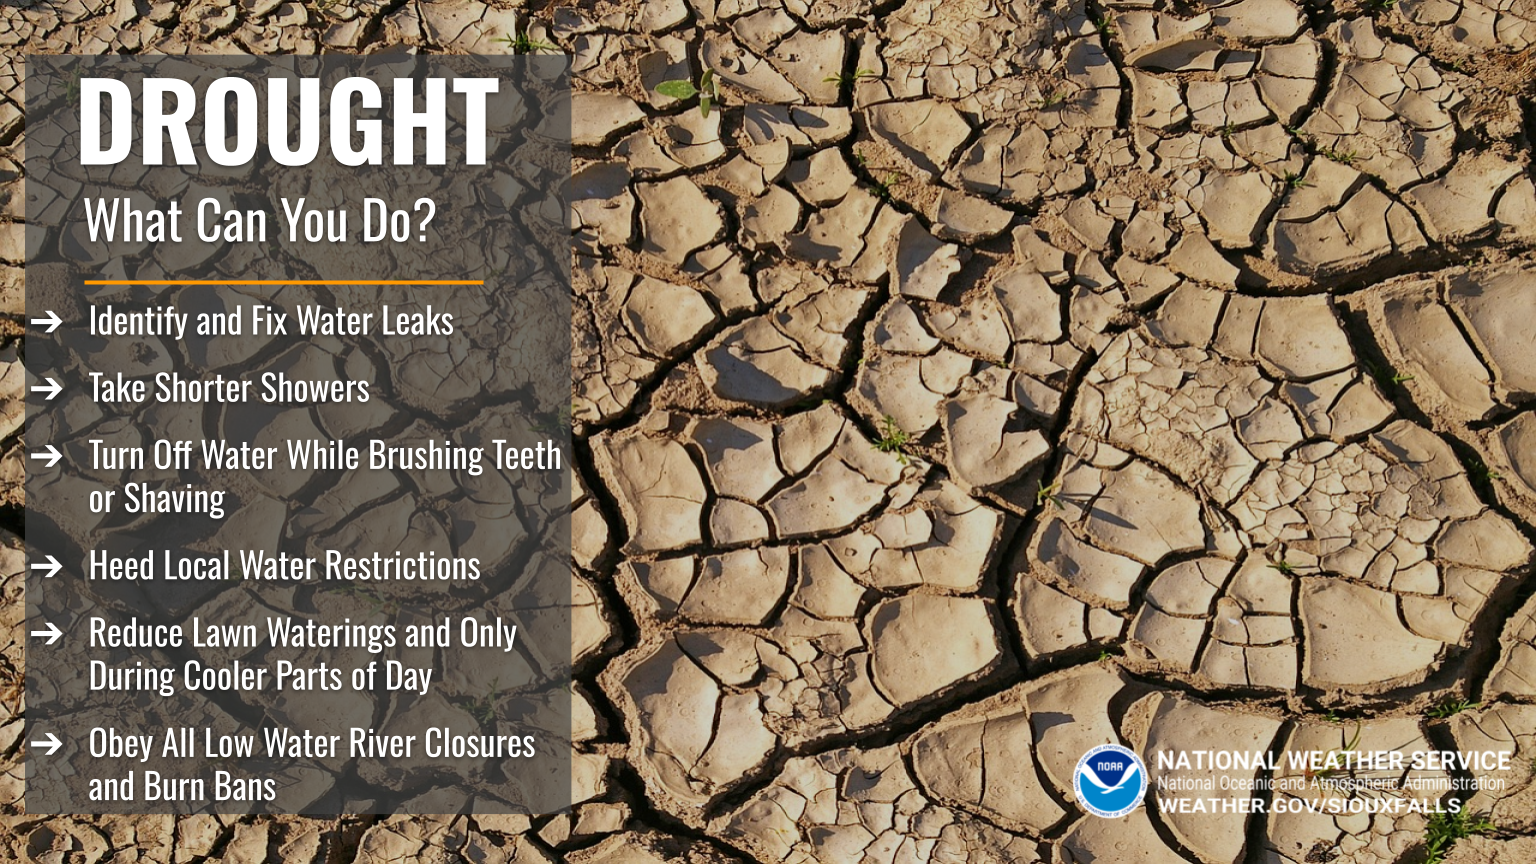
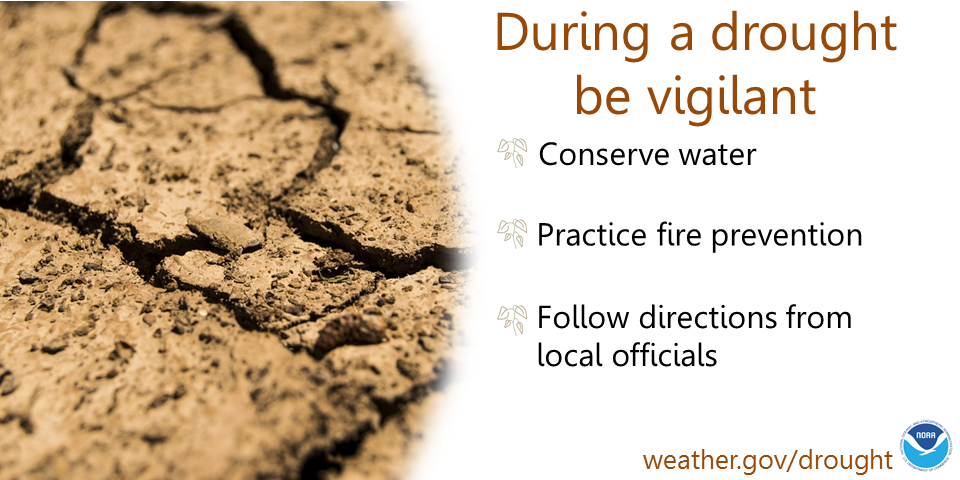
| Drought Safety and Preparedness |
 |
 |
 |
 |
 |
 |
| NWS Drought Resource Page | Ready.gov Drought Resource Page |


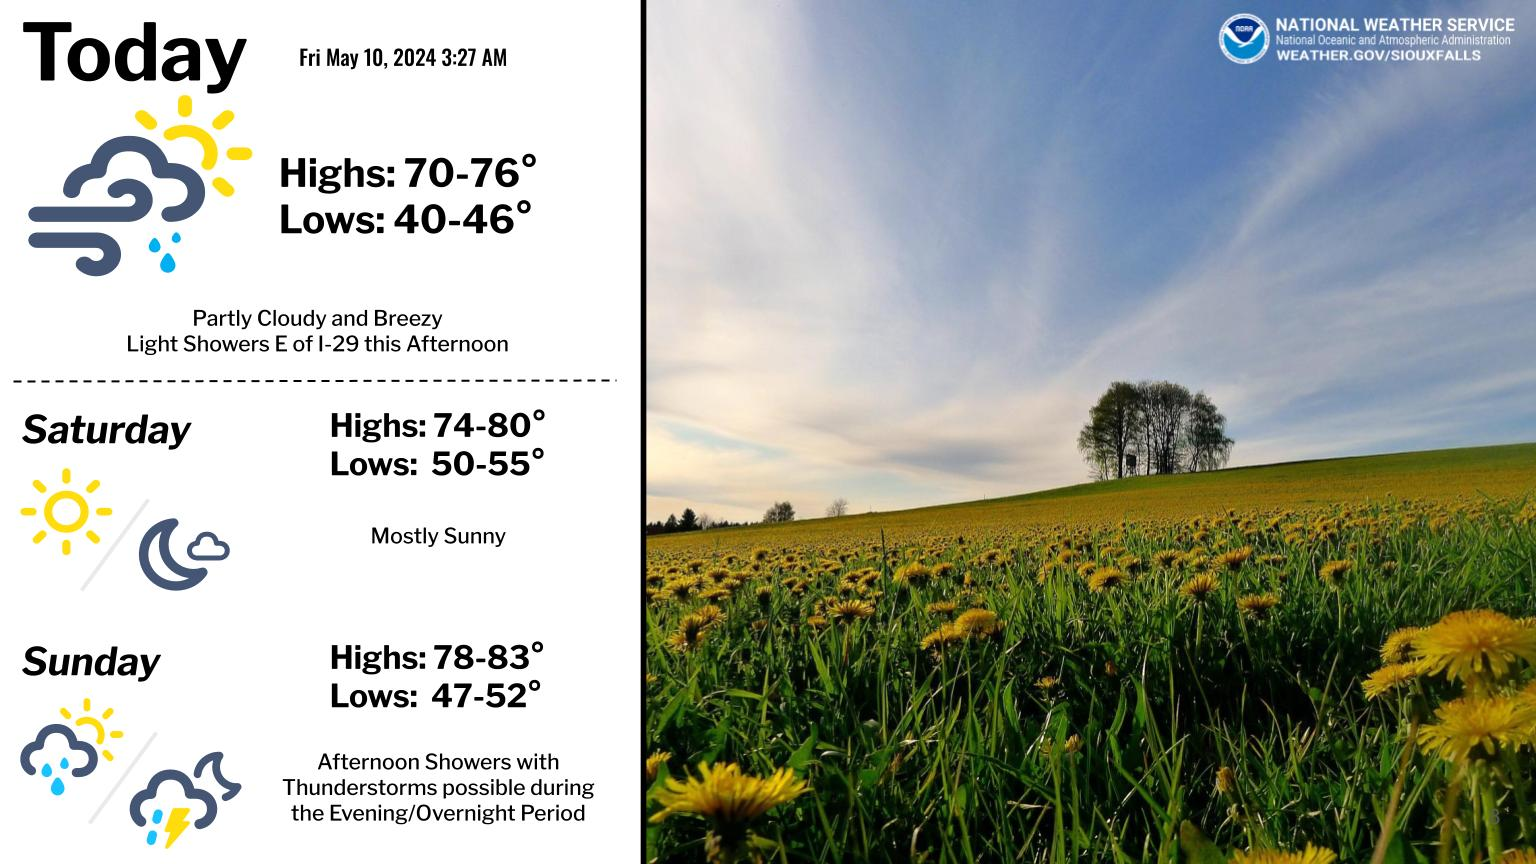 Weather Story
 Weather Map
 Local Radar