Nadia Snow
Baltic High School, Baltic, SD
Samantha Carr and Philip Schumacher
National Weather Service, Sioux Falls, SD
Introduction
The Fourth National Climate Assessment (NCA) conducted in 2018, assesses the science of climate change,
variability, and its impacts across the United States, now and throughout this century. While many believe that climate change simply revolves around earth's warming temperatures, it's important to realize that this topic encompasses so much more. In fact, the NCA predicts that there are five areas that will be affected most in our region. These include our water, agriculture, recreation and tourism, energy, and indigenous peoples.
The NCA is a valuable resource not only because it provides information to the general public, but also because it is an objective, scientific study that provides facts about climate change and its impacts. This assessment is broken into many chapters which correspond to different regions. By doing this, the general public can examine how recent changes in the climate have a direct impact on their area. With that in mind, I designed my research project to take on a similar approach. While a vast majority of my study sought to determine any trends or significant changes in climate over the past several decades, I also aimed to provide insight on how these changes would impact our current and future society.
Objective
For this study, I examined climate data from three cities: Sioux Falls, Rapid City, and Denver. While Sioux Falls and Rapid City are both located in South Dakota, their topographies are vastly different. Thus, by picking these two locations, I was able to analyze how differences in topography within the same region affect the overall climate. Lastly, to rule out bias from only examining one state, I decided to include Denver, Colorado in my analysis. Plus, this allowed me the opportunity to gain some perspective on how the climate was possibly changing in another region of the country.
For the first part of this study, I examined the maximum and minimum temperatures and total precipitation for the cities mentioned above. Given that greenhouse gas emission increased most rapidly in the late 20th and early 21st century, it was decided that this study would examine the previously listed parameters between 1970 - 2019. The data was then broken up monthly, seasonally, and annually to determine if any trends existed. Overall, my expectation was that both maximum and minimum temperatures would increase, causing more extreme heat and less extreme cold. Precipitation, however, was a bit harder to predict due to the many factors that can affect it, but I predicted that overall totals would go up due to higher evapotranspiration rates.
For the second part of this study, I examined record temperatures. The idea is that as climate change goes on, you can imagine a bell curve shifting (Fig. 1), with crest of the curve representing the average temperature, and the tails of the curve representing the temperature extremes. Thus, as the hypothetical bell curve shifts to the right (toward warmer temperatures), we should ultimately begin to experience more record high temperatures and less record low temperatures. To include all record types, this study not only examined the record high maximum and record low minimum temperatures, but also took into account the record low maximum and record high minimum temperatures. Unlike the first part, the entire period of record (POR) for each site was used, in an effort to have a larger, more robust dataset. As a result, Sioux Falls and Denver's analysis included data from 1890 - 2020, whereas Rapid City's analysis included data from 1940 - 2020. The number of records for each parameter were then summed per decade and then analyzed seasonally and annually for any trends.

Figure 1: Shifting Bell Curve
https://ops.fhwa.dot.gov/publications/fhwahop15026/ch2.htm
Part 1: Temperature and Precipitation Trends between 1970 and 2019
|
January Maximum Temperature Trends |
March Maximum Temperature Trends |
July Maximum Temperature Trends |
Figure 2: Maximum Temperature Trends
In January and March, we see significant increases in maximum temperatures per decade across all three cities. In contrast, the maximum temperatures decreased in July for Sioux Falls while it increased at Rapid City and Denver (Figure 2).
|
January Minimum Temperature Trends |
July Minimum Temperature Trends |
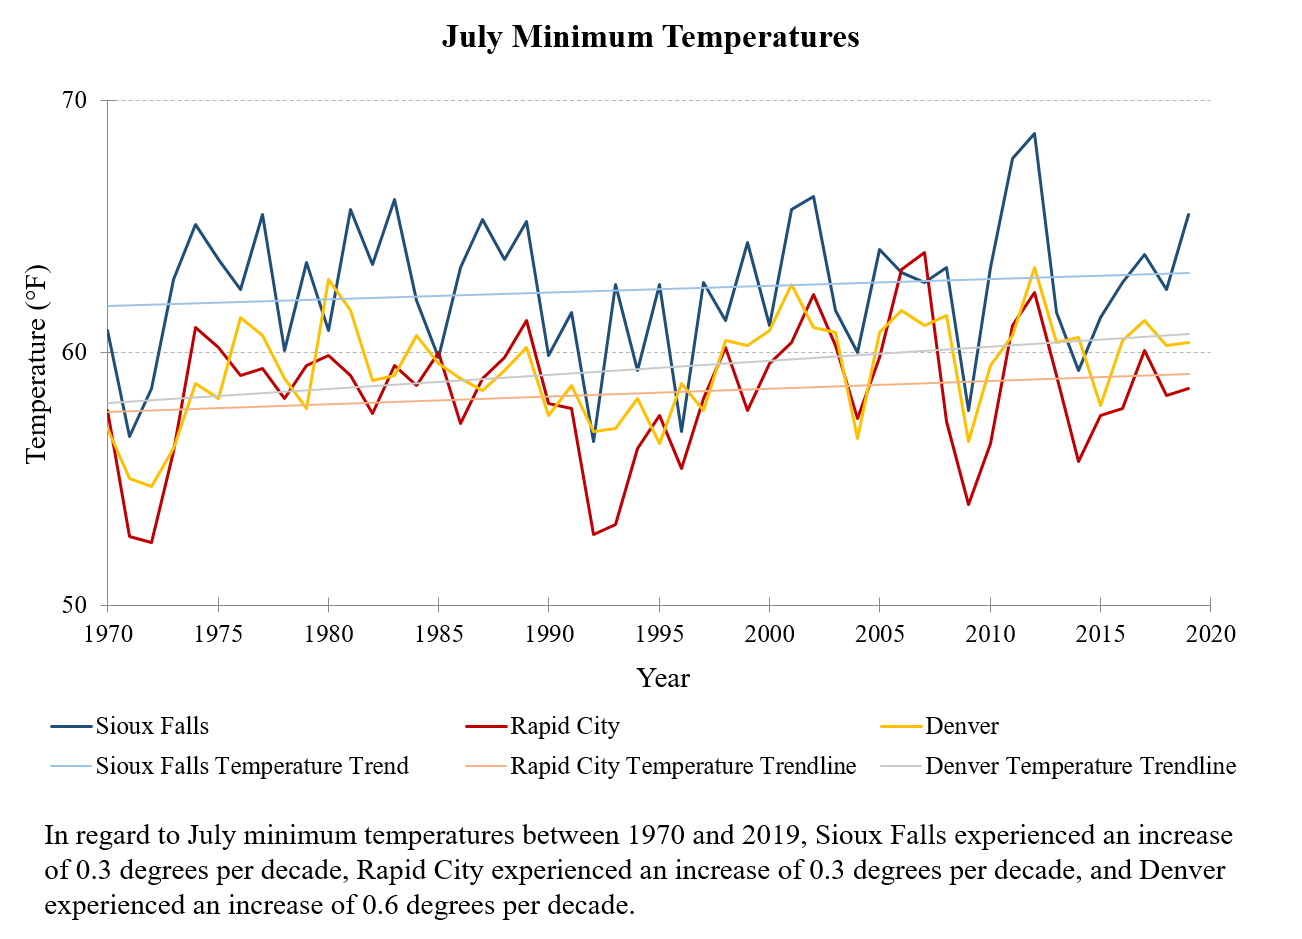
Figure 3: Minimum Temperature Trends
In Figure 3, we see higher minimum temperatures being observed in both the winter and summer, suggesting that less frigid winters and warmer summer nights may becoming more common.
Overall, this study observed that the general trend for Sioux Falls has temperatures increasing during the winter, early spring, and late fall, with temperatures decreasing during the summer. While decreasing summer temperatures may seem backwards and give the idea that global warming is not occurring, we must keep in mind the change in agricultural land use. Given that more corn and soybeans have been planted over the past few decades, it should come as no surprise that temperatures are not as hot as they once were, due to the increased evapotranspiration. Rapid City, on the other hand, is not surrounded by farmland to the extent that Sioux Falls is. Thus, overall temperatures seem to increase during the winter, summer, and fall, with limited change during spring. Conversely, Denver has experienced an overall decrease in temperatures during the winter, with increases being noted during the spring, summer, and fall. It is interesting to note that Denver's temperatures could be perceived as a flattening bell curve – more temperature extremes on both sides. Lastly, when examining trends on an annual level, this study showed that all three cities experienced an overall increase in temperatures.
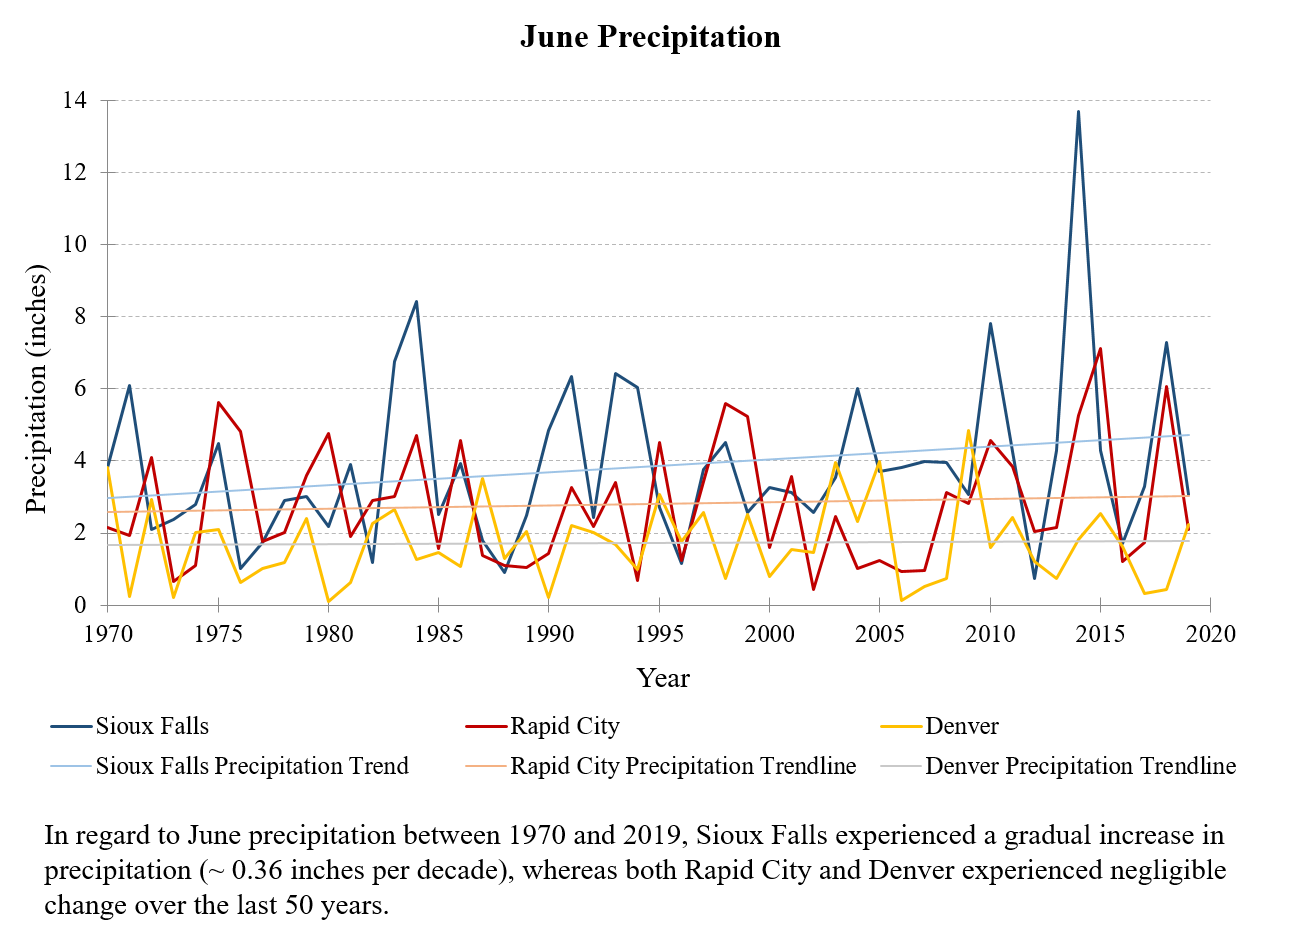
Figure 4: June Precipitation Trends
As you can see in Figure 4, precipitation trends are more difficult to observe. Many factors affect the total precipitation an area receives, so changes can be subtle and sometimes slow to develop. While Sioux Falls saw a slight increase in precipitation in June between 1970 to 2019, Rapid City and Denver experienced negligible change.

Figure 5: Annual Precipitation Trends
However, when we analyze precipitation on an annual scale instead of monthly, we do observe a notable trend for each city. In fact, Figure 5 shows that Sioux Falls and Rapid City both experienced an overall increase in precipitation (1.5 inches and 0.6 inches per decade respectively), whereas Denver experienced an overall decrease in precipitation (0.4 inches per decade).
Part 2: Record Temperatures (POR - 2020)
For the second part of this study, my hypothesis was proven correct for the most part in that maximum high temperatures were increasing and minimum low temperatures were decreasing. In addition, this study determined that minimum high temperatures were decreasing, whereas maximum low temperatures were increasing, though there weren’t always noticeable trends within those two categories.
|
Number of Record High Maximum Temperatures each Decade Rapid City |
Number of Record Low Minimum Temperatures each Decade Rapid City |
Figure 6: Number of Temperature Records each Decade | Rapid City
When looking at my results, I also noticed one interesting feature at Rapid City. As you may recall, I previously mentioned the idea of a flattening bell curve in the results of Part 1, causing more temperature extremes to occur on both sides in Denver. Well, Rapid City appears to support this idea too. As you can see in Figure 6, Rapid City had more record high maximum temperatures and more record low minimum temperatures, which is not what you would expect to see if the curve were simply shifting over. Instead, these results suggest that the curve could be changing shapes entirely.
|
Number of Record High Maximum Temperatures each Decade Sioux Falls |
Number of Record Low Minimum Temperatures each Decade Sioux Falls |
|
Number of Record Low Maximum Temperatures each Decade Sioux Falls |
Number of Record High Minimum Temperatures each Decade Sioux Falls |
Figure 7: Number of Temperature Records each Decade | Sioux Falls
Instead, it was Sioux Falls that best modeled the expected trend, with the overall number of record high maximum temperatures increasing, record low minimum temperatures decreasing, and record high minimum temperatures increasing (Figure 7).
|
Number of Record High Maximum Temperatures each Decade Denver |
Number of Record Low Minimum Temperatures each Decade Denver |
|
Number of Record Low Maximum Temperatures each Decade Denver |
Number of Record High Minimum Temperatures each Decade Denver |
Figure 8: Number of Temperature Records each Decade | Denver
Lastly, the expected trend was also somewhat noted in Denver, with the overall number of record high maximum temperatures increasing and the number of record low minimum temperatures decreasing (Figure 8).
Conclusions
Overall, this study shows that the climate is changing, and that different areas/regions can experience vastly different affects. Sioux Falls, Rapid City, and Denver all shared one thing in common: they each experienced an increase in their annual maximum temperatures between 1970 to 2019 (0.2°F, 0.3°F, and 0.3°F per decade respectively). In regard to annual minimum temperatures between 1970 to 2019, Sioux Falls and Denver both experienced an increase (0.5°F and 0.2°F per decade respectively), whereas Rapid City experienced negligible change. Lastly, in terms of annual precipitation between 1970 to 2019, Sioux Falls and Rapid City both experienced an increase (1.5 inches and 0.6 inches per decade respectively), whereas Denver decreased by 0.4 inches per decade.
Now let's walk through an example of how these changes could impact society. Given that all three cities experienced an increase in maximum temperatures, we'll start there. Overall, a net heat increase causes a greater evapotranspiration rate, or the rate by which water evaporates off of the earth and plants. With more moisture being evaporated into the atmosphere, there will be a higher likelihood of seeing more rain, as high evaporation rates lead to more condensation and thus precipitation. Unfortunately, increased evaporation can cause soils and plants to dry out quicker, which can reduce crop yields for farmers and make forests more vulnerable to fires. On the flip-side, increased precipitation can cause soils to become oversaturated, which can result in higher amounts of runoff and then flooding. This excess water can not only damage underground pipelines, infrastructure, and personal property, but also lead to damaging erosion and potential landslides.
In the Northern Great Plains, we rely heavily on agriculture, and while farmers currently seem to be benefitting from longer growing seasons, it's important to realize that continued increase of temperatures could lead to devastating impacts on livestock, crop yields, and farmer income. In fact, the NCA states that the Northern Great Plains is “home to 7.2% of U.S. farms (152,663) but 23.8% of the U.S. land in farms, encompassing 218 million acres with 22.4% of the total cropland, 21.9% of irrigated lands, 29.3% of U.S. pasture and rangeland, and nearly one-third (30.1%) of lands in conservation/wetland reserve programs.” In addition to this, the NCA also states that the Northern Great Plains "contributes 12.7% of the market value of agricultural products sold in the United States despite having only 1.5% of the U.S. population." Therefore, if climate change continues at its current rate, there could be big impacts not only across our region, but across the entire country as well.
References:
USGCRP, 2018: Impacts, Risks, and Adaptation in the United States: Fourth National Climate Assessment, Volume II [Reidmiller, D.R., C.W. Avery, D.R. Easterling, K.E. Kunkel, K.L.M. Lewis, T.K. Maycock, and B.C. Stewart (eds.)]. U.S. Global Change Research Program, Washington, DC, USA, 1515 pp. doi: 10.7930/NCA4.2018.
Additional Graphs
Part 1: Temperature and Precipitation Trends between 1970 - 2019
Monthly Maximum Temperature Trends
|
January |
February |
March |
April |
|
May |
June |
July |
August |
|
September |
October |
November |
December |
Monthly Minimum Temperature Trends
|
January |
February |
March |
April |
|
May |
June |
July |
August |
|
September |
October |
November |
December |
Monthly Precipitation Trends
|
January |
February |
March |
April |
|
May |
June |
July |
August |
|
September |
October |
November |
December |
Seasonal and Annual Temperature Trends
|
Denver | Winter |
Rapid City | Winter |
Sioux Falls | Winter |
|
Denver | Spring |
Rapid City | Spring |
Sioux Falls | Spring |
|
Denver | Summer |
Rapid City | Summer |
Sioux Falls | Summer |
|
Denver | Fall |
Rapid City | Fall |
Sioux Falls | Fall |
|
Denver | Annual |
Rapid City | Annual |
Sioux Falls | Annual |
Seasonal and Annual Precipitation Trends
|
Denver | Winter |
Rapid City | Winter |
Sioux Falls | Winter |
|
Denver | Spring |
Rapid City | Spring |
Sioux Falls | Spring |
|
Denver | Summer |
Rapid City | Summer |
Sioux Falls | Summer |
|
Denver | Fall |
Rapid City | Fall |
Sioux Falls | Fall |
|
Denver | Annual |
Rapid City | Annual |
Sioux Falls | Annual |
Part 2: Record Temperatures (POR - 2020)
Seasonal Trends
|
High Maximum Temps | Denver |
High Minimum Temps | Denver |
Low Maximum Temps | Denver |
Low Minimum Temps | Denver |
|
High Maximum Temps | Rapid City |
High Minimum Temps | Rapid City |
Low Maximum Temps | Rapid City |
Low Minimum Temps | Rapid City |
|
High Maximum Temps | Sioux Falls |
High Minimum Temps | Sioux Falls |
Low Maximum Temps | Sioux Falls |
Low Minimum Temps | Sioux Falls |
Annual Trends
|
High Maximum Temps | Denver |
High Minimum Temps | Denver |
Low Maximum Temps | Denver |
Low Minimum Temps | Denver |
|
High Maximum Temps | Rapid City |
High Minimum Temps | Rapid City |
Low Maximum Temps | Rapid City |
Low Minimum Temps | Rapid City |
|
High Maximum Temps | Sioux Falls |
High Minimum Temps | Sioux Falls |
Low Maximum Temps | Sioux Falls |
Low Minimum Temps | Sioux Falls |
 |
Media use of NWS Web News Stories is encouraged! Please acknowledge the NWS as the source of any news information accessed from this site. |
|


 Weather Story
 Weather Map
 Local Radar