Kansas City Daily Climate Extremes and Normals*
January 1889-Present*
* Normals are computed from 1991-2020 time frame.
* Last updated 5/13/2022
| Date | Max Temp | Year | Normal Max | Min Temp | Year | Normal Min | Max Precip | Year | Max Snow | Year | Normal Precip |
|---|---|---|---|---|---|---|---|---|---|---|---|
| 1 | 64 | 1897 | 39 | -13 | 1974 | 21 | 1.56 | 1892 | 3.5 | 1948 | 1.16 |
| 2 | 67 | 1939 | 39 | -11 | 1979 | 20 | 0.94 | 1897 | 6.0 | 1947 | Avg Snowfall |
| 3 | 65 | 1997 | 39 | -13 | 1919 | 20 | 1.39 | 1971 | 5.0 | 1973 | 4.9 |
| 4 | 66 | 1939 | 39 | -10 | 1947 | 20 | 1.23 | 1946 | 3.9 | 1910 | |
| 5 | 68 | 1956 | 38 | -15 | 1924 | 20 | 1.20 | 1946 | 10.1 | 1962 | |
| 6 | 64 | 1939 | 38 | -13 | 1912 | 20 | 0.45 | 1916 | 5.0 | 1916 | |
| 7 | 70 | 1907 | 38 | -11 | 1912 | 20 | 1.74 | 1937 | 3.3 | 1926 | |
| 8 | 71 | 2003 | 38 | -10 | 1979 | 20 | 0.41 | 1930 | 4.8 | 1930 | |
| 9 | 66 | 2020 | 38 | -10 | 1977 | 20 | 1.07 | 1929 | 9.5 | 1993 | |
| 10 | 65 | 1911 | 38 | -17 | 1982 | 19 | 1.36 | 2020 | 7.2 | 2011 | |
| 11 | 65 | 1960 | 38 | -16 | 1918 | 19 | 0.68 | 1949 | 3.7 | 2020 | |
| 12 | 69 | 1960 | 38 | -20 | 1912 | 19 | 1.33 | 1910 | 4.5 | 1964 | |
| 13 | 68 | 1996 | 38 | -14 | 1916 | 19 | 0.59 | 1940 | 6.2 | 1927 | |
| 14 | 69 | 1952 | 38 | -10 | 1979 | 19 | 0.60 | 1962 | 5.8 | 1962 | |
| 15 | 66 | 2006 | 38 | -10 | 1979 | 19 | 0.60 | 1889 | 4.3 | 1898 | |
| 16 | 69 | 1952 | 38 | -13 | 1977 | 19 | 1.07 | 1941 | 2.5 | 2008 | |
| 17 | 67 | 1894 | 38 | -12 | 1978 | 19 | 0.43 | 1931 | 4.0 | 1987 | |
| 18 | 70 | 1951 | 38 | -12 | 1940 | 19 | 0.96 | 1907 | 11.8 | 1962 | |
| 19 | 66 | 1906 | 38 | -17 | 1892 | 19 | 1.25 | 1907 | 7.0 | 2011 | |
| 20 | 69 | 1906 | 38 | -14 | 1985 | 19 | 2.02 | 1916 | 4.3 | 1959 | |
| 21 | 71 | 1957 | 38 | -6 | 1935 | 19 | 1.02 | 1958 | 10.5 | 1958 | |
| 22 | 70 | 1967 | 38 | -10 | 1930 | 19 | 0.91 | 1965 | 6.8 | 1898 | |
| 23 | 73 | 1967 | 38 | -9 | 2003 | 19 | 1.70 | 1938 | 4.6 | 1939 | |
| 24 | 75 | 1950 | 39 | -15 | 1894 | 19 | 0.32 | 1924 | 2.2 | 1956 | |
| 25 | 64 | 2018 | 39 | -11 | 1905 | 19 | 0.94 | 1898 | 6.2 | 1991 | |
| 26 | 67 | 2006 | 39 | -10 | 1940 | 19 | 1.36 | 1916 | 5.9 | 1967 | |
| 27 | 70 | 1934 | 39 | -9 | 1940 | 20 | 1.07 | 1995 | 5.0 | 1997 | |
| 28 | 74 | 2013 | 39 | -14 | 1997 | 20 | 0.76 | 2001 | 3.0 | 2005 | |
| 29 | 68 | 2013 | 39 | -7 | 1977 | 20 | 1.82 | 1982 | 4.0 | 1956 | |
| 30 | 68 | 1890 | 39 | -7 | 1918 | 20 | 1.37 | 1999 | 2.0 | 1985 | |
| 31 | 70 | 2009 | 40 | -10 | 1985 | 20 | 0.99 | 2015 | 4.0 | 1981 |


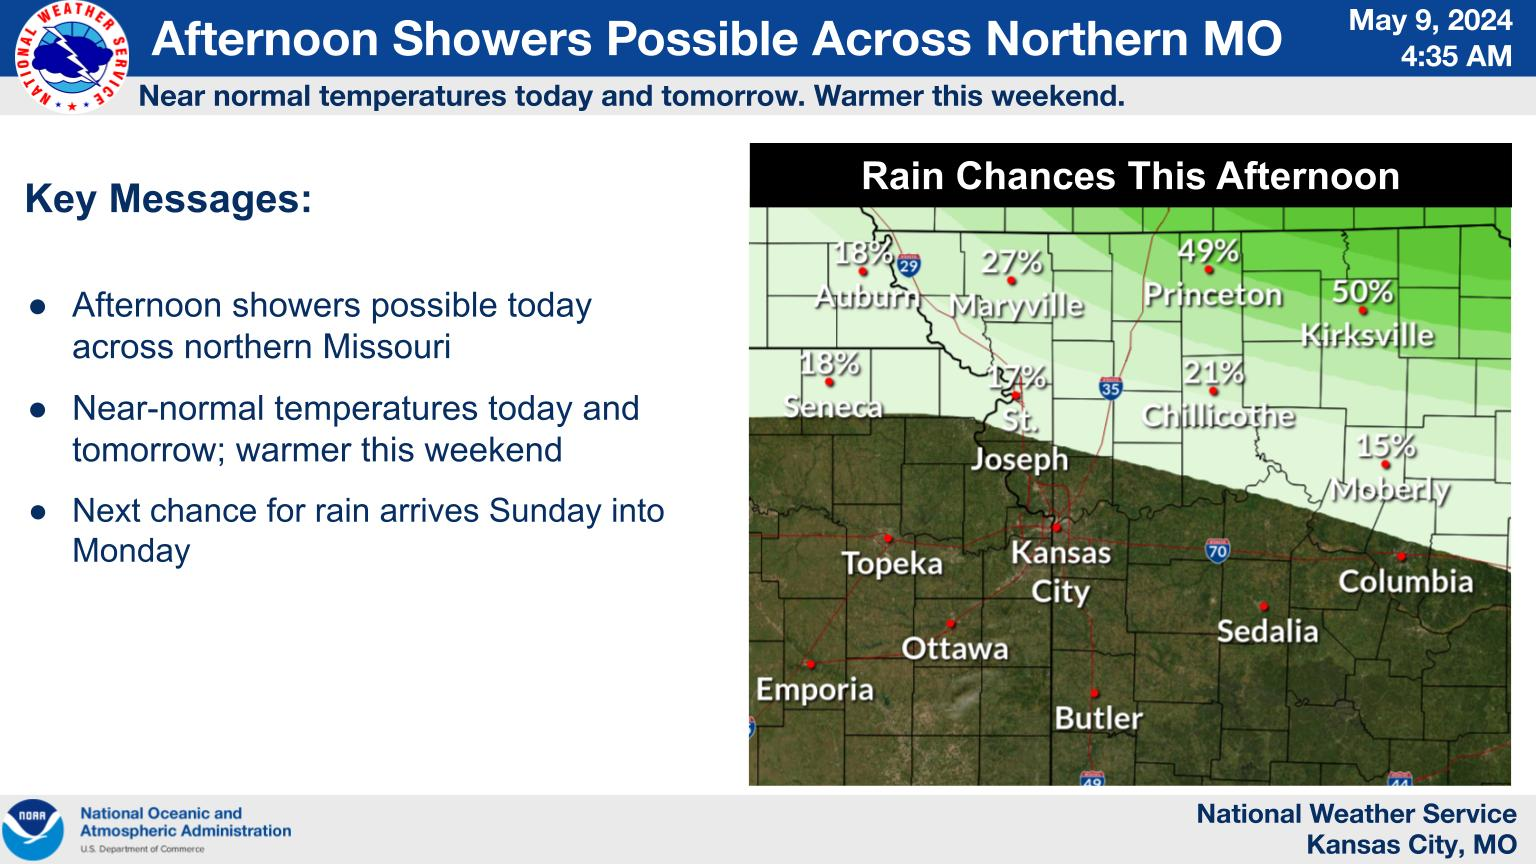 Weather Story
 Weather Map
 Local Radar