National Weather Service United States Department of Commerce


2015 Atlantic Hurricane Season Review
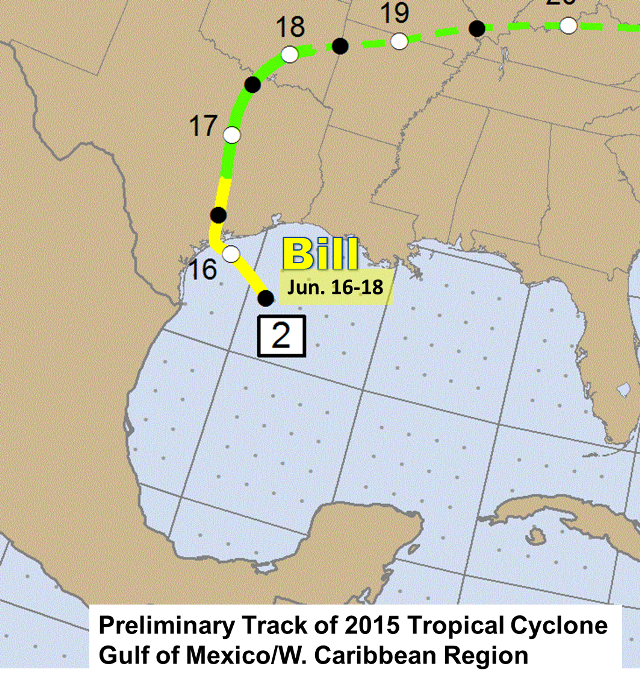
Preliminary 2015 Hurricane Season tracks for the Gulf of Mexico (click to enlarge)
Preliminary 2015 Hurricane Season tracks across the Gulf of Mexico and western Caribbean Sea.

Atlantic Basin: El Niño Did The Job
Seasonal Forecast Spot On; Joaquin Big Story and Bill the Texas Story
Valley’s Tropical Cyclone Impact "Drought" Continues for Fifth Year in Row
 

Overview
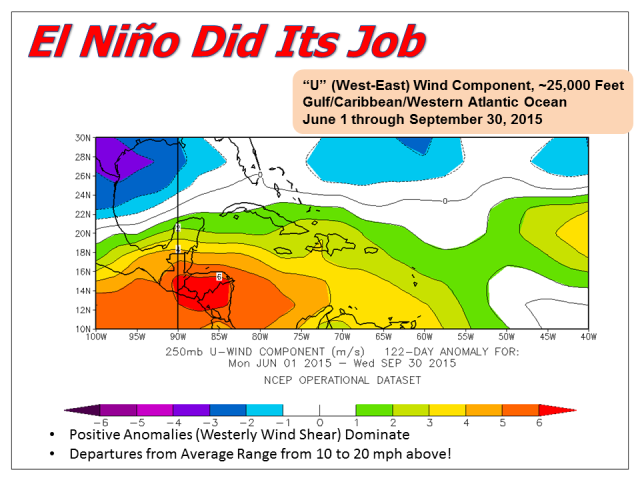
The 2015 Atlantic Hurricane Season was forecast to be slightly below average, and after a 2014 where a very successful forecast was pitch perfect, there was much to live up to in 2015. The well–forecast rapid development of one of the strongest El Niño’s on record paid dividends with an overall meek Atlantic basin season. For the third year running, 2015 saw little or impact to the large and growing coastal population of the U.S. Gulf and Atlantic coasts. Nonetheless, there were some noteworthy highlights from the season.

The season got off to a quick start, with Tropical Storm Ana setting an Atlantic Season record when making landfall near Myrtle Beach, SC, on May 10th! Ana was fed by unusually warm waters along the Southeast U.S. coast and the Gulf Stream. June featured the only cyclone to develop in the Caribbean or Gulf of Mexico – Tropical Storm Bill – and even he was a struggling wave that was able to take advantage of a sliver of low wind shear and favorable moisture to quickly intensify to a 60 mph system before making landfall near Matagorda Island, TX, on June 17. Bill achieved tropical storm status 200 miles east of the King Ranch, but the Rio Grande Valley had no direct impacts with landfall. However, residual moisture left behind Bill’s circulation aided torrential rains and flooding from Hebbronville to Falfurrias on June 17/18. Torrential rains were by far the memorable impact from Bill in South Central Texas and Oklahoma, with millions in damage and two flood deaths in Oklahoma. The full report on Bill can be found here.

The season’s first major (Category 3 wind) storm, August’s Hurricane Danny, was a "rags–to–riches–to–rags" story. Tiny Danny rapidly intensified to Category 3 over the open waters well east of the Leeward Islands, but after rising like a bullet he fizzled quickly, courtesy of El Niño’s robust high level wind shear and nearby dry air near the Islands; Danny soon dissipated with minimal impact. Tropical Storm Erika struggled to survive wind shear, but her source moisture combined with passage across the Leeward Islands in late August left perhaps the most devastating land damage of the entire season, with more than two dozen deaths and tens of thousands of homes flooded or washed away in floods and mudslides across Dominica. Erika’s moisture shield produced additional flooding across Puerto Rico and Hispañola. Fred formed quickly from a tropical wave just west of Guinea (Africa) at the end of August, and strengthened to a hurricane before reaching the Cape Verde Islands, a very rare event. Category 1 Fred prompted the first hurricane warnings in Cape Verde, and losses totaled more than $1 million – even though the rainfall was beneficial in a region that had been flirting with drought. Storm surge flooding inundated coastal Senegal (west Africa).

The season's biggest story came a month later, when Category 4 Hurricane Joaquin exploded to life on October 1 from a tropical storm just 36 to 42 hours earlier (early on September 30). Joaquin ravaged the central and southern Bahamas on the 1st and 2nd, with hundreds of people trapped due to wind damage, storm surge, and rainfall flooding. Final data were unavailable as of this writing (see table below for preliminary values). The most devastating story from Joaquin was the sinking of the El Faro cargo ship, which left Jacksonville destined for San Juan, Puerto Rico, and was caught in the intensifying maelstrom over the central Bahamas. After seven days of searching, the U.S. Coast Guard called off the hunt; the wreckage was discovered in November. Thirty-three crew perished, making the sinking the single–most direct deadly event from the Atlantic season. Joaquin proved again that it only takes one cyclone to make a season, even if the season is quiet. Joaquin was the storm that found the proverbial "crack in the door" during a season fraught with wind shear and dry air. His motion to the southwest rather than the west placed the cyclone into a "pocket" of low wind shear, very warm ocean, and high moisture – the necessary ingredients for rapid strengthening. A plume of moisture from Joaquin energized a vigorous upper level disturbance that moved into South Carolina, enhancing rainfall to more than 24 inches in some locations and leaving more than $1 billion in damage.

After Joaquin, the 2015 Atlantic Hurricane Season would wind down uneventfully, with late season Kate initially developing in the warm waters between the Southeast U.S. coast and Bermuda, and becoming a Category 1 hurricane well east of the mid Atlantic coast in mid November. Joaquin was not enough to turn the screws on the Accumulated Cyclone Energy Index, or ACE, which also ended up right in line with the forecast: 59 units, or a little over 63% of the average (93.2 units based on 1951 to 2000 data).
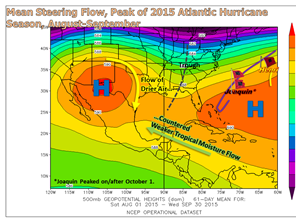
Average 500 mb geopotential height for the tropical western Atlantic and Gulf during the peak of the 2015 hurricane season (click to enlarge)
General steering patterns for the peak of the 2015 Hurricane Season (August to October; click to enlarge).
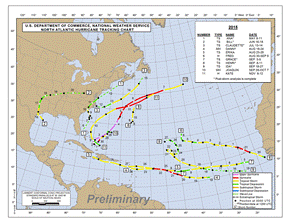
Preliminary 2015 Atlantic hurricane season track map (click to enlarge)
Preliminary 2015 Hurricane Season track, entire Atlantic basin (click to enlarge).
Preliminary eastern Pacific tropical cyclone tracks, 2015 season
Preliminary Tracks of Eastern Pacific Hurricanes, 2015 Season.

Eastern Pacific: Busy, Busy, Busy...Again
Patricia Becomes Memorable for RGV
 

While the Atlantic basin struggled to launch, the Eastern Pacific exploded. El Niño’s persistent and very warm waters (see loop below), low wind shear, and abundant deep tropical moisture combined to produce a similarly active season along and west of Mexico and Central America, compared with 2014. Nearly every storm spun out into the open ocean (above), but a few did not: Most memorably, Hurricane Patricia (October 20 to 24) became the most intense hurricane, pressure-wise (879 mb) ever recorded in the Western Hemisphere on October 23.

Carrying peak sustained winds of 200 mph in a pinhole eye roughly 8 miles wide, Patricia tracked northward into Jalisco (state), Mexico during the afternoon of October 23. Interaction with land, as well as approaching wind shear and perhaps the onset of an eyewall replacement weakened Patricia a bit just prior to landfall in rural Jalisco (near Cuixmala), but the weakening was not enough to take the intensity below Category 5, making Patricia only the second Category 5 landfall on record in Mexico (since 1959) and the first North American Category 5 landfall since Hurricane Andrew in south Miami–Dade County, Florida, in August 1992. While Mexico’s impacts were impressive, good fortune and the small size of the Hurricane’s core combined to reduce the relative impacts. Devastating impacts were confined largely to rural and agricultural regions of Jalisco, Aguascalientes, and Nayarit; the high peaks of the Sierra Madre Occidental rapidly killed off the intensity of the cyclone early on the 24th. As of early December, damage in Mexico – mainly to rural communities and growing areas – was at least $320 million.

Though the intensity of Patricia ended across western Nuevo León south of Monterrey, the impacts were just beginning for the Rio Grande Valley. While the Valley missed an Atlantic basin impact, few from Weslaco to Willacy will forget the name Patricia as the event of autumn 2015. As Patricia’s remnant circulation interacted with a frontal system and upper trough moving into the Rio Grande Valley, bands of tropical torrents dumped between 4 and 14 inches across large swaths of the Rio Grande Valley, with peak rainfall in two locations: the rural ranchlands of western Starr/eastern Zapata/southern Jim Hogg County, where estimated of 4 to 8 inches fell, and from Weslaco to Willacy County in the Lower and Mid Valley. An estimated 10 to 14 inches fell between Progreso and Weslaco, with more than 500 homes impacted by flooding; 2 to 8 inches fell to the northeast, from Elsa/Edcouch through Santa Rosa into Raymondville and rural central Willacy County, exacerbating flooding that began with a separate event on October 22. Hidalgo and Willacy would ultimate be included into a Federal Disaster Declaration in late November, 2015. Estimated dollar damage across Texas from the frontal system, injected with the remains of Patricia, is likely to exceed $3 billion. A full local report on events of October 22 through 24 for the Valley, the last which were related to Patricia, can be found here.

Other notable stories to the Eastern Pacific Hurricane Season in 2015 included Hurricane Olaf, which became the first known tropical cyclone to pass from the Eastern Pacific into the Central Pacific (where the Hawaiian Islands are located) and back to the Eastern Pacific Basin before dissipating. At the time, Olaf was undergoing rapid weakening while gaining latitude and coming under the influence of a deepening non–tropical upper level trough. Despite the half–dozen or so cyclones (most of them hurricanes, four of them Majors) moving into the Central Pacific basin, Hawaii fortunately had no direct impacts from storm surge, widespread flooding rain, or wind.

Average 500 mb geopotential height for the tropical western Atlantic and Gulf, October 15-30, 2015 (click to enlarge)
General steering patterns for October 15 to 30, 2015. The location of the subtropical high pressure ridge (blue H) in the southern Gulf, "poking" into the southeastern U.S., combined with the trough of low pressure across the southwest Four Corners region into Baja California, helped steer the remnants from Hurricane Patricia toward the Rio Grande Valley. (click to enlarge).

August to early December 2015 western hemisphere sea surface temperature anomalies (click to enlarge)
Loop of Tropical Sea Surface Temperature Anomalies, for August through early December, 2015. Reds and Orange colors indicate significantly above average values; darker blues and purples significantly below average. Note the persistent warm waters west of Mexico and Central America, compared with near to below average across the tropical Atlantic (between Africa and the Caribbean Islands).
250 mb wind anomalies for June 1 through September 30, 2015, across the Tropical Gulf of Mexico, Caribbean, and western Atlantic (click to enlarge)
 

Fast Facts – Atlantic
NOAA’s May 2015 Atlantic Hurricane Outlook forecast 6 to 11 named storms, 3 to 6 hurricanes, zero to 2 major hurricanes, and an Accumulated Cyclone Energy (ACE) Index Range of 40 percent to 100 percent of average. The preliminary results:

  • 11 named cyclones
  • 7 tropical storms
  • 4 hurricanes
  • 2 major hurricanes
  • ACE estimate: 59, or 63.3 percent of average (93.2)


Fast Facts – Pacific
NOAA’s May 2015 Eastern Pacific Hurricane Outlook forecast 15 to 22 named storms, 7 to 12 hurricanes, 5 to 8 major hurricanes, and an Accumulated Cyclone Energy (ACE) Index Range of 110 percent to 190 percent of average. The preliminary results:

  • 18 named cyclones
  • 5 tropical storms
  • 13 hurricanes
  • 10 major hurricanes
  • ACE estimate: 251, or 193 percent of average (130)


The following table summarizes the 2013 Atlantic Hurricane Season.

Preliminary 2014 Atlantic Hurricane Season Statistics
Tropical Storm Ana   May 8-11 60 998 Minimal 2.28
Tropical Storm Bill   June 16-18 60 997 17.9 1.027
Tropical Storm Claudette 1 July 13-14 50 1003 None 1.13
Hurricane Danny 3 August 18-24 115 974 None 9.20
Tropical Storm Erika   August 25-29 50 1003 511.7 2.94
Hurricane Fred 1 August 30-September 6 85 986 1.1 5.65
Tropical Storm Grace   September 5-9 60 1000 None 1.73
Tropical Storm Henri   September 8-11 50 1003 None 0.86
Tropical Depression 9   September 16-19 35 1006 None 0
Tropical Storm Ida   September 18-27 50 1001 None 3.385
Hurricane Joaquin 4 September 28-October 8 155 931 60+ 28.35
Hurricane Kate 1 November 9-12 75 983 Minimal 3.42
Totals         >590 59
 

For final details on the 2015 Atlantic Hurricane Season, check the National Hurricane Center’s Atlantic Season Archive. Updates to the archive will be available through December and into 2016 as reports are generated and data are finalized.