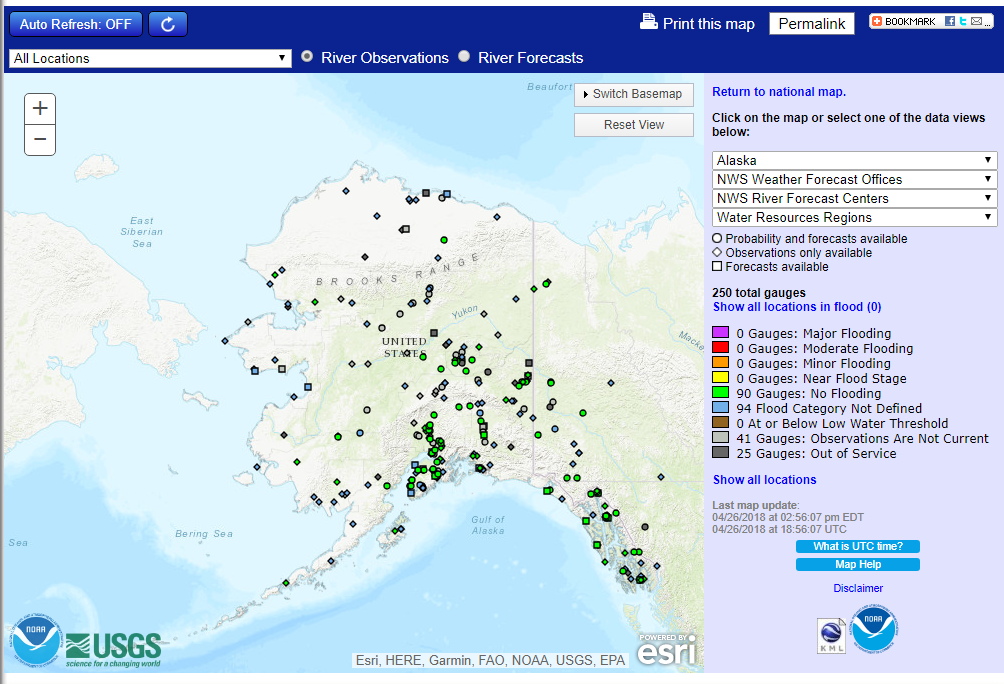
Advanced Hydrologic Prediction Service (AHPS)
AHPS provides a suite of river and flood forecasts and water information to protect life and property and helps ensure the nation’s economic well-being. water.weather.gov
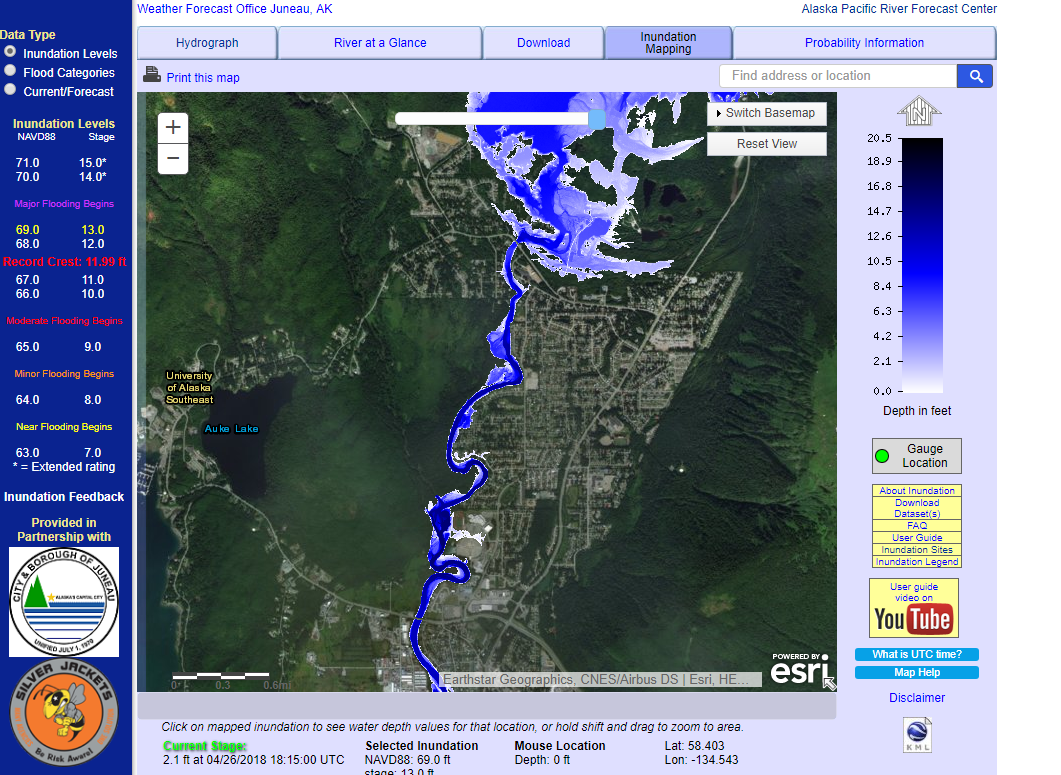
Flood Inundation Mapping
The ability to look into the future to see how many city blocks and roads might be flooded is becoming clearer with flood inundation mapping. NOAA’s NWS and National Ocean Service are collaborating with the USGS, USACE, FEMA and other partners to develop these inundation maps for flooding.
https://water.weather.gov/ahps/inundation.php
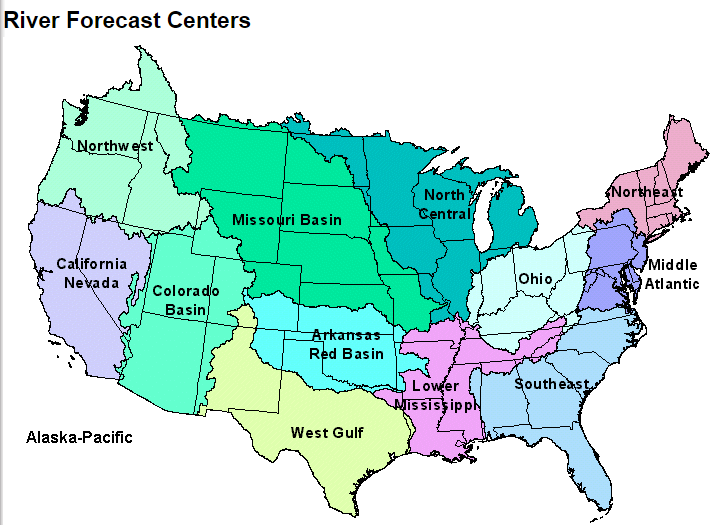
NWS River Forecast Centers (RFCs)
The National Weather Service has a network of thirteen RFCs across the United States. These RFCs collect, process, and provide water resource and river forecasts and information for major river basins across the country. https://water.weather.gov/ahps/rfc/rfc.php
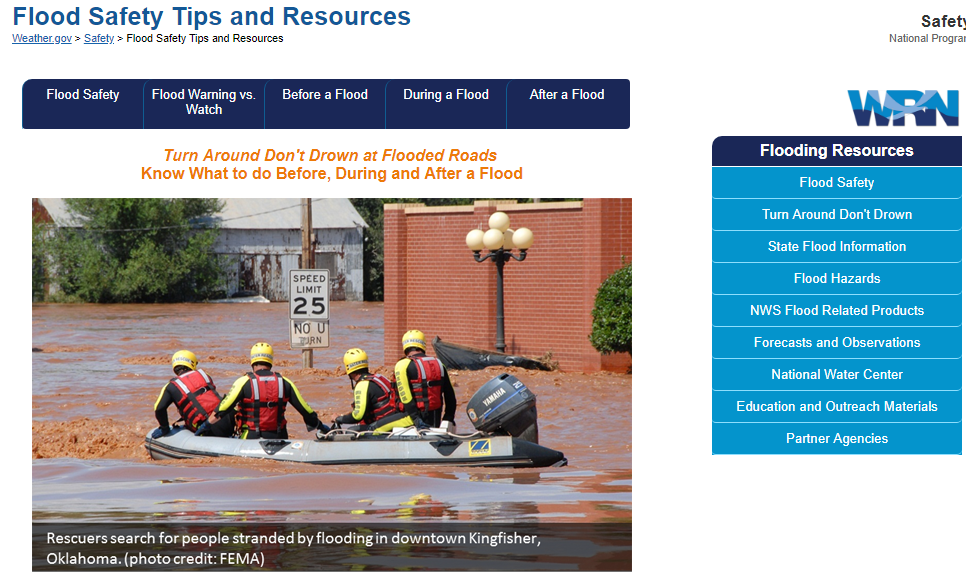
Flood Safety Awareness Website
On this page, you will find information on what to do before, during and after a flood. www.floodsafety.noaa.gov
Staying aware of an evolving weather situation can help you prepare when flooding or other weather hazards impact your area. Be a Force of Nature!
https://www.weather.gov/wrn/
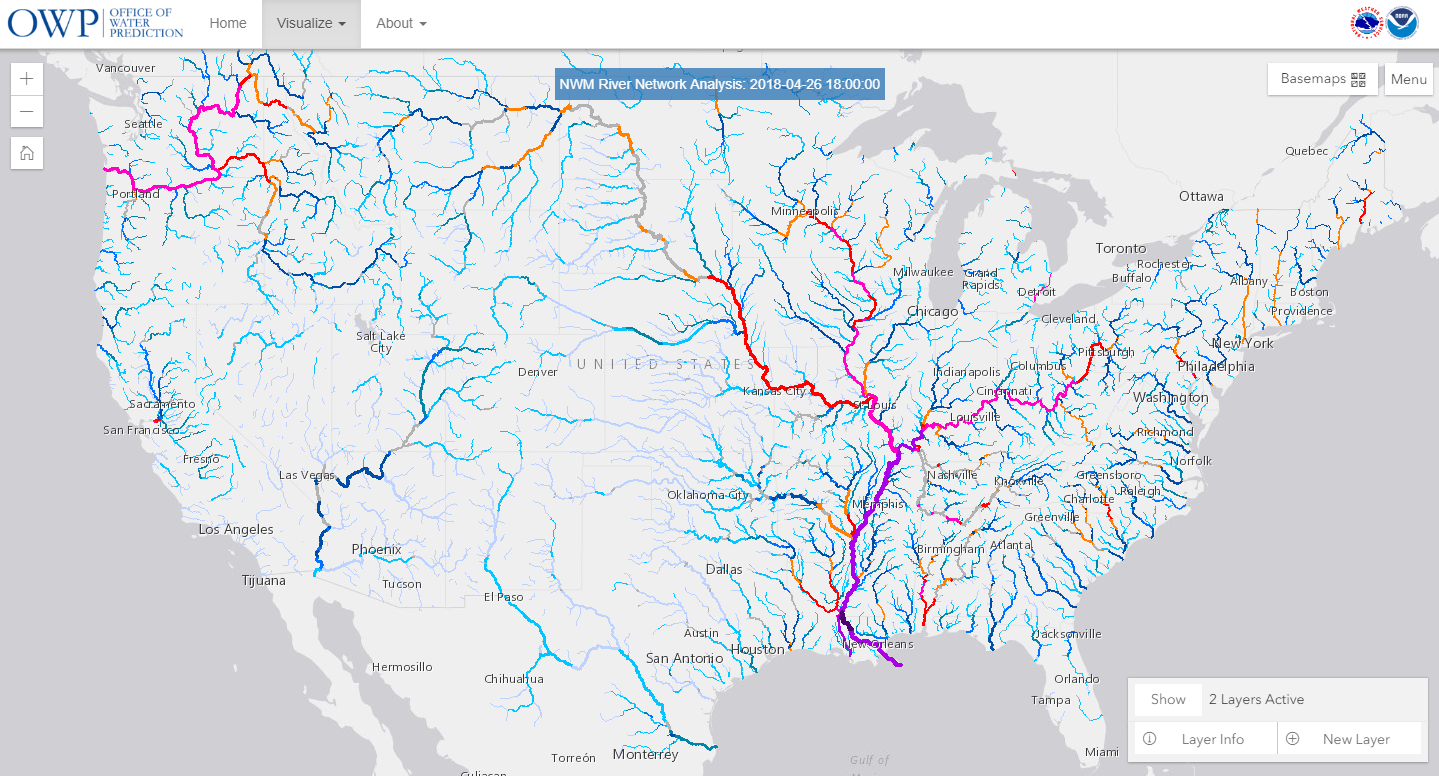
Office of Water Prediction
The Office of Water Prediction (OWP) collaboratively researches, develops and delivers state-of-the-science national hydrologic analyses, forecast information, data, decision-support services and guidance to support and inform essential emergency services and water management decisions. In partnership with NWS national, regional, and local offices, the OWP coordinates, integrates and supports consistent water prediction activities from global to local levels. https://water.noaa.gov/
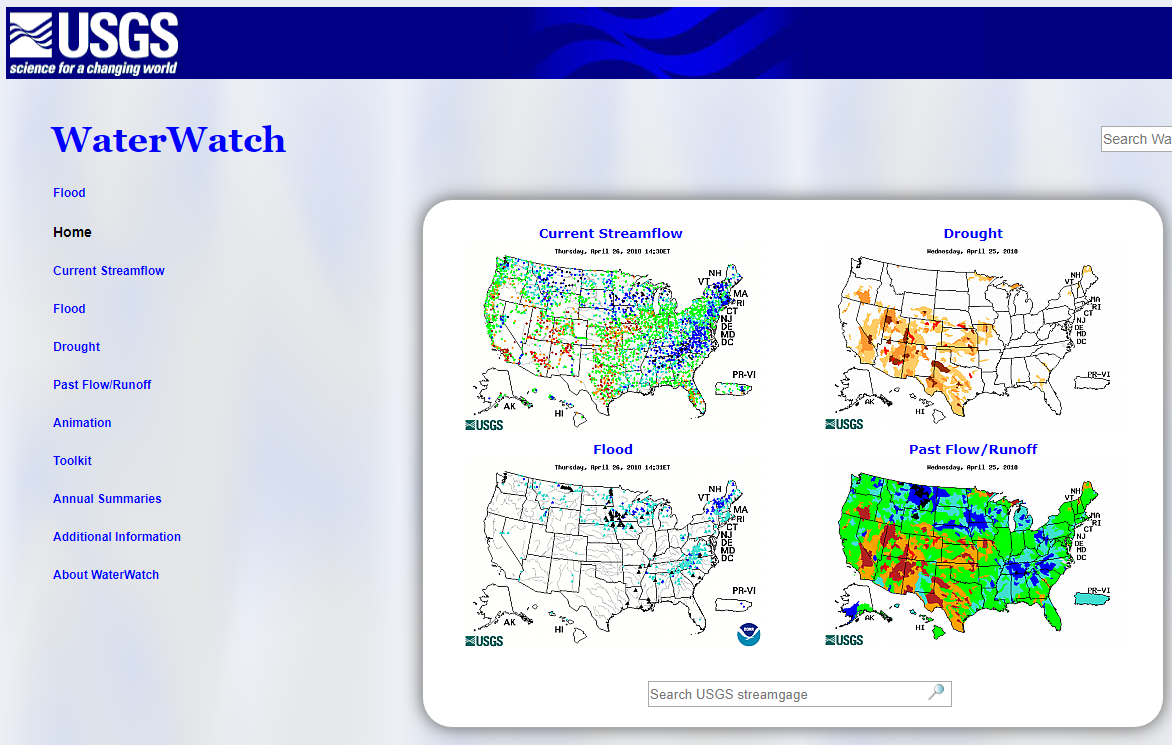
USGS WaterWatch is a U.S. Geological Survey (USGS) World Wide Web site that displays maps, graphs, and tables describing real-time, recent, and past streamflow conditions for the United States. The real-time information generally is updated on an hourly basis. WaterWatch provides streamgage-based maps that show the location of more than 3,000 long-term (30 years or more) USGS streamgages; use colors to represent streamflow conditions compared to historical streamflow; feature a point-and-click interface allowing users to retrieve graphs of stream stage (water elevation) and flow; and highlight locations where extreme hydrologic events, such as floods and droughts, are occurring. http://waterwatch.usgs.gov
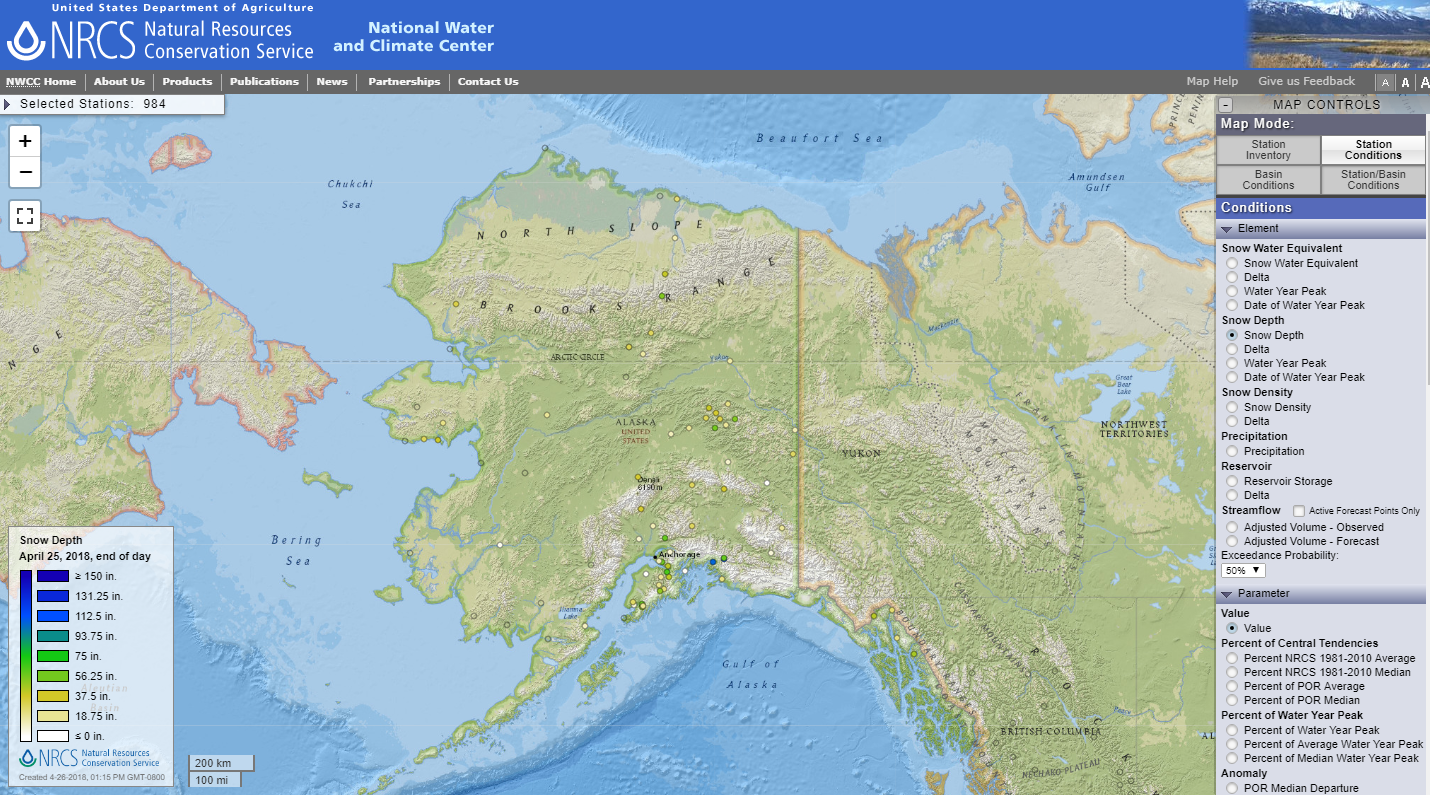
NRCS Snotel Interactive Map
The National Water and Climate Center's Interactive Map displays both current and historic hydrometeorological data in an easy-to-use, visual interface. The information on the map comes from many sources. Natural Resources Conservation Service snowpack and precipitation data are derived from manually-collected snow courses and automated Snow Telemetry (SNOTEL) and Soil Climate Analysis Network (SCAN) stations. Other data sources include precipitation, streamflow, and reservoir data from the U.S. Bureau of Reclamation (BoR), the Applied Climate Information System (ACIS), the U.S. Geological Survey (USGS), and other hydrometeorological monitoring entities. https://www.wcc.nrcs.usda.gov/webmap_beta/

