 |
 |
 |
Our forecast operations run 24 hours a day, 7 days a week. We issue two forecast packages a day, at 5 a.m. and 4 p.m. local time. These forecast packages include public zone forecasts, marine forecasts for the offshore region and coastal waters, and any watches and warnings for hazardous weather. For the aviation community, we issue Terminal Aerodrome Forecasts (TAFs) for 10 locations in our region. These are issued four times a day, at 06, 12, 18 and 24/00 hours Universal Time Coordinated (UTC), also known as Greenwich Mean Time (GMT) or Zulu time. We also issue a number of other products throughout the day, including Area Forecast Discussions, Public Information Statements, Regional Weather Roundups, and Short Term Forecasts. We are constantly monitoring the weather and updating our products to provide the best possible service and most up-to-the-minute information.

The operations area is where our forecasters perform most of their daily tasks. Duties performed here include the issuance of severe weather warnings and forecasts for our warning area, and our marine zones. Meteorologists work with a plethora of computer screens to use a variety high-tech tools to prepare the forecast.
Using Computers is Critical to our Operations
Our staff includes highly trained scientists and technicians who use computer technology to record, monitor, and disseminate weather information to our users. Our scientific staff consists of 3 managers that are trained meteorologists, 5 senior meteorologists, 9 general meteorologists, 1 Observation Program Leader, and 1 Senior Service Hydrologist. Our support staff includes 4 electronics technicians, an information technology specialist, and an administrative assistant.
 Shown to the right, one of our forecasters works to issue a weather forecast by reviewing data and graphics generated by a handful of different computer models. Some of these models are created on supercomputers at a government facility, using current weather data gathered by automated weather equipment at the ground and by weather balloons that gather data at many different levels of the atmosphere. After the model review is complete, our meteorologists draw maps of what they predict the weather conditions will be hour by hour out to 7 days in the future. Below are some examples of these maps.
Once the forecast has been decided upon by enhancing data from the latest computer model runs, our meteorologists draw their weather predictions on several different weather element maps located in a database on the workstation. Then the maps are sent out via the world wide web and satellite uplinks for use by our customers.
The examples below show a sky cover map (below left...darker gray represents more clouds) and Probability of Precipitation (PoP) (ranging from 10% PoP in tan colored areas to 100% PoP in dark green areas). It's easy to see on these maps which areas will have more sun than others and which areas will see the greater chance of precipitation. Many customers find these maps easier to use than reading the traditional text version of the forecast. Weather forecast maps that are available include maximum and minimum temperatures, hourly temperatures, sky coverage, probability of precipitation, type of precipitation, wind speed and direction, dew point, amount of rainfall, snow level, and snow amounts.


 These forecast maps are available on a nationwide scale as well. NWS forecast offices from across the country send their weather map database to a Silver Spring, Maryland computer center so they can be combined into a nationwide composite. The nationwide composites are useful for travelers, national media, and other companies that need weather data from across the country. The map of forecast high temperatures across Alaska is shown to the left. Click here to go directly to the web site where the nationwide maps are posted.
How do we use the weather data maps we create?
In the past, our meteorologists had to type text versions of our forecasts word by word into a word processing program. This was a large job due to the wide range of forecasts our office issues and the large area we serve. In addition, we had to compare our text forecasts in draft form over our computer system with surrounding NWS offices to make sure the forecasts on our borders matched up with their forecasts. This forecast was then sent via modem to the weather wire, Internet, and our NOAA All Hazards Radio computer to reach our customers.
With the advent of computer-based weather forecast maps, coordination with surrounding NWS offices is now done by comparing colorful data maps on our computer screens. Issuing text forecasts is now done by generating the words automatically by our computer system using the weather data maps our meteorologists created. The computer looks at the appropriate weather maps stored in our database, creates the words and numbers for the forecast text, then sends the forecast to a word processing screen that allows us to make any needed edits. Then the forecast is sent out to our users.
Our customers have the option of viewing our forecasts in graphical form and in the traditional text form. The weather data maps also allow us to put together a forecast based on the needs of our user versus a standard format. If a customer is interested seeing a forecast of hourly temperatures, humidity, and precipitation probability at a specific remote location, they can zoom in on the map and click to get the latest forecast.
AWIPS 
The display and telecommunication network called the Advanced Weather Interactive Processing System (AWIPS) is the centerpiece of National Weather Service operations. AWIPS is an interactive, versatile computer system that integrates all meteorological, hydrological, satellite, and radar data into one computer workstation. AWIPS allows forecasters the interactive capability to view, analyze, combine, and manipulate large amounts of graphical and alphanumeric weather data. AWIPS provides a very efficient and effective means for forecasters to prepare and issue timely and accurate forecasts and warnings.
There are two main weather software packages in AWIPS - Display Two Dimensions (D2D) and Graphical Forecast Editor (GFE). D2D is a graphical software application that incorporates most available weather information into an easy-to-use interface for analysis. GFE is the on-screen editor that allows forecasters to create detailed graphical depictions of coming weather, which forms the basis for all of our text products and graphical products.
BMH
The Broadcast Message Handler (previously Console Replacement System (CRS)) is a separate function within AWIPS that automatically translates and schedules written National Weather Service forecasts and warnings into synthesized-voice broadcasts over NOAA Weather Radio. The automated broadcast programs for NOAA Weather Radio frees NWS staff to spend more time on critical warning and forecasting duties. In addition, the automatic weather broadcast provide a more efficient means of disseminating severe weather watches, warnings, and emergency information over all-hazards NOAA weather radio.

Although it is typically automated, the NOAA Weather Radio All Hazards (NWR) program can be interrupted with live broadcasts as needed. In the photo to the left, an employee records a live message using the previous CRS system.
NWR is a nationwide network of radio stations broadcasting continuous weather information directly from the nearest National Weather Service office. NWR broadcasts official Weather Service warnings, watches, forecasts and other hazard information 24 hours a day, 7 days a week.
Working with the Federal Communication Commission's (FCC) Emergency Alert System, NWR is an "All Hazards" radio network, making it your single source for comprehensive weather and emergency information. In conjunction with Federal, State, and Local Emergency Managers and other public officials, NWR also broadcasts warning and post-event information for all types of hazards - including natural (such as earthquakes or avalanches), environmental (such as chemical releases or oil spills), and public safety (such as AMBER alerts or 911 Telephone outages).
Known as the "Voice of NOAA's National Weather Service," NWR is provided as a public service by the National Oceanic and Atmospheric Administration (NOAA), part of the Department of Commerce. NWR includes 1,000 transmitters, covering all 50 states, adjacent coastal waters, and all the U.S. Territories. NWR requires a special radio receiver or scanner capable of picking up the signal. Broadcasts schedules for SE are available here and are found in the VHF public service band at these seven frequencies (MHz):
| 162.400 | 162.425 | 162.450 | 162.475 | 162.500 | 162.525 | 162.550 |
Radar
Most people are familiar with the "reflectivity" data which a radar produces. This data is the colorful picture most people see on TV and on the internet that shows where the storms are and how strong they are. Another useful product a radar produces is "velocity" or Doppler data which shows which way the winds are blowing in relation to the radar beam.
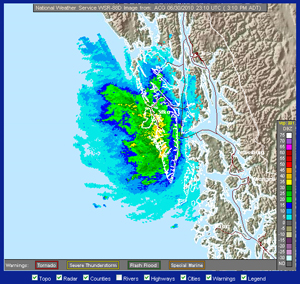 WSR 88D - Weather Surveillance Radar 88 Doppler (the 88 refers to the year 1988 when the system was commissioned). Commonly called NEXRAD, which stands for the next generation of weather radar, is used to warn the people of the United States about dangerous weather and its location. Meteorologists can now warn the public to take shelter with more notice than any previous radar. There are 158 NEXRAD radar systems deployed throughout the United States and at selected overseas locations. WFO Juneau uses the radar located on Biorka Island, just southwest of Sitka. The maximum range of a NEXRAD radar is 250 nautical miles. The NEXRAD network provides significant improvements in severe weather and flash flood warnings, air traffic safety, flow control for air traffic, resource protection at military bases, and management of water, agriculture, forest, and snow removal.
The WSR-88D shows the location, intensity, and movement of precipitation, ranging from light snow flurries to very heavy rain and large hail. From movement of precipitation, the WSR-88D also can sense motion (i.e., velocity) in the atmosphere directed toward and away from a radar. Velocity data helps in assessing atmospheric wind fields, as well as severe weather velocity signatures from thunderstorms. The WSR-88D system contains various software algorithms as well that produce a number of other radar products and alarms when threshold values of certain parameters are met. The WSR-88D greatly enhances the ability of NWS forecasters to issue short-term forecasts for any weather situation, as well as timely and accurate warnings during severe thunderstorm events. Forecasters undergo in-depth training in order to become highly proficient with the radar and to properly interpret severe weather radar signatures. Data available from the WSR-88D allows NWS meteorologists to thoroughly dissect and evaluate thunderstorms and their trends, all of which are extremely helpful in the warning decision process. Accurate spotter reports also are critical to assist in the analysis process and to verify radar signatures. As technology advances, the ability of the radar is updated with new software algorithms.
Gathering Weather Data for our Customers
 In addition to the making the forecast, our staff also specialize in the acquisition and dissemination of weather data. A large amount of current weather data comes into our computer system from regional automated weather sensors (see photo of the Sitka ASOS on right) on an hourly basis. We quality control the data and watch for any malfunctions in the equipment that would inhibit transmission to our customers. They also send out a Regional Temperature and Precipitation Roundup (RTP) report 3 times a day that contains high temperature, low temperature, and precipitation measurements gathered by our dedicated weather observers who call in or transmit their weather records to our office daily.

In addition, our staff collects river level data as needed (left) and sends the information to the Alaska-Pacific River Forecast Center (APFRC), located in Anchorage, who in turn uses the data to create a forecast of future river levels.
Weather Satellites
Today, the nation's environmental satellites are operated by the National Environmental Satellite, Data, and Information Service (NESDIS) in Suitland, Maryland. NOAA's operational environmental satellite system is composed of two types of satellites: geostationary operational environmental satellites (GOES) for national, regional, short-range warning and "now-casting," and polar-orbiting environmental satellites (POES) for global, long-term forecasting and environmental monitoring. Both types of satellites are necessary for providing a complete global weather monitoring system. NESDIS also manages the processing and distribution of the millions of bits of data and images the satellites produce each day.
 |
Welcome to WFO Juneau | NWS History | Operations | Forecast Products | Local Area Information |  |
| Marine Forecast | Fire Weather | Hydrology | Satellites |

