| 2017 Weather Highlights | Hydrology/Drought Status | Fire Weather | Records and Extremes | Monthly Highlights | Severe Weather |

|
New Mexico in 2016: Well Above Normal Temperatures and Below Normal Precipitation!
***The 2016 statewide temperature was 2.6 degrees above normal (Tied 2nd warmest).*** ***The 2016 statewide precipitation was 1.02 inches below normal (44th driest).***
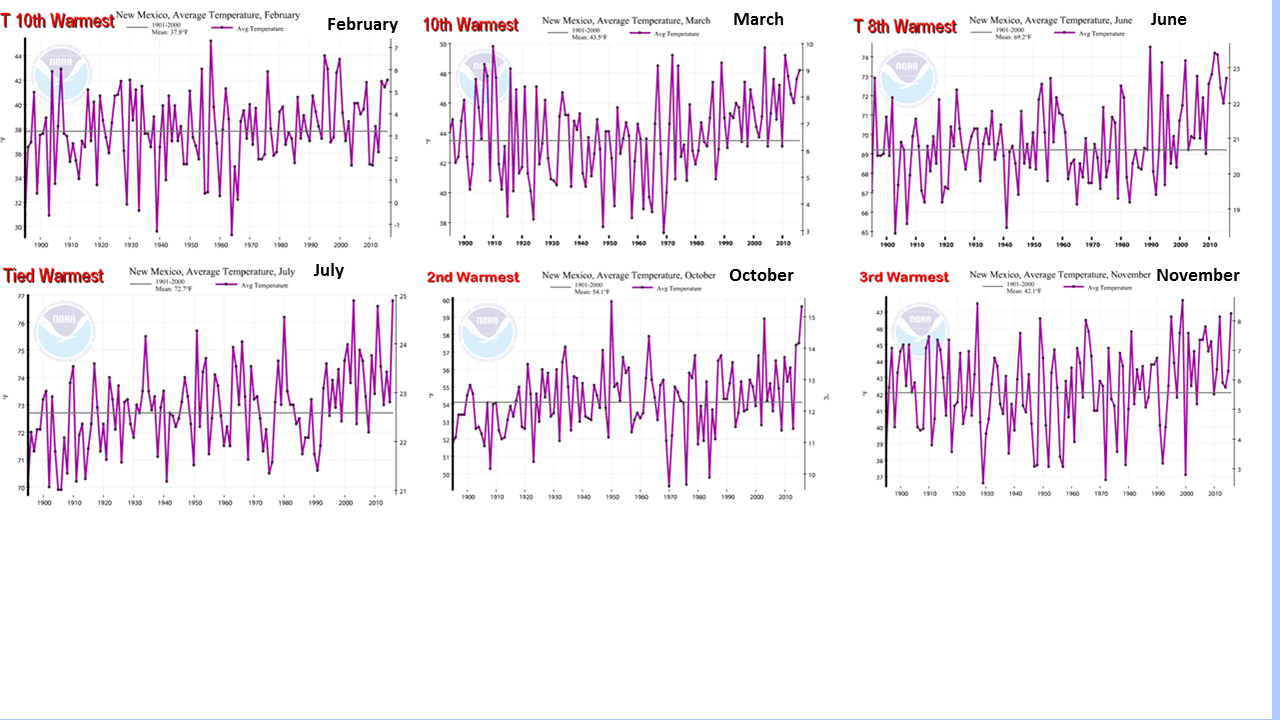
Statewide - February, March and July: All in the Top 20 Driest on Record! Statewide - February, March, June, July, October, November: All in the Top 10 Warmest on Record! (linked graphs above are courtesy of the National Centers for Environmental Information and The National Drought Mitigation Center) 2016 will go down as one of the warmest years on record (final numbers around January 10th). No less than six months were in the top ten warmest on record, and three months were in the top three warmest (July tied 1st, October 2nd, November 3rd). When was the last year New Mexico experienced a below normal year? You have to go back to 1992! That's 24 consecutive years with above normal temperatures in New Mexico! Precipitation was below normal. In the last 20 years, ten years have been drier than normal and ten years wetter than normal.
|
|||||||||||||||||||||||||||||
|
Climate Cities At A Glance: Final 2016 Temperature & Precipitation Data For Albuquerque, Clayton & Roswell
(departure from normal based on 30 year normal 1981 - 2010; rankings based on total period of record) This year's annual weather and climate review is organized into topics which are accessed by the tabs across the top of the page. This page below provides links to the 2016 statistics on temperature and precipitation for our climate sites: Albuquerque, Clayton and Roswell. Other topics include a summary of the drought status and Hydrologic program; a recap of the Fire Weather program; a list of all the records in Albuquerque, Clayton and Roswell in 2016 as well as extremes for Albuquerque and the growing season around the Duke City; a month to month recap of the significant weather events across New Mexico in 2016; and a review of our annual severe weather. Click on a city below to view more detail about thetemperature & precipitation data for 2016
|
|||||||||||||||||||||||||||||


