
Heavy to excessive rainfall is expected today into Wednesday over New Mexico into far west Texas. Flash flooding and debris flows in wildfire burn areas will be possible. A strong coastal storm will develop off the Mid-Atlantic coast Wednesday, intensifying toward southern New England this weekend. Significant coastal flooding, strong rip currents, and beach erosion from high surf expected. Read More >
Albuquerque, NM
Weather Forecast Office

| Central Highlands |
| December-January-February Precipitation |
|
(Return to Main Feature) or go to CD1 | CD2 | CD3 | CD4 | CD5 | CD7 | CD8 |
|
Across New Mexico's central highlands, the effects of La Niña events on winter show considerable variability, with terrain effects likely contributing to the variations from site to site. In Estancia, DJF precipitation averages 76% of normal. To the south, where the effects of La Niña are generally greater, Ruidoso DJF precipitation averages 81% of normal and Elk 2E averages 84% of normal. The proximity of these sites to the Sacramento Mountains can likely explain the higher values. For strong La Niña events, winter precipitation was lowest at Estancia, with 64% of average precipitation. |
|
A description of the graphs is located at the bottom of the page. |
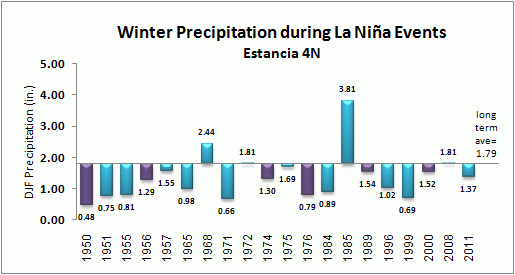 |
| Percent of Longterm Average for all La Niña Events = 76% , for strong La Niña Events = 64% |
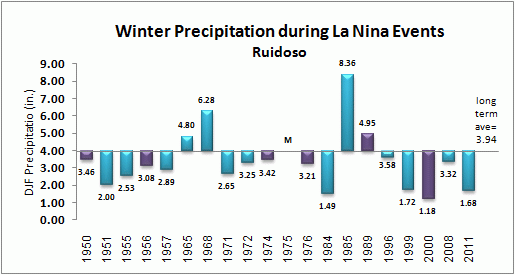 |
| Percent of Longterm Average for all La Niña Events = 81% , for strong La Niña Events = 82% |
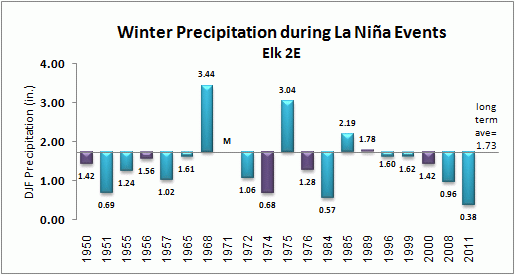 |
| Percent of Longterm Average for all La Niña Events = 84% , for strong La Niña Events = 78% |
|
Precipitation values for 3-month periods during 19 La Niña Events since 1949-50 are plotted with respect to the long term precipitation average, listed to the right of the graph. The precipitation totals for each 3-month period are plotted above or below each bar. Years for which the La Niña Event was considered to be strong are colored in purple. "M" represents a 3-month period with missing data. Finally, the percents of longterm normal for all La Niña events and for the strong La Niña events are listed below each graph. |
Current Hazards
Outlooks
Submit A Storm Report
Severe and Hazardous Weather Info
Current Conditions
Surface Observations
Observed Precipitation
Satellite
Local Satellite Page
Local Observations Page
Map of Latest Wind and Precipitation Reports
Radar
National Radar
ABX Albuquerque Radar
FDX Cannon Air Force Base Radar
Forecasts
Fire Weather Forecasts
Area Forecast Discussion
Hourly View Forecast
Activity Planner
Aviation Forecasts
Local Forecast Page
Graphical Forecasts
Hydrology
Local Hydrology Products
Advanced Hydrologic Prediction Services
Climate and Past Weather
Local Data
Winter Climatology for NM
NOAA Climate Center
Climate Prediction Center
Climate Graphs
Drought
Severe T-Storm Climatology for NM
Local Programs
About Our Office
SKYWARN
NOAA Weather Radio
Local Studies and Features
Winter Weather Info, Safety Tips, and Climo
Severe Weather Info, Safety Tips, and Climo
Center Weather Service Unit

US Dept of Commerce
National Oceanic and Atmospheric Administration
National Weather Service
Albuquerque, NM
2341 Clark Carr Loop SE
Albuquerque, NM 87106-5633
(505) 243-0702
Comments? Questions? Please Contact Us.


 Follow us on X
 Follow us on Facebook
 Follow us on YouTube
 ABQ RSS Feed