THE ROLE OF JET COUPLET DYNAMICS IN THE LIFECYCLE OF A SHORT-DURATION, SEVERE MID-LATITUDE SQUALL LINE WITHIN AN ELEVATED MARGINALLY UNSTABLE ENVIRONMENT
Michael A. Jamski*
Mark A. Wool
Andrew I. Watson
NOAA/National Weather Service
Tallahassee, FL
1. INTRODUCTION
Shortly after 0500 UTC on 24 January 2000, a cluster of showers and thunderstorms formed in the vicinity of a surface low-pressure area and warm front across southwest Alabama and the western Florida Panhandle. By 0700 UTC, this area of convection had rapidly intensified, and evolved into an intense squall line as it swept eastward into the eastern Florida Panhandle. During its mature stage, several bow echoes and embedded mesocyclones were observed from the KTLH WSR-88D Doppler radar. NWS Tallahassee issued nine severe thunderstorm warnings between 0925 and 1211 UTC. Eight reports of wind damage were received from locations in the eastern Florida Panhandle, Florida Big Bend and southwest Georgia during a three-hour period (0920 to 1230 UTC). Localized straight-line winds, at times estimated as high as 70 mph, downed numerous trees and power lines, and caused structural damage to homes and businesses. The most significant damage occurred at a middle school in Thomasville, Georgia, when thunderstorm winds lifted its roof and deposited it several hundred yards away.
Twenty-four hours prior to the event, short-range numerical models predicted that a sharp 500-mb short wave trough over the Midwest would swing southeast into the Carolinas by 0000 UTC 25 January. The 1200 UTC 24 January 300-mb wind fields showed a coupled jet streak pattern, with the left exit region of the upstream jet streak over the Florida Panhandle, and the right entrance region of the downstream jet streak across Georgia. The 1200 UTC 24 January omega and 300-mb wind/height fields showed respective maximum values of upward vertical motion and divergence centered over northern Florida and southern Georgia. Model time-height profiles and local soundings indicated an elevated, marginally unstable pre-convective environment, with weak directional and moderate wind speed shear. The 1200 UTC 24 January short-range model cycle predicted rapid surface cyclogenesis off the Carolina coast, as a negatively-tilted 500-mb short wave trough located over the Southeast U.S. moved northeast into New England during the next 48 hours. Ultimately, the trough and surface low deepened faster and further west than the models predicted, and a major winter storm blanketed the Mid-FFCantic and Northeast U.S. with up to two feet of snow.
This paper will assess the pre-storm synoptic environment and the mesoscale features of the squall line and bow echoes from the KTLH WSR-88D reflectivity and velocity data. It will conclude with a brief overview of jet streak couplets and their contribution to cyclogenesis and mesoscale convective systems (MCS).
2. SYNOPTIC ENVIRONMENT
The 0000 UTC 24 January RUC depicted an east-west surface boundary, from the South Carolina coast to a 1014-mb surface low over southern Louisiana to southeast Texas. The front separated dewpoints in the 30s and 40s over much of Alabama and Georgia, from dewpoints in the 50s and 60s over Florida. By 0600 UTC, the surface low was located just south of Pensacola, Florida, with a warm front eastward into southern Georgia. The 0000 UTC 24 January Tallahassee, Florida sounding revealed a shallow stable layer from the surface to 850 mb, then a moist adiabatic layer to about 250 mb. The precipitable water was 1.21 inches, K-index was 29, lifted index was 2°C at 500 mb, and mean 850-500 mb lapse rate was 5°C per km. The 1200 UTC TLH sounding (Fig. 1) showed an elevated stable layer from the surface to 850 mb, then a moist adiabatic layer to near 250 mb. The only change from the 0000 UTC sounding was an increase in the 850-500 mb lapse rate (6.2° per km). The storm-relative wind was 260° at 46 knots, and the low-level shear (surface to 3 km) was 43 knots. A weak southwesterly low-level jet (15 knots) extended from the northern Gulf into the Florida Panhandle at 0600 UTC. Weak thermodynamic instability was in place, with convective available potential energy (CAPE) values less than 500 Joules per kg, and model lifted indices from 0 to 3°C.
Twelve-hour isallobaric wind fields and 500-mb forecasts indicated 8-mb pressure and 80-m falls, respectively, across the Florida Big Bend at 1200 UTC. The 0000 UTC RUC showed an upper-level trough axis from the Ohio Valley to southern Mississippi, with a broad region of positive vorticity advection forecast over Alabama and the western Florida Panhandle at 1200 UTC. The 0000 UTC 24 January ETA 700-500-mb omega fields focused maximum upward vertical velocities (-10 to -15 microbars per second) over Tallahassee at 1200 UTC. The ETA 300-mb analysis, initialized at 1200 UTC 24 January (Fig. 2), forecasted maximum divergence values over northern Florida and southern Georgia, where the left exit and right entrance regions of the jet streaks were juxtaposed.
Fig. 1. 1200 UTC 24 January Tallahassee FL, Sounding

Fig. 2. 1200 UTC 24 January ETA 300 mb. Isotachs (shaded, knots), Heights (bold), Divergence (thin)
The 0015 UTC 24 January GOES-8 IR satellite image indicated a broken area of convection associated with a weak 500-mb vorticity lobe moving across northern Florida and southern Georgia. An approaching 140-knot jet was identified by a cirrus cloud streak over Texas. By 0315 UTC, this feature moved eastward into southern Louisiana. Two hours later, a rapidly growing area of convection developed over southern Mississippi and southwest Alabama. A baroclinic leaf cloud pattern, characteristic of surface cyclogenesis, was evident by 1015 UTC over Alabama, Mississippi, and the Florida Panhandle. The 1215 UTC 24 January GOES-8 IR image (Fig. 3) showed a north-south band of convection from southern Georgia into the northeast Gulf of Mexico. The most intense convection (cloud top temperatures of –60 to –64°C) was in close proximity to a 1006-mb surface low over the Florida Big Bend (marked by arrow).
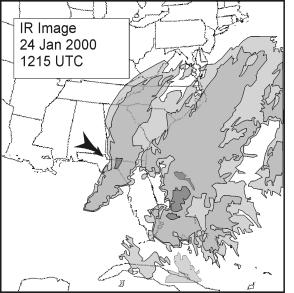
Fig. 3. 1215 UTC 24 January GOES-8 IR Image (Darkest grey contour represents cloud top temperatures –60 to –64°C).
3. MESOSCALE FEATURES
The series of KTLH WSR-88D Doppler reflectivity and velocity images, described during the formative and mature stages of the squall line and its embedded bow echoes, were viewed using the WSR-88D Algorithm Testing and Display System (WATADS).
Shortly before 0900 UTC 24 January, an intensifying line of thunderstorms was observed over Walton County in the eastern Florida Panhandle, which moved eastward into Bay and Washington counties by 0920 UTC. The KTLH WSR-88D detected several mesocyclonic signatures along the leading edge of the developing bow echo, as it moved east at 25 knots into northeast Bay and eastern Washington counties. Winds estimated between 60 and 70 mph were observed eight miles north of Southport, Florida, in Bay County. The mature bow echo’s speed accelerated to 45 knots as it entered Calhoun County shortly before 1000 UTC. Doppler radar inbound velocities (at 0.5° elevation) measured 48 to 57 knots at the apex of the bow. The 0955 UTC KTLH WSR-88D reflectivity image (Fig. 4) indicated a well-defined rear inflow notch of lower reflectivities (18 to 24 dBZ). “Book end” vortices, which would focus the developing cold pool and rear inflow, were not clearly evident in the reflectivity and velocity data. However, the first of several mesocyclonic circulations associated with this bow echo, developed along its leading edge. An elevated rear inflow, forced by a spreading cold pool at the surface (mesohigh), and an expanding warm pool aloft (mesolow) focused the low-level shear. The presence of a low-level shear axis along the bow echo’s leading edge is a common feature, as described by Przybylinski (1995). Several reports of downed trees and power lines near Altha, and structural damage at Blountstown, Florida were received as the bow echo tracked across Calhoun County.
The bow echo raced east-northeast across the Apalachicola River into Gadsden County, and then into southern Decatur County in southwest Georgia shortly after 1100 UTC. Maximum inbound velocities of 58 to 63 knots (at 0.5° elevation) were measured over Gadsden County, where numerous downed trees and power lines were reported south of Interstate 10 between 1115 and 1130 UTC. Soon thereafter, the bow echo became linear along the leading edge of the squall line, and entered Leon County, including Tallahassee. Straight-line winds downed trees, power lines, and damaged two homes. Maximum inbound velocities (at 0.5° elevation) had decreased to 38 to 47 knots. The northern flank of the squall line produced wind damage across Grady, Thomas and Colquitt counties in southwest Georgia between 1115 and 1200 UTC. The most significant damage occurred at a middle school in Thomasville, Georgia shortly before 1130 UTC, when thunderstorm winds lifted its metal roof, and deposited it several hundred yards away. The squall line continued east through Lowndes County in south central Georgia, and Madison and Taylor counties in the eastern Florida Big Bend between 1200 and 1300 UTC. A few homes and businesses sustained roof damage in Valdosta, Georgia around 1230 UTC.
4. JET COUPLET DYNAMICS
Uccellini (1990) best describes the structure and ageostrophic circulations of jets: the entrance region is indicated by a transverse ageostrophic component directed toward the cyclonic-shear side of the jet, and represents the upper branch of a direct circulation marked by rising (sinking) motion on the anticyclonic or warm (cyclonic or cold) quadrant of the jet. Conversely, in the exit region, the transverse ageostrophic component of the upper troposphere is directed toward the anticyclonic-shear side of the jet, and represents the the upper branch of an indirect circulation marked by rising (sinking) motion on the cyclonic or cold (anticyclonic or warm) quadrant of the jet.
Vorticity advection and convergence/divergence patterns are consistent with both the direct and indirect jet circulations. According to Uccellini and Kocin (1987), upper-level divergence is approximated by the vorticity advection fields, with cyclonic or positive vorticity advection associated with divergence, and anticyclonic or negative vorticity advection associated with convergence.

Fig. 4. 0955 UTC 24 January KTLH WSR-88D Reflectivity Image (apex of mature bow echo indicated by arrow)
The coupling of jet streaks to a superposition of convergence and divergence regions can induce sufficient upward vertical motion and drying aloft to overcome the marginal instability, thereby initiating rapid surface cyclogenesis and convective development. The coupled upper-level jet streaks in this case contributed to the evolution and maintenance of the squall line.
The 1200 UTC 24 January ETA 200-mb analysis initialized at 1200 UTC (Fig. 5) depicted a north-south trough axis from the Ohio Valley into the central Gulf of Mexico. A 140-knot jet streak was located over the eastern Gulf of Mexico, with a 110-knot jet streak positioned off the Carolina coast. This juxtaposition of the coupled jet streaks placed northern Florida and southern Georgia in the left exit and right entrance regions, respectively, with a broad upper-level diffluent zone from the northeast Gulf of Mexico into northern Florida.
The along-stream and cross-stream wind speed variations of the jet streaks (identified by A-A’ and B’-B, respectively, in Fig. 5) were analyzed for direct and indirect ageostrophic circulations and vertical motions. The 1200 UTC 24 January along-stream cross-section from Columbia, South Carolina (CAE) to 28°N 86°W (Fig. 6) shows the exit region of the downstream jet streak near 200 mb, and the entrance region of the 100-knot upstream jet streak near 300 mb. Ageostrophic wind vectors (arrows) are sloped along the isentropic surfaces. The strongest upward vertical motions (–14 microbars per second at 500 mb) across northern Florida and southern Georgia, produced by the coupling of the direct and indirect ageostrophic wind circulations, were responsible for the rapid surface cyclogenesis between 0600 and 1200 UTC.
Fig. 5. 1200 UTC 24 January ETA 200 mb. Isotachs (shaded, darkest grey contour is 140 knots), Heights (bold), Along-stream (A-A’), Cross-stream (B’-B)
Uccellini (1990) notes that in the exit region of a jet streak, upper-level divergence often leads to height falls at the surface and mass momentum changes, producing a dynamic coupling of the upper- and lower-level wind maxima. The coupling of the ageostropic wind, in this case, is indicated by the indirect circulation of the exit region over the Florida Big Bend at 1200 UTC.

Fig. 6. 1200 UTC 24 January Along-Stream Cross-Section.
Ageostrophic wind (arrows), Isotachs (knots, bold), Omega (dashed, shaded, mbars s-1), Isentropes (thin, °K)
The 1200 UTC 24 January cross-stream cross-section from Nashville, Tennessee (BNA) to 20°N 81°W (Fig. 7) shows a region of maximum upward vertical motion, similar to the along-stream cross-section in Fig. 6. It is centered between the downstream direct circulation off the Carolina coast, and the upstream indirect circulation over the northern Gulf of Mexico and Florida Panhandle.
5. CONCLUSIONS
This case study focused on the ageostrophic wind components of the direct and indirect circulations of coupled jet steaks, and their resultant contributions to vertical motions and surface cyclogenesis. Potential vorticity (PV) was also examined. An east-west cross section from Jacksonville, Florida to Fort Worth, Texas indicated a main PV lobe in the cold sector between the jet streak maxima over Mississippi and Alabama at 1200 UTC. Although not a contributor to the MCS, it played a vital role in the explosive cyclogenesis over the Southeast U.S. twenty-four hours later. The models’ accurate prediction, twenty-four hours in advance, and the forecasters’ experience recognizing the synoptic and mesoscale patterns proved successful in the warning process.

Fig. 7. 1200 UTC 24 January Cross-Stream Cross-Section.
Ageostrophic wind (arrows), Isotachs (knots, bold), Omega (thin, shaded, mbars s-1), Isentropes (thin, °K)
6. ACKNOWLEDGMENTS
Thanks to MIC Paul Duval for his constructive review and Todd Lericos at Florida State University for his invaluable data input.
7. REFERENCES
Przybylinski, R.W., 1995: The bow echo: Observations, numerical simulations, and severe weather detection methods. Weather and Forecasting, 10, 203-218.
Uccellini, L.W., 1990: The relationship between jet streaks and severe convective storm systems. Preprints, 16th Conference on Severe Local Storms, and Conference on Atmospheric Electricity, Oct 22-26, 1990, Amer. Meteor. Soc., Boston, MA, 121-129.
________, and P.J. Kocin, 1987: The interaction of jet streak circulations during heavy snow events along the east coast of the United States. Weather and Forecasting, 2, 298-308.


 Follow us on YouTube