| Heavy Rain & Flooding of July 2nd-6th, 2013 |
A very anomalous pattern set up across the U.S. in early July featuring a persistent upper level trough over and just west of the Mississippi Valley and a downstream ridge off the Mid Atlantic Coast. This brought deep layer moist tropical air into the Southeast for several consecutive days resulting in torrential rains, flash flooding and river flooding. While several episodes of severe weather also occurred during this period, the heavy rain and accompanying flooding were the primary impacts. Figure 1 shows this unseasonably amplified pattern as it looked on Independence Day. Figure 2 shows how much rain fell over just a 3-day period from July 2nd-4th. Additional heavy rains fell on the 5th and 6th. Note the large swath of 10+ inches in the Florida Panhandle and Southeast Alabama. A local storm report lists a portion of the numerous rainfall reports received. They are also indicated graphically in Figure 3, which also shows the warning polygons issued for this event.
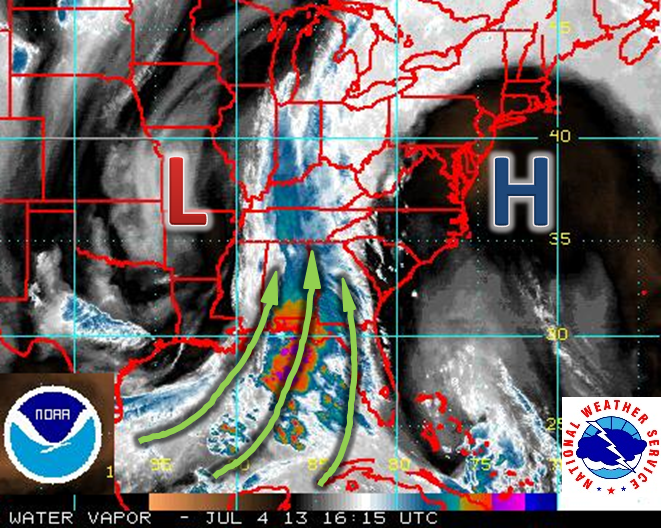
Figure 1. Water vapor imagery from 1615 UTC (1215 PM EDT) on July 4, 2013 showing tropical moisture being drawn northward into the region between a trough to the west and a ridge over the Atlantic. Click on the image for a larger view.
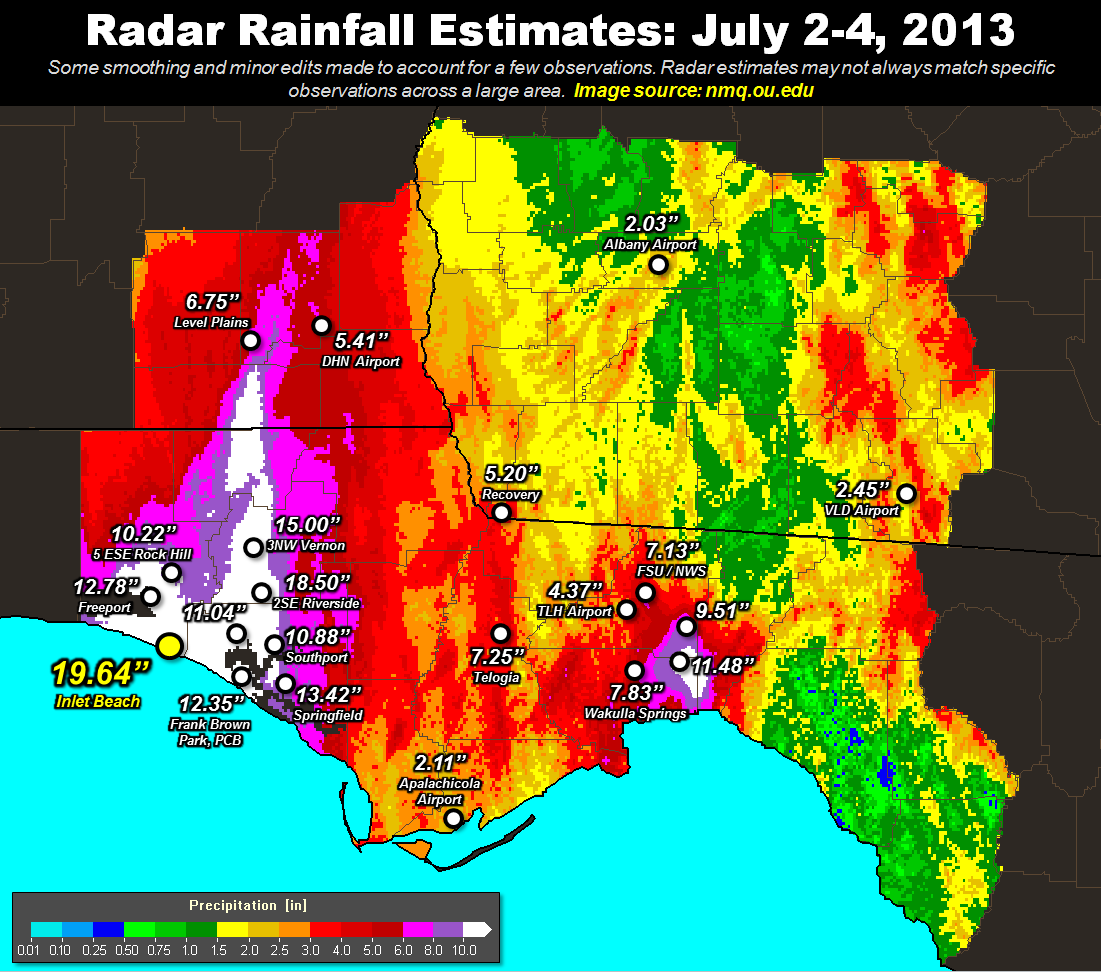
Figure 2. Rainfall totals across the NWS Tallahassee County Warning Area from July 2-4, 2013. Click on the image for a larger view.

Figure 3. Warning polygons and storm reports for the 6-day period from July 2-7, 2013. Flood/Flash Flood (green), severe thunderstorm (yellow), and special marine (purple) warnings are indicated. Heavy rain and flooding reports are indicated by the icons. Click on the image for a larger view.
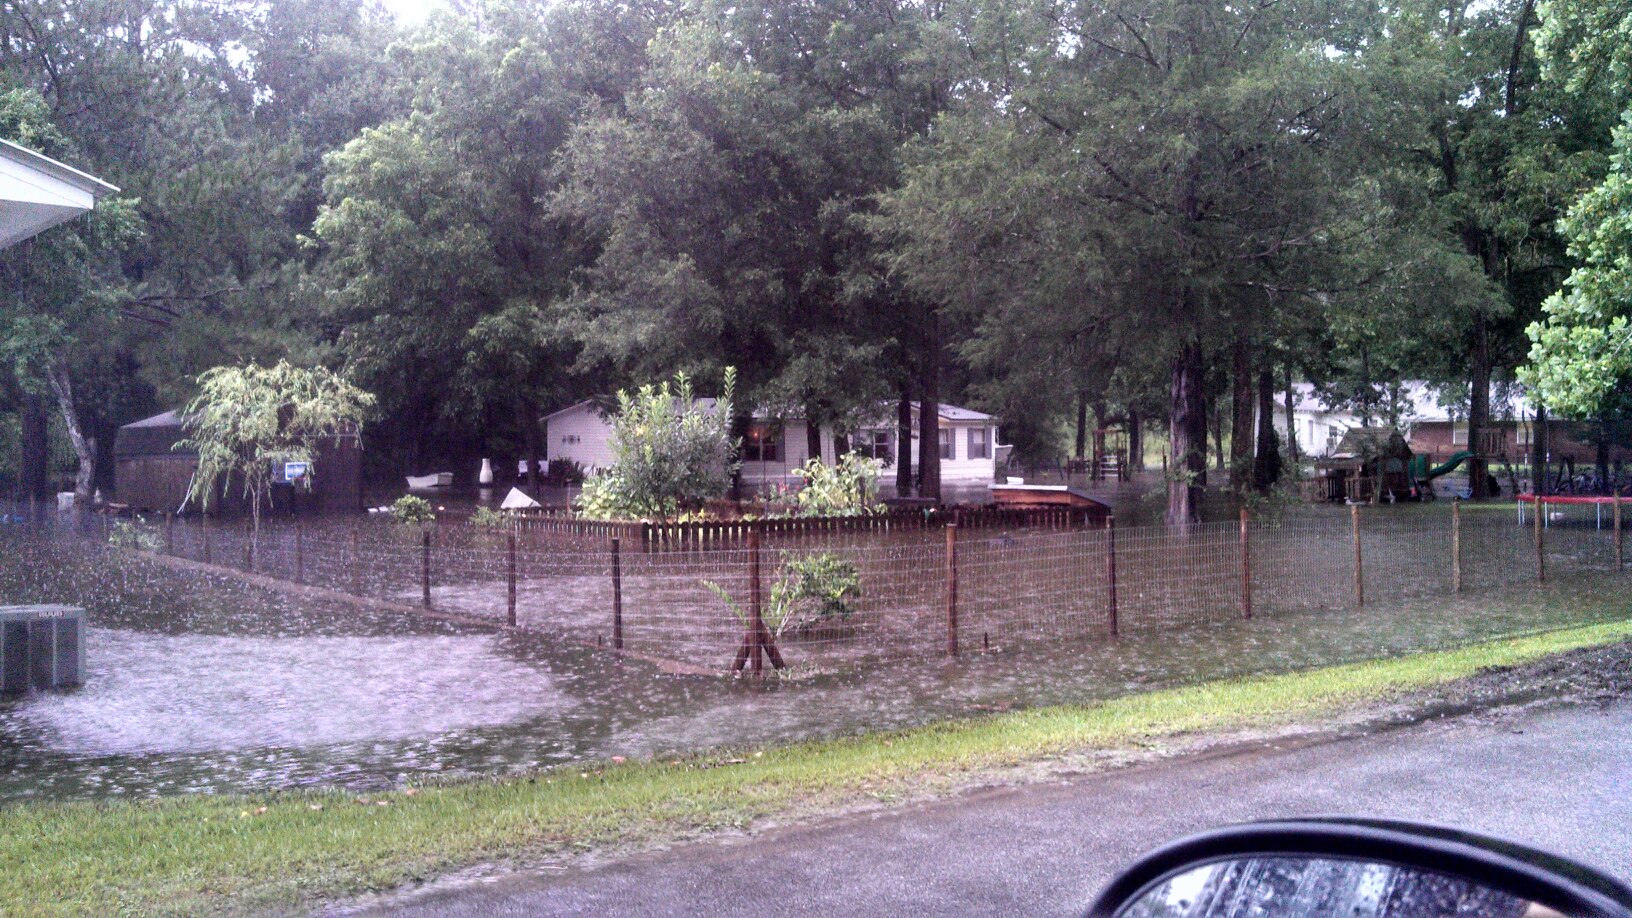
The heaviest rains on July 3rd fell in Bay, Washington and Holmes Counties in Florida. Figure 4 shows a home surrounded by flood waters in Vernon (left)and a flooded roadway in Bonifay (right). On July 4th, the same areas got inundated and flash flooding occurred in Panama City Beach. Figure 5 shows flooding on Hutchinson Blvd (left) and at another location in the city (right). Figure 6 is a map shown on the website of The News Herald showing that parts of Front Beach Road and Thomas Drive were also flooded.
 |
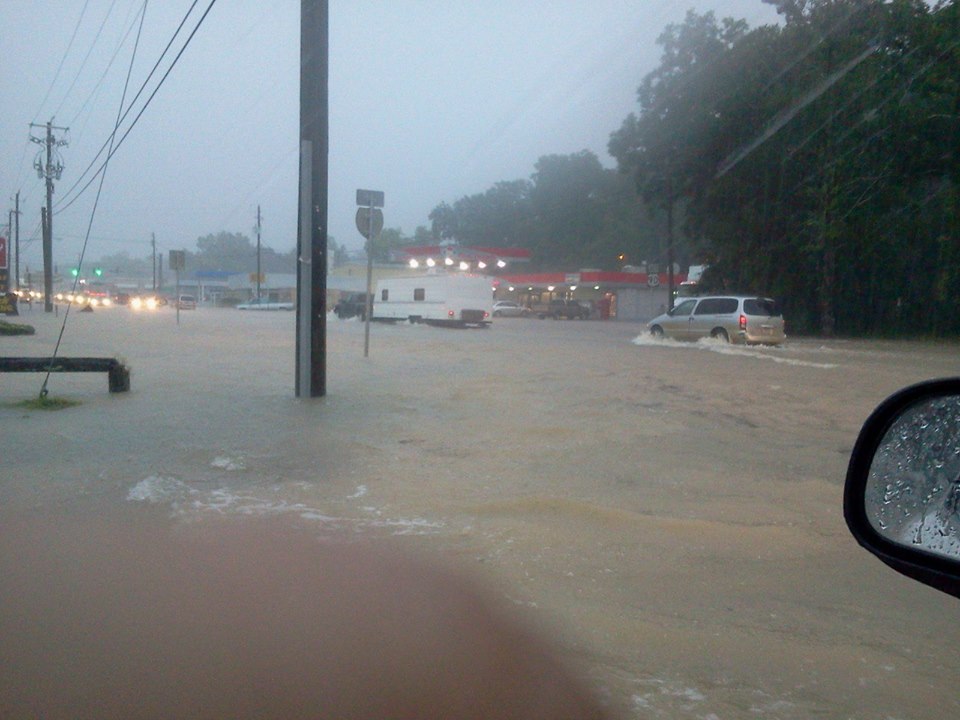 |
Figure 4. Flood waters surround a home in Vernon, FL (left; photo courtesy of WJHG-TV) and inundate a major roadway in Bonifay, FL on July 3, 2013 (photo shared on Facebook). Click on the images for a larger view.
 |
 |
Figure 5. Flooding in Panama City Beach, FL on July 4, 2013. The photo on the left is courtesy of The News Herald and the one of the right is courtesy of WJHG-TV. Click on the images for a larger view.
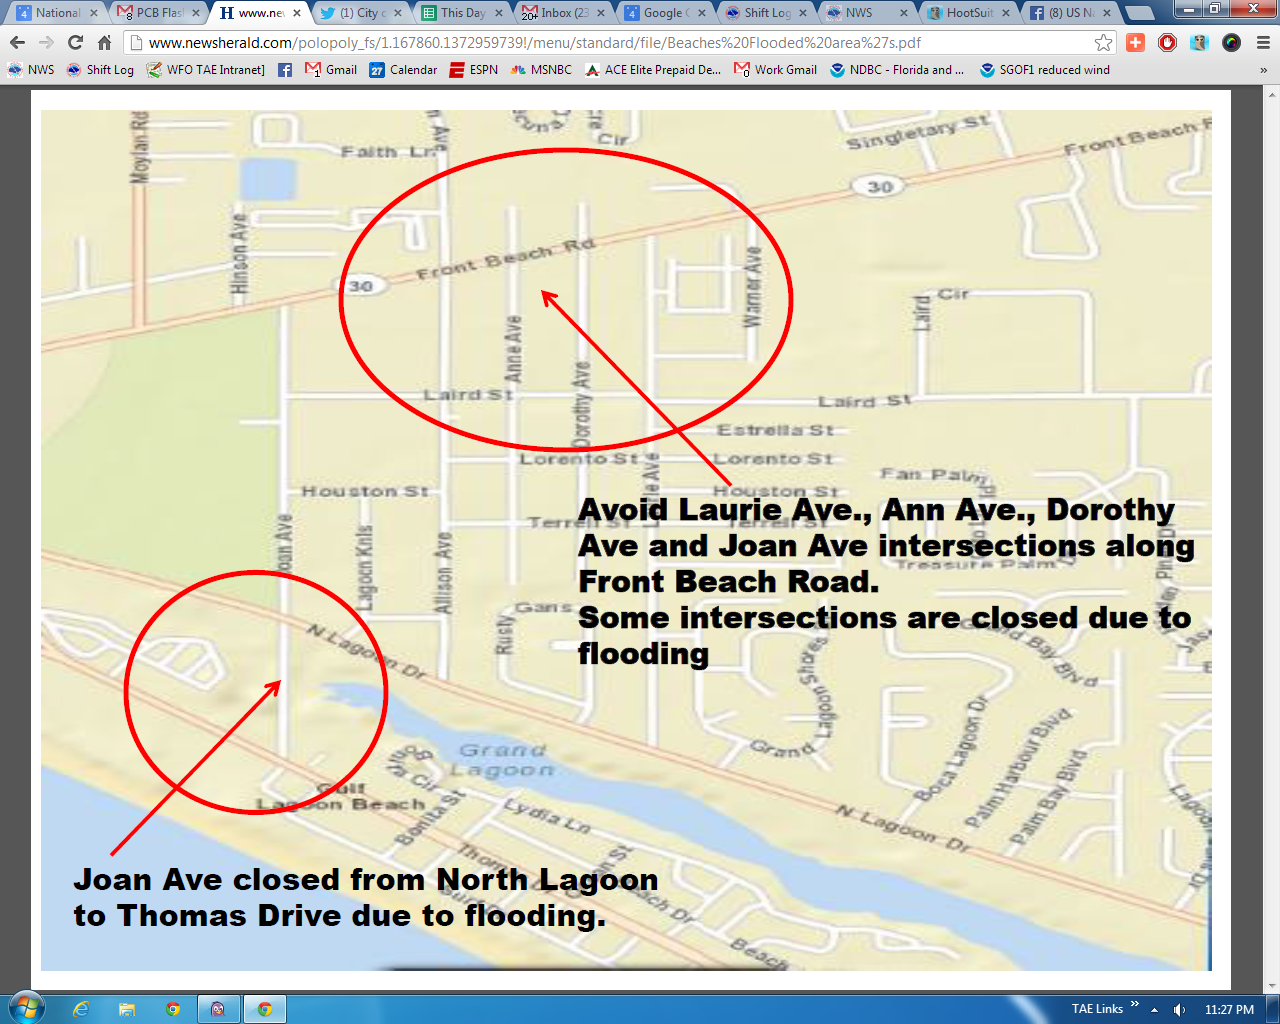
Figure 6. A map posted on the website of The News Herald showing locations of flooded roads and intersections on Independence Day 2013 in Panama City, FL. Click on the images for a larger view.
Figure 7 is a screen shot from our Advanced Hydrologic Prediction Service (AHPS) web page showing several area rivers at or above flood stage. The Choctawhatchee River at Bruce-Ebro is colored purple indicating a crest above major flood stage (16.5 ft). Figure 8 shows a hydrograph of the river stages at this location (blue line) with a forecast indicated in purple. Figure 9 shows what major flooding looks like at the Ebro the boat landing.
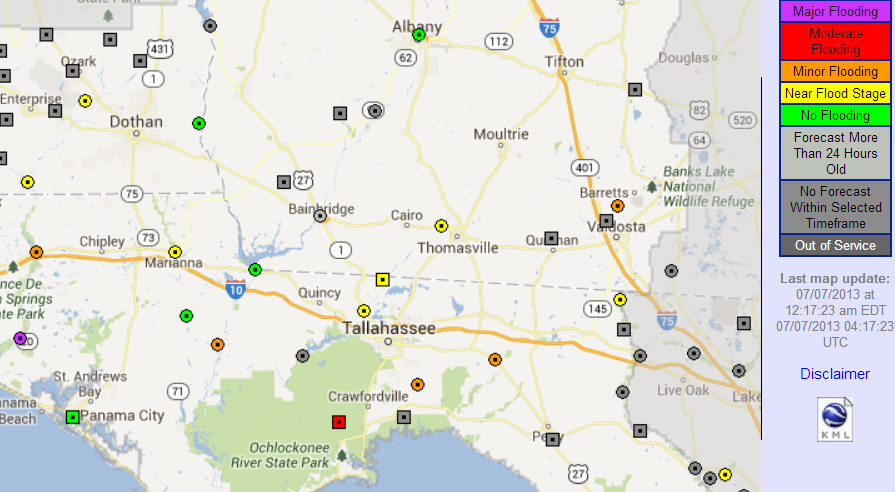
Figure 7. A screen shot from the AHPS page valid 0417 UTC (1217 AM EDT) July 7, 2013. Rivers above, or forecast to be above, minor flood stage are indicated in orange. Moderate flood stage is red and major is purple. Click on the images for a larger view.

Figure 8. Observed (blue) and predicted (purple) stages on the Choctawhatchee River at Bruce-Ebro valid 0603 UTC (203 AM EDT) July 7, 2013. Click on the images for a larger view.

Figure 9. The Ebro boat landing on the Choctawhatchee River on July 6 while the river was in major flood. Photo courtesy of WMBB-TV. Click on the images for a larger view.
This page was authored by webmaster, Mark Wool. Thanks go to Don Van Dyke for the warning graphic and several of the photos. Alex Lamers created the rainfall map.


 Follow us on YouTube