| Heavy Rain, Flooding & Severe Weather of February 22-26, 2013 |
A very active pattern set up across the Gulf Coast states during the last week of February 2013. Several energetic impulses swept overhead in persistent southwesterly flow aloft as a frontal boundary focused bands of heavy rain across the region. While several episodes of severe weather occurred during this period, the heavy rain and accompanying flooding were the primary impacts. Figure 1 shows how chaotic the situation was with severe weather reports in Florida and South Central GA interspersed with many heavy rain and flooding reports. Figure 2 shows just how much rain fell across the forecast area over this 5-day period. Note the large swath of 8-12+ inches. A public information statement lists the numerous rainfall reports received. Tallahassee Regional Airport measured 12.36 inches of rain during February, most in the last week. This makes February 2013 the wettest on record.

Figure 1. Warning polygons and storm reports for the 5-day period from February 22-26, 2013. Flood/Flash Flood (green), severe thunderstorm (yellow), tornado (red) and special marine (purple) warnings are indicated. Click on the image for a larger view.

Figure 2. Rainfall totals across the NWS Tallahassee County Warning Area from February 22-26, 2013. Click on the image for a larger view.
In addition to areal and flash flooding, significant rises were observed on area rivers, most of which flooded. A few of the rivers reached moderate flood stage with at least one reaching major flood. Figure 3 shows a screen shot of our Advanced Hydrologic Prediction System (AHPS) interactive map on February 27th showing all of the river forecast points that were in flood or forecast to flood. Note the many instances where moderate flooding was observed.
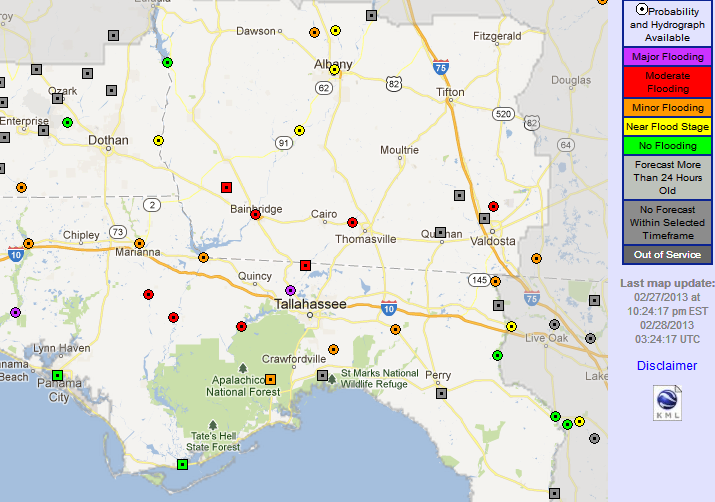
Figure 3. A screen shot of our Advanced Hydrologic Prediction System (AHPS) interactive map on February 27th showing all of the river forecast points that were in flood or forecast to flood. Click on the image for a larger view.
Figures 4a, 4b and 4c show a series of hydrographs depicting the stages observed along the Ochlockonee River at Thomasville, Concord, and Havana, respectively. Note how close to major flood stage the river climbed at the latter two sites along the stretch of river between Leon and Gadsden Counties. River flooding took longer to develop on the Suwannee River and its tributaries. Figure 5a shows the Withlacoochee River at Pinetta, FL cresting on March 3rd, while flooding on the Suwannee River itself was forecast to commence at Ellaville 5-6 days later.


Figure 4. Hydrographs depicting observed (blue) and forecast (purple) stages on the Ochlockonee River at Thomasville GA (a), Corcord FL (b) and Havana FL (c) in late February and early March 2013. Click on each image for a larger view.

Figure 5. Hydrographs depicting observed (blue) and forecast (purple) stages on the Withlacoochee River at Pinetta FL (a) and the Suwannee River at Ellaville FL (b) in late February and early March 2013. Click on each image for a larger view.
Several photos from the event are highlighted below. Figure 6 shows a flooded bridge in Walton County, FL. Figure 7 shows a flooded neighborhood in Worth County, GA. Figure 8 shows flood waters approaching a home in Madison County, FL.

Figure 6. Flooding around The McKinnon Bridge over Bruce Creek in Walton County. Photo courtesy of WJHG-TV's Chris Smith.
Figure 7. Flooding of a neighborhood in Worth County, GA on February 23, 2013. Photo courtesy of Kellie Parton.

Figure 8. Flood waters approach a home in Madison County, FL. Photo courtesy of The Madison County Voice.

Figure 9. Tim Perry takes a closer look at McKeown Mill Road near Sneads, FL. Photo courtesy of The Jackson County Floridian.
This page was authored by webmaster, Mark Wool. Thanks go to Don Van Dyke for the warning graphic and several of the photos. Alex Lamers created the rainfall map.


 Follow us on YouTube