| Tropical Storm Ida Event Summary |
Ida developed in the western Caribbean Sea as a Tropical Depression out of an area of low pressure and disturbed weather on Wednesday, November 4th. It was quickly upgraded to a Tropical Storm later on Wednesday before it made landfall on the Nicaraguan coast. Ida regained strength to a Tropical Storm on Saturday, November 7th as it emerged into the northwest Caribbean. Ida was upgraded to a Hurricane early on Sunday, November 8th, reaching Category 2 status by midday on Sunday. Ida was downgraded to a Category 1 Hurricane on Monday morning and was further downgraded to a Tropical Storm later on Monday morning, November 9th. Ida finally made landfall early on Tuesday, November 10th on Dauphin Island outside of Mobile Bay with maximum sustained winds of 45 mph. The National Hurricane Center discontinued advisories on Ida at 9 am CST on Tuesday. Ida's track is shown in Fig. 1. Figure 2 shows an infrared satellite picture of Ida as it tracked across the north central Gulf on Monday, November 9th. Ida was one of the latest-season tropical cyclones to impact the forecast area. It was the 2nd latest hurricane to develop in the Gulf and eventually make landfall along the northern Gulf Coast. Of course many around here remember the record-holder, Hurricane Kate, which made landfall near Mexico Beach on November 21, 1985.

Figure 1. Track of Hurricane Ida.

Figure 2. IR satellite image with lightning and model mean sea level pressure at 1800 UTC (1:00 PM EST) Monday, 9 November.
As seen in Fig. 3, we were spared some of the heaviest rainfall associated with Ida. Amounts greater than 2-3 inches were primarily confined northward across central Alabama, northern Georgia, on into the Carolinas. The remnants of Ida were much more intense across the Middle Atlantic States as low pressure developed off the North Carolina, Virginia, and Maryland coasts producing unusually high storm tides, large rainfall amounts, and flooding. One primary feeder-like band (shown in Fig. 4) did briefly set up over the Northeast Gulf as Ida was approaching landfall early on the morning of November 10th. This band produced the highest rainfall totals in the Florida portion of the forecast area. Along the coast in Gulf and Franklin Counties, rainfall totals of 2-4 inches were reported.

Figure 3. Seven-day observed rainfall ending 1200 UTC (7:00 AM EST), 13 November 2009 courtesy of the SERFC.

Figure 4. Tallahassee Doppler radar (KTLH) reflectivity image on Tuesday, 10 November at 1326 UTC (8:26 AM EST).
See the post tropical cyclone report issued by NWS Tallahassee for additional details on the local impacts of Ida. The following images show flooding and beach erosion that occurred during Ida. These three photos are courtesy of the Tallahassee Democrat. A complete photo gallery will be available soon.

Figure 5. Coastal flooding and erosion damaged Alligator Drive on Alligator Point.
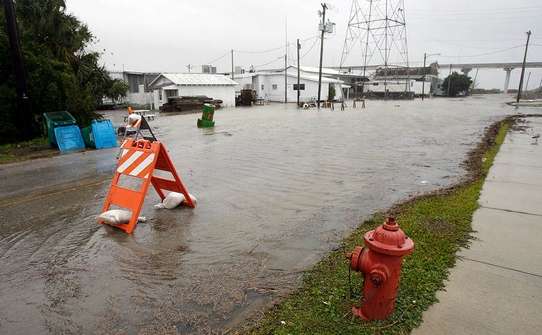
Figure 6. Flooding on Water Street in Apalachicola at high tide.

Figure 7. Water from a swollen Wakulla River surrounds a canoe and kayak rental shop called T-n-T Hide-A-Way.


 Follow us on YouTube