An examination of varying supercell environments over the complex terrain of the eastern Tennessee River Valley
by
David M. Gaffin and David G. Hotz
ABSTRACT
This study examines the similarities and differences between five events when supercells over the eastern Tennessee River Valley had either low or high tornado-producing efficiency. The three events with a high tornado-producing efficiency (defined in this study as an event where every supercell produced at least one tornado) were characterized by the tornado-producing supercells tracking near a well-defined, preexisting west-to-east oriented quasi-stationary frontal boundary. The other two events with a low tornado-producing efficiency had supercells that were located and moved farther away from a south-to-north oriented cold front. In the high tornado-producing efficiency events, the west-to-east propagating supercells likely encountered lower lifted condensation level (LCL) heights and higher helicity values, for a longer distance along the west-to-east oriented quasi-stationary frontal boundaries. In the low tornado-producing efficiency events, the west-to-east propagating supercells encountered higher LCL heights and lower helicity values as they propagated farther away from the south-to-north oriented cold fronts, especially across the Great Tennessee Valley where the lowering elevation from the Cumberland Plateau aided in the higher LCL heights. During the one non-tornado-producing event, the combination of high LCL heights, a lack of low-level directional wind shear, and the location of the supercell paths away from a well-defined surface boundary likely caused the lack of tornado development, despite the presence of numerous supercells. The two tornadic outbreak events (defined in this study as an event that produced five or more tornadoes) experienced the strongest low-level helicity values in this study, although the low-level instability values were the weakest. The higher low-level instability during the other three non-outbreak events may have compensated for the weaker, but still significant, low-level wind shear. Another common trait observed in four of the five events was the location of strong equivalent potential temperature advection at the surface near the locations of the observed supercells and tornadoes.
1. Introduction
While forecasting and warning for tornadoes remains a difficult challenge for operational forecasters everywhere, it’s especially challenging in the eastern Tennessee River Valley where tornadoes are relatively uncommon (compared to areas farther west and south), but occur often enough to warrant concern throughout the year. It has been shown by Concannon et al. 2000 that the frequency of significant tornadoes (F2 or greater) decreases markedly from west-to-east across the Tennessee River Valley (Figure 1). However, with a higher frequency of tornadoes in the eastern Tennessee River Valley compared to other major mountainous regions of the western or northeastern United States, the complex terrain of the eastern Tennessee River Valley (Figure 2) provides a good natural laboratory to investigate supercell environments. Here, the terrain creates many different environmental scenarios (such as cold air damming combining with a dry line in the tornado outbreak documented by Palmer et al. 2009) with different forecasting and warning challenges. The terrain features of the eastern Tennessee River Valley are generally oriented from southwest to northeast and have three distinct areas: the Cumberland Plateau (around 1,500 to 3,000 ft [457 to 914 m] MSL), the Great Tennessee Valley (around 500 to 1,500 ft [152 to 457 m] MSL), and the southern Appalachian Mountains (around 1,500 to 6,500 ft [457 to 1,981 m] MSL). The terrain across the Cumberland Plateau and Great Tennessee Valley is generally flat with an abrupt rise from the Great Tennessee Valley to the Cumberland Plateau and southern Appalachian Mountains. The highest mountain ridges of the southern Appalachian Mountains rise to around the 850-mb level in the atmosphere.
Most of the tornadoes during large outbreaks in the Tennessee River Valley occur in the western half of the Tennessee River Valley (Nunn 1922), where the amount of moisture and instability is normally higher (especially outside of the summer months). In addition, the upper-level dynamics with these outbreak-producing systems are usually stronger over the western half of the Tennessee River Valley, since many of these systems move from the Mississippi River Valley northeastward towards the Great Lakes region (remaining away from the eastern Tennessee River Valley). While the eastern Tennessee River Valley is typically considered the “graveyard” of thunderstorms with supercells relatively uncommon, several significant tornado outbreaks have occurred in this area (e.g., the Super Outbreak of April 1974 [Figure 3]; and the Veterans Day Weekend Outbreak of November 2002 [Figure 4]). In addition, there have been several events during the past decade when numerous supercells formed in this area, but with varying degrees of tornado-producing efficiency. The purpose of this study is to gain insight into why some supercell events have higher tornado-producing efficiency than others by examining five supercell events in the eastern Tennessee River Valley with varying degrees of forecasting and warning decision difficulties.
2. Methodology and Data Analysis
A total of five events that produced supercells across the eastern Tennessee River Valley were chosen for this study. The events were selected based upon the forecasting and warning challenges they presented to operational forecasters. The 15 May 2003 and 25 April 2006 events were a forecast challenge, since the event's supercells and tornadoes were not expected to occur. The 28 April 2002 event was a warning challenge, since tornadoes were expected but did not occur, despite the development of numerous supercells. The 10-11 November 2002 and 8-9 May 2009 outbreak events were well-forecast with timely warnings, but the ratio of supercells-to-tornadoes and the spatial extent of the tornadoes varied greatly between the two events. A previous study of synoptic-scale environments that produced significant tornadoes in the southern Appalachian region (Gaffin and Parker 2006) concluded that mesoscale data would be needed to make any firm conclusions regarding possible terrain enhancement or hindrance on tornado development.
In order to examine the mesoscale features of these five events, data from the Mesoscale Analysis and Prediction System (MAPS) Surface Assimilation System (MSAS; Miller and Benjamin 1992; Miller and Barth 2002) were utilized for this study. The primary MSAS parameter analyzed in this study was equivalent potential temperature, since operational forecasters typically use it to differentiate between opposing air masses in order to locate boundaries. Previous research has shown that preexisting boundaries enhance tornado development with supercells (Maddox et al. 1980; Rogash 1995; Markowski et al. 1998; Atkins et al. 1999). In addition to locating boundaries among differing air masses, higher equivalent potential temperatures also indicate warmer and moister air, and thus, a more unstable air mass. Low-level instability has been found to be important in the generation of tornadoes (Rasmussen and Blanchard 1998; Rasmussen 2003). Thus, locating areas of strong surface advection of higher equivalent potential temperatures should be useful in determining those areas with increasing low-level instability and a greater chance of tornado development.
Since an observed sounding does not exist in the eastern Tennessee River Valley, the Rapid Update Cycle (RUC) model (Benjamin et al. 2004; grid spacing of 20 km from 2002 until 2005, thereafter 13 km, but viewed using 40-km output [RUC40] for all cases) was used to construct the 0-hour (or analysis) soundings for this study. Thompson et al. (2003) found that the RUC model soundings provided a reasonable proxy for observed soundings in supercell environments. While the RUC model has a vertical resolution of 50 levels (with hybrid isentropic-sigma vertical coordinates), the Advanced Weather Interactive Processing System (AWIPS) displays the 0-hour RUC soundings on a coarser grid with a current observed surface point not consistent with the RUC model. As a result, some RUC soundings composed in AWIPS near boundaries are susceptible to unrealistic near-surface plots. Thus, quantitative descriptions of the thermodynamic and dynamic structures of the atmosphere were taken from the AWIPS ‘plan’ view instead of directly from the soundings. In addition to constructing soundings, RUC40 model data were used to examine the bulk shear and storm-relative helicity values in the first kilometer above the surface (0-1 km) during each event, since strong low-level storm-relative helicity has been found to be important in the formation of tornadoes (Moller et al. 1994; Rasmussen and Blanchard 1998; Rasmussen 2003; Thompson et al. 2007). Storm-relative helicity in the RUC40 model is computed using storm motions following Bunkers et al. (2000). Low-level instability was also assessed from RUC40 model data with convective available potential energy (CAPE) integrated from the surface to 3 km using mixed-layer parcels averaged over the bottom 1 km.
3. Events
a. 28 April 2002 event - tornadoes expected, but supercells were not tornadic
On 28 April 2002, operational forecasters were anticipating the possibility of isolated tornadoes across the eastern Tennessee River Valley, and issued several tornado warnings that afternoon due to the development of several supercells (Figure 5). Although eight separate supercells (with strong rotational velocities around 40 kt or greater on the 0.50 storm-relative motion [SRM] radar imagery) developed across the eastern Tennessee River Valley, no tornadoes were ultimately reported during this event. While east Tennessee has remote areas that may explain some of the lack of tornado reports, most of the regional population resides in the Great Tennessee Valley where most of the supercells tracked. By early afternoon, a southwest-to-northeast oriented cold front was slowly approaching the eastern Tennessee River Valley (Figure 6). By 20 UTC, equivalent potential temperatures were increasing at the surface across the central Great Tennessee Valley due to strong advection (Figure 7) from strong southwest winds. A subtle boundary (possibly a warm front or outflow boundary) was present across the central Great Tennessee Valley (along the steep gradient denoted by the dashed line in Figure 6). The boundary could have been created or enhanced by earlier convection that moved across the eastern Tennessee River Valley during the early morning hours. The topography of the Great Tennessee Valley may have also influenced the location of this subtle boundary, since the central part of the valley is where the terrain begins to rise quicker from south-to-north and the orientation of the valley begins to become more northeasterly (instead of north-northeasterly) across northeast Tennessee. Thus, the elevation and orientation of the terrain may have combined to enhance the pooling of low-level moisture across central east Tennessee on the afternoon of 28 April 2002.
Despite steep 0-1 km lapse rates (~9 0C km-1) and strong low-level instability (120-140 J kg-1), the 0-1 km helicity values were somewhat strong (180-190 m2 s-2) but nearly unidirectional with the 0-1 km bulk shear vectors from a westerly direction (Figure 8). In addition, soundings in the central Great Tennessee Valley (Figure 9) revealed that the Lifted Condensation Level (LCL) heights were fairly high (~2982 ft AGL). Previous research (Rasmussen and Blanchard 1998; Rasmussen 2003) has found that low LCL heights (generally below 2625 ft or 800 m AGL) are conducive to the formation of tornadoes. It has been theorized that low LCL heights encourage a relatively warm and unstable rear-flank downdraft in supercells, which ultimately reduces the likelihood of strong, cold outflow which can disrupt the development of tornadoes (Rasmussen and Blanchard 1998; Edwards and Thompson 2000; Markowski et al. 2000, 2002). While the overall instability and shear were adequate enough to produce several supercells during the 28 April 2002 event, the high LCL heights and minimal directional shear likely contributed to the lack of tornadoes.
b. 10-11 November 2002 event - tornado outbreak with low tornado-producing efficiency
The 10-11 November 2002 tornado outbreak (for this study, outbreak is defined as an event that produces five or more tornadoes) was a good example of a well-forecast event that produced nine separate supercells across the eastern Tennessee River Valley (Figures 4 and 10). The ten tornadoes observed across the eastern Tennessee River Valley during this event were mainly confined to the Cumberland Plateau (Figure 11) in the following counties: Morgan (F0 at 2335 UTC and an F3 at 0131 UTC); Scott (F1 at 2340 UTC and another F1 at 2350 UTC); Cumberland (F1 at 0108 UTC, F0 at 0246 UTC, and an F3 at 0343 UTC); Anderson (F2 at 0154 UTC); Van Buren (F2 at 0210 UTC); and Bledsoe (F1 at 0230 UTC). This event was interesting in that no tornadoes were reported farther east across the Great Tennessee Valley, despite the presence of two strong supercells with strong rotational velocities around 45 kt or greater (which were of similar intensity to the tornado-producing supercells on the Cumberland Plateau). While east Tennessee has remote areas that may explain some of the lack of tornado reports, most of the regional population resides in the Great Tennessee Valley. Thus, it appeared that the overall tornado-producing efficiency across the eastern Tennessee River Valley was relatively low during the 10-11 November 2002 event, since there were multiple supercells that did not produce a tornado. By early evening, convection had developed in advance of a pre-frontal trough ahead of a southwest-to-northeast oriented cold front over the western Tennessee River Valley (Figure 12). The equivalent potential temperatures analysis also indicated the possibility of a subtle boundary stretching from near Crossville to near Knoxville, along the steep gradient denoted by the dashed line in Figure 12. This boundary may have resulted from earlier convection that moved across the eastern Tennessee River Valley during the early morning hours. As was seen in the 28 April 2002 event, the rise in elevation and change in orientation of the central Great Tennessee Valley may have also enhanced the pooling of low-level moisture across central east Tennessee on the evening of 10 November 2002. Strong equivalent potential temperature advection (Figure 13) was helping to further strengthen this boundary as the cold front slowly approached the area.
Along the Cumberland Plateau and adjacent areas of the Great Tennessee Valley, the 0-1 km helicity values were very strong (400-420 m2 s-2) with the 0-1 km bulk shear vectors from a southwesterly direction (Figure 14). A RUC40 sounding centered close to the northern Cumberland Plateau (Figure 15) indicated relatively low LCL heights (~1371 ft AGL), while a RUC40 sounding further east in the central Great Tennessee Valley revealed higher LCL heights (~2358 ft AGL) although the 0-1 km wind shear and instability were fairly similar to the other sounding closer to the northern Cumberland Plateau. These findings suggest that the higher LCL heights across the Great Tennessee Valley likely created the lack of tornadoes in the Great Tennessee Valley. With the Great Tennessee Valley located further away from the cold front and the terrain lowering from the Cumberland Plateau into the Great Tennessee Valley, these two factors likely combined to produce higher LCL heights over the Great Tennessee Valley during the 10-11 November 2002 outbreak event.
c. 15 May 2003 event - tornadoes not forecast, but two weak tornadoes occurred
On 15 May 2003, an isolated supercell (Figure 16) moved southeastward from the northern Cumberland Plateau across the central Great Tennessee Valley, and ultimately spawned two weak F1 tornadoes across Knox county at 2110 and 2115 UTC (Figure 17). The SRM radar imagery from KMRX (not shown) indicated that this supercell had moderate rotational velocities around 30 to 35 kt across central east Tennessee. This supercell moved parallel along a northwest-to-southeast oriented quasi-stationary frontal boundary that extended from central Kentucky southeast across central east Tennessee (Figure 18). Strong advection of equivalent potential temperatures was occurring against this stalled frontal boundary across the central Great Tennessee Valley in the vicinity of Knox County (Figure 19).
The RUC40 model indicated that the 0-1 km helicity values were weak (45-55 m2 s-2) across the central Great Tennessee Valley (Figure 20), with the 0-1 km bulk shear vectors from a westerly direction. However, it’s possible that the actual wind shear was stronger along the frontal boundary, since data assimilated into the 20-km RUC model likely did not contain enough observations to capture any small-scale increase in wind shear along the frontal boundary. Since small-scale changes along a frontal boundary are difficult for the RUC40 model to resolve, it’s likely that a model resolution of 10 km or less would be needed to reveal the actual wind shear along a frontal boundary. A RUC40 sounding from the central Great Tennessee Valley (Figure 21) indicated that the 0-1 km lapse rates were fairly steep (~8 0C km-1), which resulted in high levels of 0-1 km instability (100-120 J kg-1). The LCL heights were fairly high (~2222 ft AGL), but were still considered conducive to tornado development (lower than ~2625 ft AGL). With the supercell traveling along the stalled frontal boundary, it was possible that this boundary may have created even lower LCL heights than those able to be resolved by the RUC model. With two tornadoes reported in the central Great Tennessee Valley, the frontal boundary may have induced a small-scale increase in wind shear and lowering of the LCL heights to produce a tornado in an otherwise non-conducive environment for tornado development. Data from a higher-resolution model would be needed to determine if small-scale enhancements occurred along the frontal boundary during this event.
d. 25 April 2006 event - tornadoes not forecast, but weak tornado occurred
On 25 April 2006, operational forecasters considered the large-scale environment around the eastern Tennessee River Valley to be non-conducive to the development of supercells or tornadoes. However, an isolated supercell developed across southwest Virginia (Figure 22) and produced a weak F0 tornado at 2225 UTC in southern Scott County (Figure 23). The SRM radar imagery from KMRX indicated that this supercell had weak to moderate rotational velocities around 20 kt across southern Scott County. This supercell and its associated tornado developed near the remnants of a northwest-to-southeast oriented quasi-stationary frontal boundary located across the southern half of Virginia (Figure 24), with another west-to-east oriented cold front slowly approaching the region from the Ohio River Valley. The path of the tornado-producing supercell was also parallel to the west-to-east oriented Clinch Mountain range, with this mountain range likely causing the quasi-stationary frontal boundary to settle parallel to it. Strong southwesterly winds in the Great Tennessee Valley were creating strong advection of equivalent potential temperatures across northeast Tennessee and southwest Virginia (Figure 25), with moderately strong 0-1 km helicity values (110-130 m2 s-2) in these areas as well (Figure 26). The proximity sounding (Figure 27) revealed fairly high LCL heights (~2911 ft AGL), but steep 0-1 km lapse rates (~9 0C km-1) which resulted in high 0-1 km instability (100-120 J kg-1). As with the 15 May 2003 event, it was possible that the tight frontal boundary created lower LCL heights than those able to be resolved by the 13-km RUC model. While the large-scale environment initially appeared to be non-conducive to supercell and tornado development, the thunderstorm that moved parallel to the frontal boundary likely encountered stronger low-level wind shear and lower LCL heights which ultimately resulted in this storm rotating and producing a tornado.
e. 8-9 May 2009 event - tornado outbreak with high tornado-producing efficiency
The 8-9 May 2009 event produced only three supercells (Figure 28), but a total of nine separate tornado tracks were reported across both the Cumberland Plateau and the Great Tennessee Valley (Figure 29). This event experienced a high tornado-producing efficiency (since every supercell produced at least one tornado) with tornadoes reported in the following counties: McMinn (EF0 at 2103 UTC), Fentress (EF1 at 2115 UTC), Scott (EF2 at 2158 UTC), Claiborne (EF2 at 2315 UTC), Grainger/Hancock (EF1 at 2340 UTC), Washington (EF0 at 0045 UTC), Wise (EF2 at 0145 UTC), and Russell (EF0 at 0225 UTC and an EF2 at 0227 UTC). The most significant supercell developed across the northern Cumberland Plateau counties of Pickett and Fentress Counties (Figure 28), and then moved eastward into Scott County. This long-lived tornadic supercell had strong rotational velocities around 45 kt or greater across northeast Tennessee, and moved farther eastward to just south of the Tri-Cities Airport before dissipating. A total of five tornadoes were reported from this supercell. Later in the evening, another supercell moved from southeast Kentucky into southwest Virginia and produced three tornadoes. This tornado-producing supercell had strong rotational velocities around 45 kt or greater across southwest Virginia, and eventually moved southeastward into far northwestern North Carolina where it produced an EF3 tornado. A total of four tornadoes were reported with this supercell.
A quasi-stationary frontal boundary was located across the northern Cumberland Plateau, northeast Tennessee, and southwest Virginia throughout the late afternoon and evening (Figure 30), with only weak advection of equivalent potential temperature over the northern half of east Tennessee (Figure 31). A pocket of lower equivalent potential temperatures was located over the northern Cumberland Plateau at 22 UTC, where convection earlier in the day likely had left an outflow of lower temperatures and dewpoints. The higher elevation of the northern Cumberland Plateau likely influenced the location and long duration of this outflow by delaying or even preventing the rapid return of warmer and more moist air from the southwest. The initial tornadoes over Fentress and Scott Counties occurred in the vicinity of this outflow boundary (along the steep gradient denoted by the dashed line in Figure 30). The 0-1 km helicity values were very strong (350-370 m2 s-2) over the northern half of east Tennessee and southwest Virginia (Figure 32). The 0-1 km bulk shear vectors were from the southwest with values ranging from 35 to 45 kt. RUC40 soundings (Figure 33) from the northern Cumberland Plateau (near the location of the EF2 tornado) and from southeast Tennessee, where no supercells developed after 22 UTC, revealed lower LCL heights over the northern Cumberland Plateau (~1594 ft AGL); but also weaker mid-level lapse rates over southeast Tennessee (~5 0C km-1). These findings indicated that the air mass was very favorable for tornado-genesis over east Tennessee and southwest Virginia. The limited coverage of storms across the central and southern counties of east Tennessee was likely due to the mid-level stable layer noted by the RUC40 sounding centered over Meigs County. This lack of storms across the region likely allowed the isolated supercell over northeast Tennessee to remain long-lived and strong, and it ultimately produced numerous tornadoes likely due to the fact that it remained close to the quasi-stationary frontal boundary for several hours.
4. Discussion
A summary of the severe weather parameters associated with the five supercell events examined in this study (Table 1) revealed a variety of similarities and differences in the large-scale environments. In terms of wind shear, the 10-11 November 2002 and 8-9 May 2009 events (the two tornado outbreak events in this study) experienced the strongest 0-1 km bulk shear and helicity values in the study, although the instability values (0-3 km CAPE for mixed-layer parcels and lapse rates) were the weakest. While the strongest 0-1 km wind shear was present with these two outbreak events, the higher mixed-layer instability during the other three non-outbreak events may have compensated for the weaker (but still significant) 0-1 km wind shear in producing supercells. The results in this study are similar to those found in the Gaffin and Parker (2006) study where a comparison of the composites of weak, significant, and outbreak tornado events revealed that wind dynamics were more important than instability in the distinction between weak and significant tornado events across the southern Appalachian region. In addition to strong 0-1 km wind shear during the two tornado outbreak events, the LCL heights near the locations of the tornadoes were also relatively low in both events. While the 0-1 km wind shear and LCL heights during the 15 May 2003 event did not appear to be conducive for tornado development, the quasi-stationary frontal boundary (where the supercell tracked) likely created higher helicity values and lower LCL heights than the 40-km output from the 20-km RUC model was able to resolve. The quasi-stationary frontal boundary across southwest Virginia during the 25 April 2006 event also likely resulted in higher helicity values and lower LCL heights than the 40-km output from the 13-km RUC model indicated. However, future research should examine higher resolution model data to determine if these frontal boundaries did indeed create higher helicity values and lower LCL heights.
The terrain of the eastern Tennessee River Valley also appeared to influence the location and orientation of the surface boundaries across the region. During the 28 April 2002 event (the only event in this study where supercells were observed but no tornadoes were reported), the topography of the Great Tennessee Valley may have enhanced the pooling of moisture across central east Tennessee where the terrain begins to rise quicker from south-to-north and the orientation of the valley begins to become more northeasterly (instead of north-northeasterly). The instability parameters (0-3 km mixed-layer CAPE and lapse rate) on 28 April 2002 appeared to be conducive to tornado development, but the high LCL heights, lack of low-level directional wind shear, and the track of the supercells away from a well-defined surface boundary (which could have increased the 0-1 km wind shear and lowered the LCL heights) likely caused the lack of tornado development. While the 10-11 November 2002 tornado outbreak event also occurred away from a well-defined boundary, a more subtle boundary (possibly the result of overnight convection and the terrain-enhanced pooling of moisture in the central Great Tennessee Valley) was evident near the location of several of the observed tornadoes. This outbreak event was also interesting in that its tornadoes were confined to the Cumberland Plateau, with no tornadoes reported farther east in the Great Tennessee Valley. This finding was likely the result of higher LCL heights over the Great Tennessee Valley, which was due to the farther distance from the cold front and the lowering terrain of the Great Tennessee Valley from the Cumberland Plateau. During the 25 April 2006 event, the terrain appeared to influence the development of the tornado-producing supercell by causing the quasi-stationary frontal boundary to become parallel to the west-to-east oriented Clinch Mountain Range, and thus providing a conducive environment for the supercell that tracked parallel to the boundary for a long duration. The higher elevations of the northern Cumberland Plateau appeared to influence the development of some tornadoes during the 8-9 May 2009 event by enhancing an outflow boundary with the delay, or even prevention, of rapid return of warmer and more moist air from the southwest.
Overall, the events with a high tornado-producing efficiency (15 May 2003, 25 April 2006, 8-9 May 2009) had a well-defined preexisting boundary in close proximity to the path of the tornado-producing supercells. In contrast, the events with a low tornado-producing efficiency (28 April 2002, 10-11 November 2002) were not located close to a well-defined boundary. Another interesting observation was the fact that the three events with high tornado-producing efficiency occurred near a west-to-east oriented quasi-stationary frontal boundary, while the two events with low tornado-producing efficiency occurred ahead of a south-to-north oriented cold front. This finding was noteworthy because the west-to-east propagating supercells likely encountered lower LCL heights (and higher helicity values) for a longer distance along the west-to-east oriented quasi-stationary frontal boundaries in the high tornado-producing efficiency events. In the low tornado-producing efficiency events, the west-to-east propagating supercells encountered higher LCL heights (and lower helicity values) the farther they propagated away from the south-to-north oriented cold fronts, especially across the Great Tennessee Valley where the lowering elevation from the Cumberland Plateau aided in the higher LCL heights.
An axis of strong advection of equivalent potential temperatures was also present during almost every event near the locations of the observed supercells and tornadoes. The only exception was the 8-9 May 2009 tornado outbreak event, when only weak advection was observed. It’s possible that this weak advection (in combination with a mid-level stable layer) kept the few supercells that did form during this event isolated and long-lived. The isolated supercell across northeast Tennessee likely became prolific in producing several tornadoes since it remained near a quasi-stationary frontal boundary for several hours. The results of this study will hopefully increase the situational awareness of forecasters in the region on days when supercells and/or tornadoes are expected.
Acknowledgments
The authors would like to thank Dr. Michael Brown (Mississippi State University), Stephen Jascourt (University Corporation for Atmospheric Research (UCAR)), and Chris Smallcomb (National Weather Service (NWS) Western Region Headquarters) for their helpful reviews of this manuscript.
Authors
David Gaffin has been a Senior Forecaster with the National Weather Service since January 2002, and has been stationed at Morristown, Tennessee since August 1998. He began his NWS career at Weather Service Forecast Office (WSFO) Memphis, Tennessee in March 1994. His research interests include tornadoes, gravity/mountain waves, wake lows, and local climatological studies. He has a B.A. degree (1990) in economics from the University of Tennessee-Knoxville and a M.S. degree (1993) in meteorology from Texas A&M University.
David Hotz has been the Science and Operations Officer with the National Weather Service at Morristown, Tennessee since June 2005. He began his NWS career at WSO Bristol, Tennessee in August 1986, and then transferred to Agricultural Weather Service Center (AWSC) Stoneville, Mississippi as an Agricultural Forecaster in January 1988. In December 1990, he transferred to the NWSO Amarillo, Texas as a Journeyman Forecaster, and then to NWSO Morristown, Tennessee as a Senior Forecaster in September 1994. His interests include developing local computer applications, northwest flow snowfall, severe storms, and local climatological studies. He has a B.S. degree (1986) in Agricultural Meteorology from Purdue University.
References
Atkins, N. T., M. L. Weisman, and L. J. Wicker, 1999: The influence of preexisting boundaries on supercell evolution. Mon. Wea. Rev., 127, 2910-2927.
Benjamin, S. G., and Coauthors, 2004: An hourly assimilation-forecast cycle: The RUC. Mon. Wea. Rev., 132, 495-518.
Bunkers, M. J., and Coauthors, 2000: Predicting supercell motion using a new hodograph technique. Wea. Forecasting, 15, 61-79.
Concannon, P. R., H. E. Brooks, and C. A. Doswell III, 2000: Climatological risk of strong to violent tornadoes in the United States. Preprints, Second Symposium on Environmental Applications, Long Beach, CA, Amer. Meteor. Soc., 212-219.
Edwards, R., and R. L. Thompson, 2000: RUC-2 supercell proximity soundings, Part II: an independent assessment of supercell forecast parameters. Preprints, 20th Conf. on Severe Local Storms, Orlando, FL, Amer. Meteor. Soc., 435-438.
Fujita, T., 1975: Super outbreak of tornadoes of April 3-4, 1974. Map printed by University of Chicago Press.
Maddox, R. A., L. R. Hoxit, and C. F. Chappell, 1980: A study of tornadic thunderstorm interactions with thermal boundaries. Mon. Wea. Rev., 108, 322-336.
Markowski, P. M., E. N. Rasmussen, and J. M. Straka, 1998: The occurrence of tornadoes in supercells interacting with boundaries during VORTEX-95. Wea. Forecasting, 13, 852-859.
Markowski, P. M., J. M. Straka, and E. N. Rasmussen, 2000: Surface thermodynamic characteristics of rear flank downdrafts as measured by a mobile mesonet. Preprints, 20th Conf. on Severe Local Storms, Orlando, FL, Amer. Meteor. Soc., 251-254.
Markowski, P. M., J. M. Straka, and E. N. Rasmussen, 2002: Direct surface thermodynamic observations within the rear-flank downdrafts of nontornadic and tornadic supercells. Mon. Wea. Rev., 130, 1692-1721.
Miller, P. A., and M. F. Barth, 2002: The AWIPS Build 5.2.2 MAPS Surface Assimilation System (MSAS). Preprints, Interactive Symposium on the Advanced Weather Interactive Processing System (AWIPS), Orlando, FL, Amer. Meteor. Soc., J3.9.
Miller, P. A., and S. G. Benjamin, 1992: A system for the hourly assimilation of surface observations in mountainous and flat terrain. Mon. Wea. Rev., 120, 2342-2359.
Moller, A. R., C. A. Doswell, M. P. Foster, and G. R. Woodall, 1994: The operational recognition of supercell thunderstorm environments and storm structures. Wea. Forecasting, 9, 327-347.
Nunn, R., 1922: Records of tornadoes in Tennessee, 1808-1921. Mon. Wea. Rev., 50, 485-486.
Palmer, T. D., L. P. Rothfusz, S. E. Nelson, and B. A. Miller, 2009: Analysis of cross-spectrum supercells during the north Georgia tornado event of 2 January 2006. Natl. Wea. Dig., 33, 57-75.
Rasmussen E. N., and D. O. Blanchard, 1998: A baseline climatology of sounding-derived supercell and tornado forecast parameters. Wea. Forecasting, 13, 1148-1164.
Rasmussen E. N., 2003: Refined supercell and tornado forecast parameters. Wea. Forecasting, 18, 530-535.
Rogash, J. A., 1995: The relationship between longer-lived surface boundaries and low pressure centers with the occurrence of strong to violent tornadoes. Natl. Wea. Dig., 20, 30-33.
Thompson, R. L., C. M. Mead, and R. Edwards, 2007: Effective storm-relative helicity and bulk shear in supercell thunderstorm environments. Wea. Forecasting, 22, 102-115.
Thompson, R. L., R. Edwards, J. A. Hart, K. L. Elmore, and P. Markowski, 2003: Close proximity soundings within supercell environments obtained from the Rapid Update Cycle. Wea. Forecasting, 18, 1243-1261.
Table 1. Severe weather parameters from RUC40 data near the locations of the strongest tornadoes or supercells.
|
Events and Times
|
Outbreak?
(# of tornadoes in study area)
|
0-1 km
Bulk Shear (kt)
|
0-1 km Helicity
(m2 s-2)
|
0-3 km
mixed-layer
CAPE
(J kg-1)
|
0-1 km
Lapse Rate
(0C km-1)
|
LCL Height
(AGL)
|
|
28 Apr 2002
at 20 UTC
|
No
(0)
|
WSW 15-20
|
180-190
|
120-140
|
9
|
909 m
(2982 ft)
|
|
11 Nov 2002
at 02 UTC
|
Yes
(10)
|
SW 40-45
|
400-420
|
70-90
|
6
|
418 m
(1371 ft)
|
|
15 May 2003
at 21 UTC
|
No
(2)
|
W 10-15
|
45-55
|
100-120
|
8
|
677 m
(2222 ft)
|
|
25 Apr 2006
at 22 UTC
|
No
(1)
|
SW 25-30
|
110-130
|
100-120
|
9
|
887 m
(2911 ft)
|
|
8 May 2009
at 22 UTC
|
Yes
(9)
|
SW 40-45
|
350-370
|
60-80
|
6
|
486 m
(1594 ft)
|
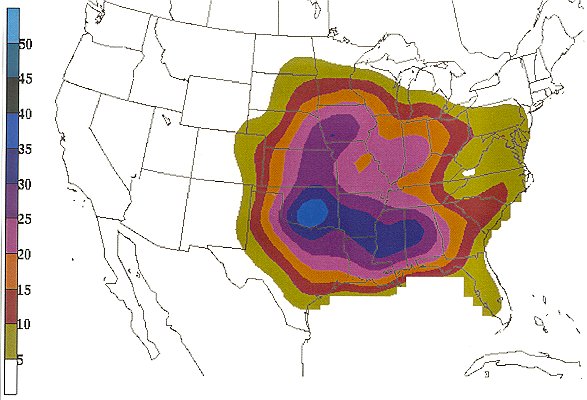
Figure 1. Based on data from 1921 to 1995, mean number of days per century with at least one F2 or greater tornado within 25 miles of a point (from Concannon et al. 2000).

Figure 2. Relief map of the eastern Tennessee River Valley with locations of observation sites (color scale denotes elevations in ft x 1000 [1000 ft = 304.8 m]; boldface font denotes geographic features; capitalized boldface font denotes state names; lines denote county boundaries; boldest lines denote state boundaries).
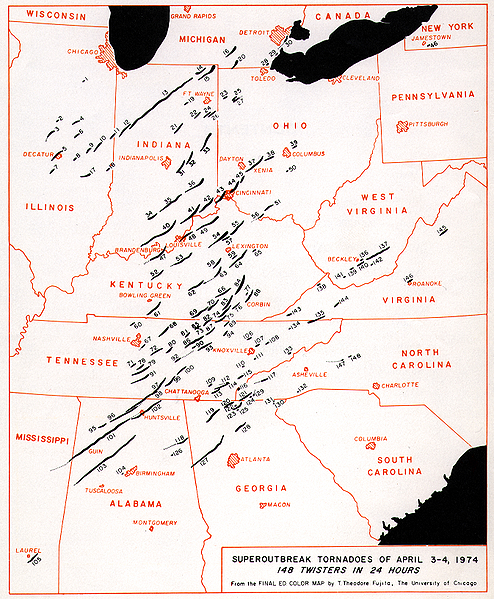
Figure 3. Tracks of the Super Outbreak tornadoes on 3-4 April 1974 (documented by Fujita 1975).
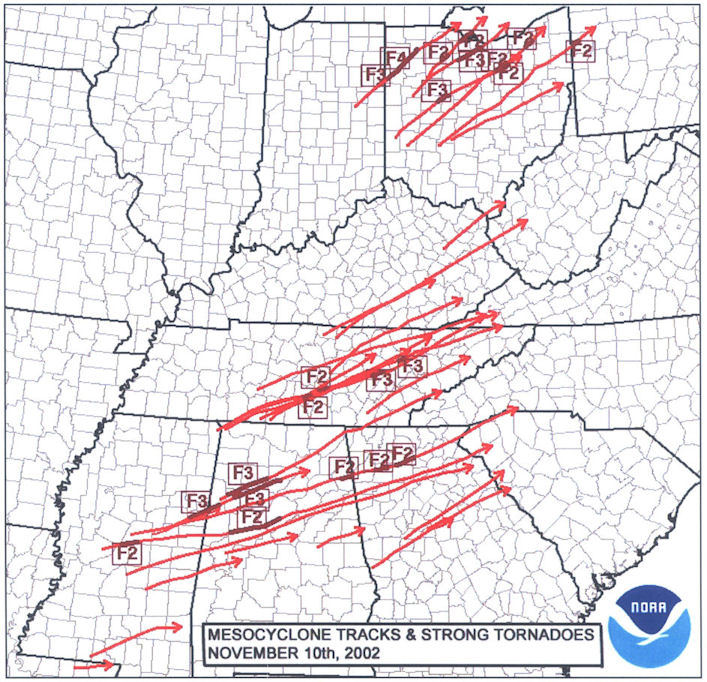
Figure 4. Tracks of mesocyclones (red) and F2 or stronger tornadoes (maroon) on 10-11 November 2002 (documented by NOAA 2003).
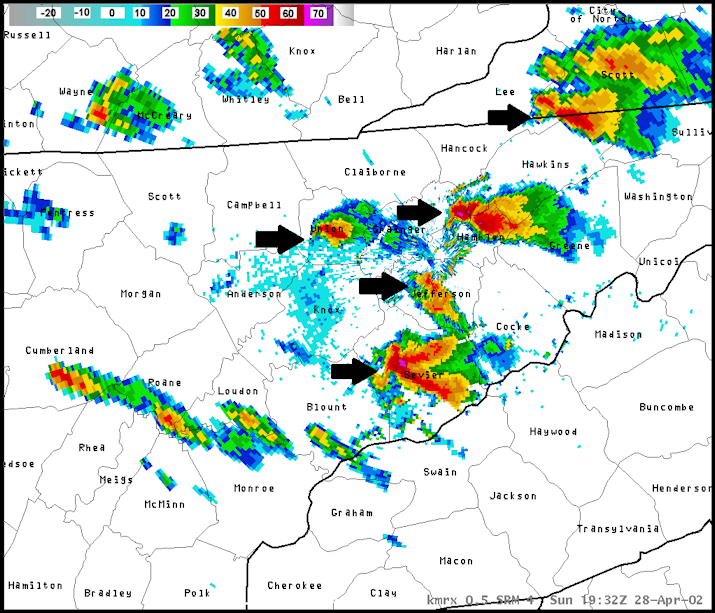
Figure 5. Morristown (KMRX) radar reflectivity (dBZ) imagery on 28 April 2002 at 1932 UTC (arrows denote locations of supercells; lines denote county boundaries; bold lines denote state boundaries; text denotes county names).
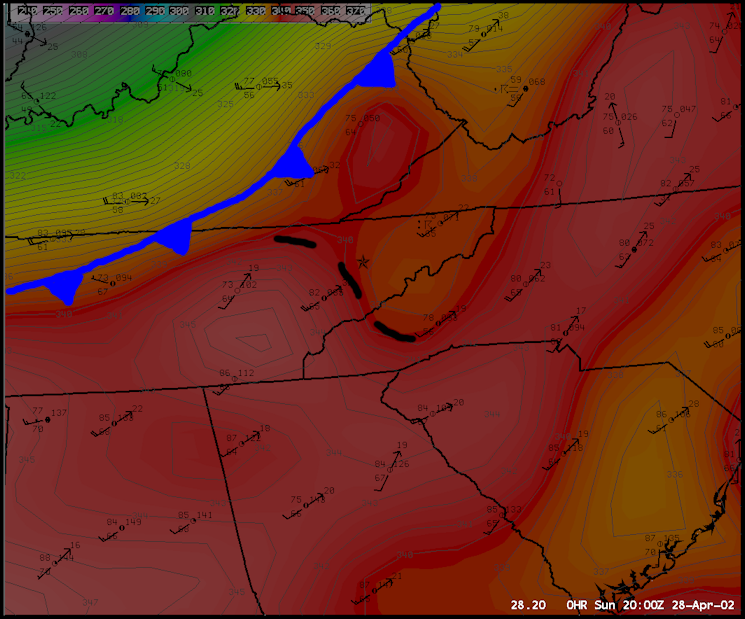
Figure 6. Surface observation plot with MSAS equivalent potential temperature (K) and frontal analysis on 28 April 2002 at 20 UTC (star shows the location of RUC40 sounding).
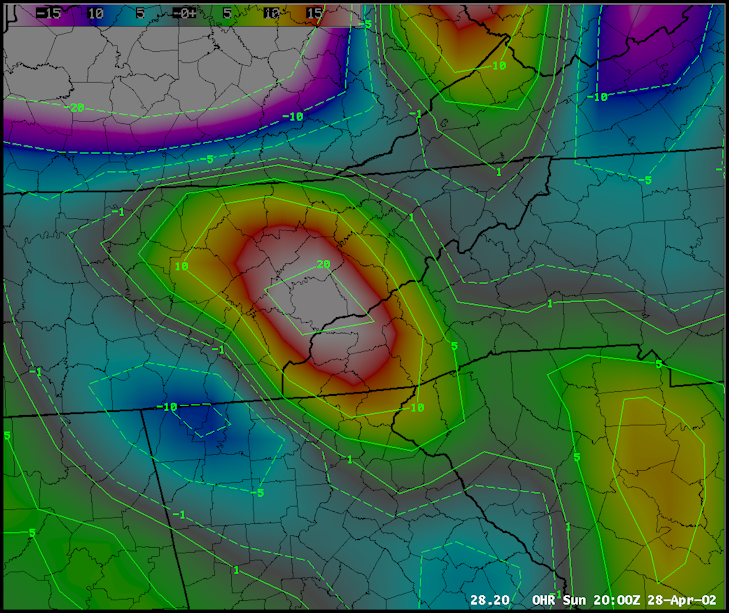
Figure 7. MSAS equivalent potential temperature advection (0C 12 hr-1) on 28 April 2002 at 20 UTC.

Figure 8. RUC40 helicity (m2 s-2) and bulk shear vectors (kt) between 0 and 1 km AGL on 28 April 2002 at 20 UTC.
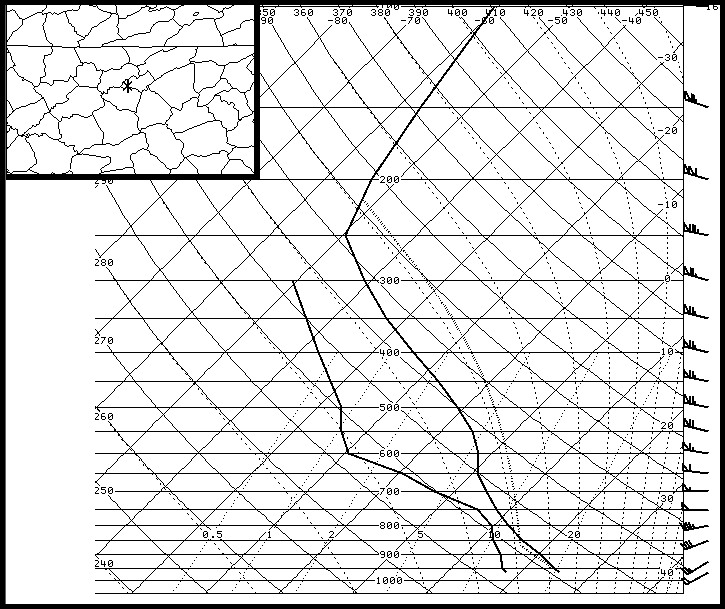
Figure 9. RUC40 sounding on 28 April 2002 in western Hamblen County at 20 UTC.

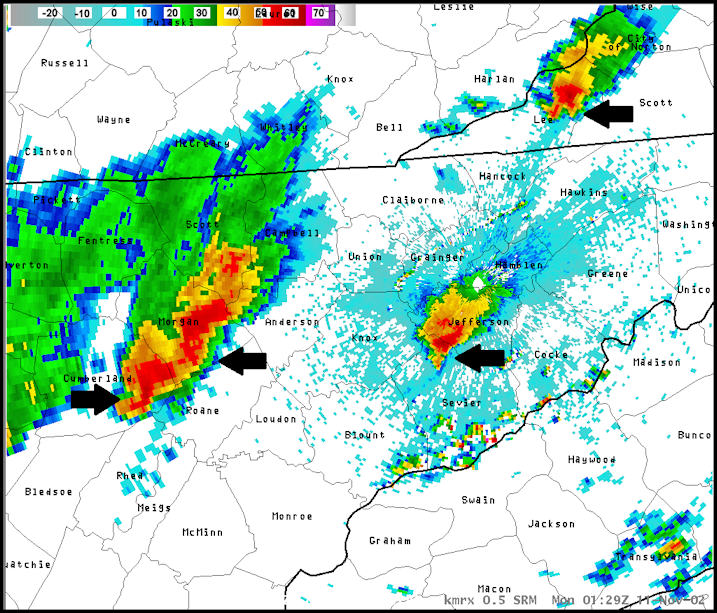
Figure 10. KMRX radar reflectivity (dBZ) imagery on 10 November 2002 at 2349 UTC (top) and on 11 November 2002 at 0129 UTC (bottom) (arrows denote locations of supercells; lines denote county boundaries; bold lines denote state boundaries; text denotes county names).
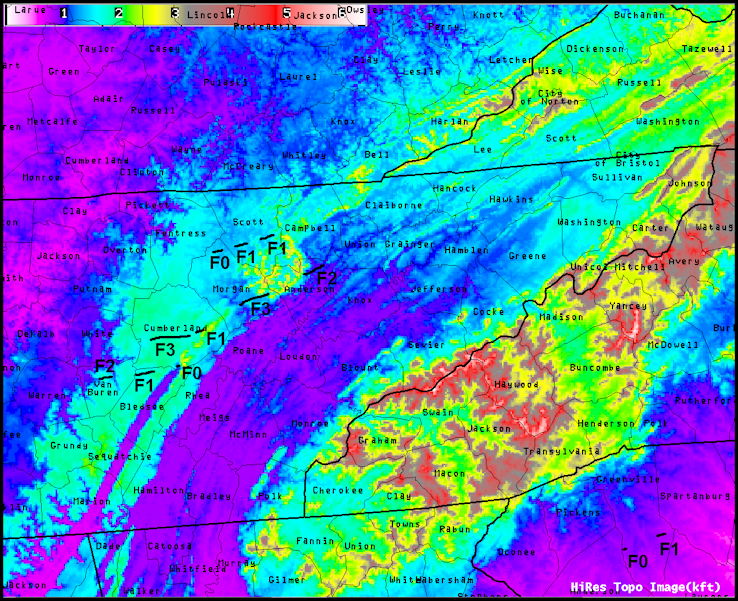
Figure 11. Tornado tracks (including Fujita-scale ranking and relief map) on 10-11 November 2002 around the eastern Tennessee River Valley (lines denote county boundaries; bold lines denote state boundaries; text denotes county names).
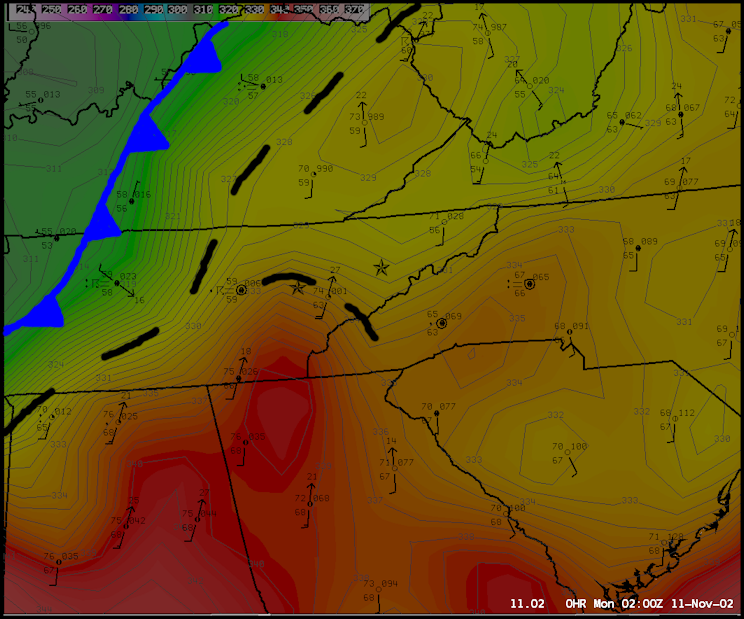
Figure 12. Surface observation plots with MSAS equivalent potential temperature (K) and frontal analysis on 11 November 2002 at 02 UTC (stars show the locations of RUC40 soundings).
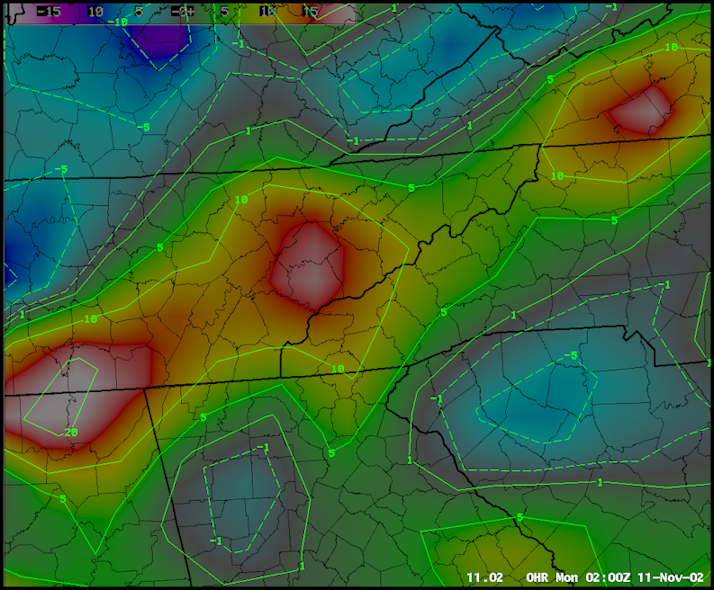
Figure 13. MSAS equivalent potential temperature advection (0C 12 hr-1) on 11 November 2002 at 02 UTC.
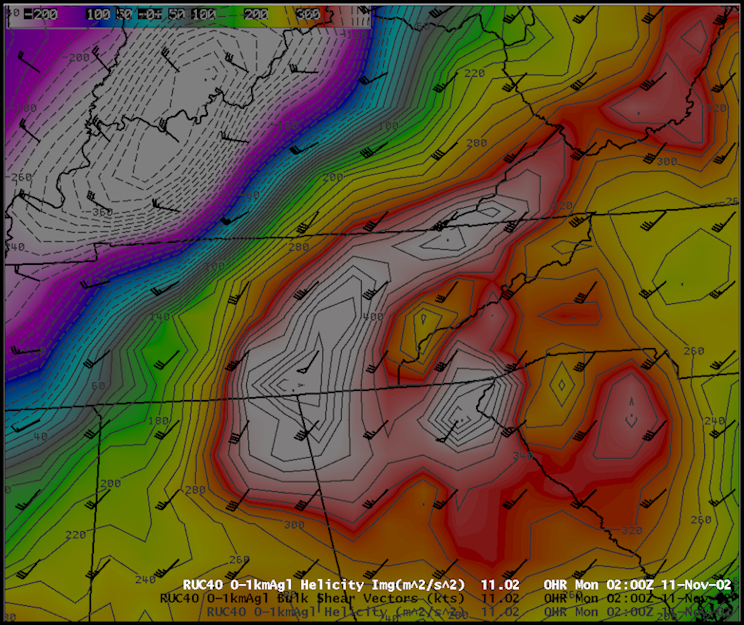
Figure 14. RUC40 helicity (m2 s-2) and bulk shear vectors (kt) between 0 and 1 km AGL on 11 November 2002 at 02 UTC.
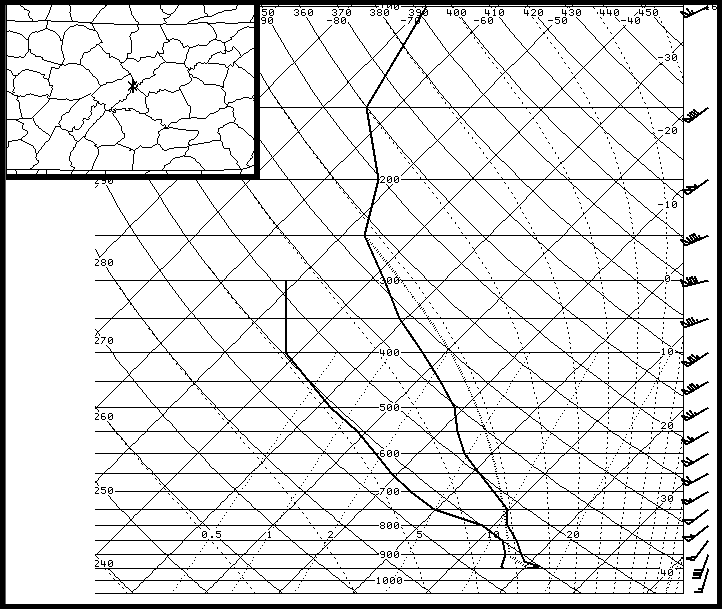

Figure 15. RUC40 soundings on 11 November 2002 at 02 UTC in eastern Roane County (top) and eastern Jefferson County (bottom).
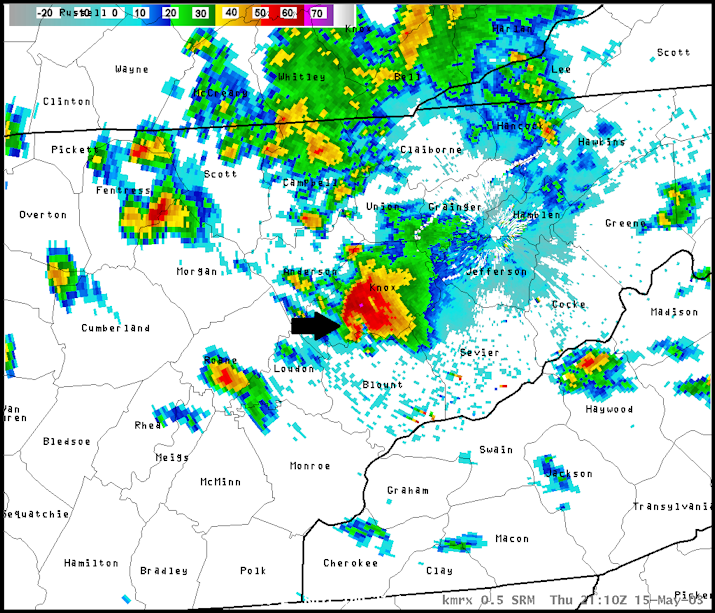
Figure 16. KMRX radar reflectivity (dBZ) imagery on 15 May 2003 at 2110 UTC (arrows denote locations of supercells; lines denote county boundaries; bold lines denote state boundaries; text denotes county names).
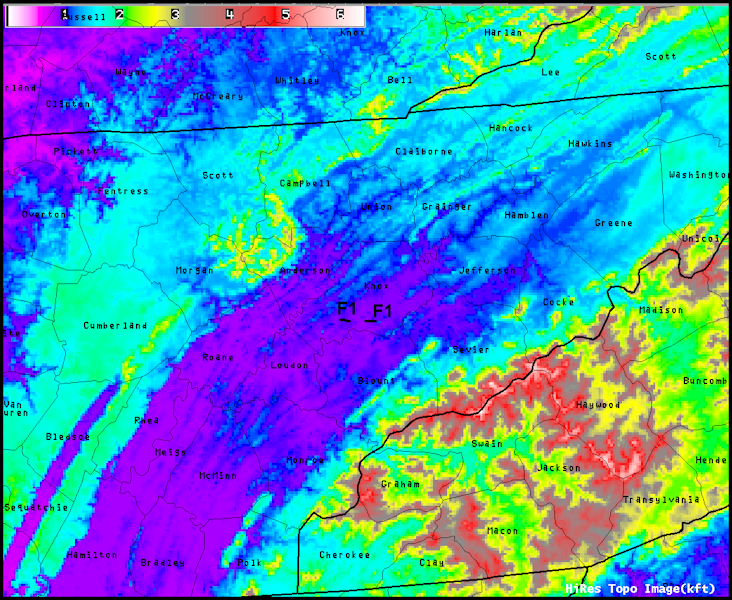
Figure 17. Tornado tracks (including Fujita-scale ranking and relief map) on 15 May 2003 around the eastern Tennessee River Valley (lines denote county boundaries; bold lines denote state boundaries; text denotes county names).
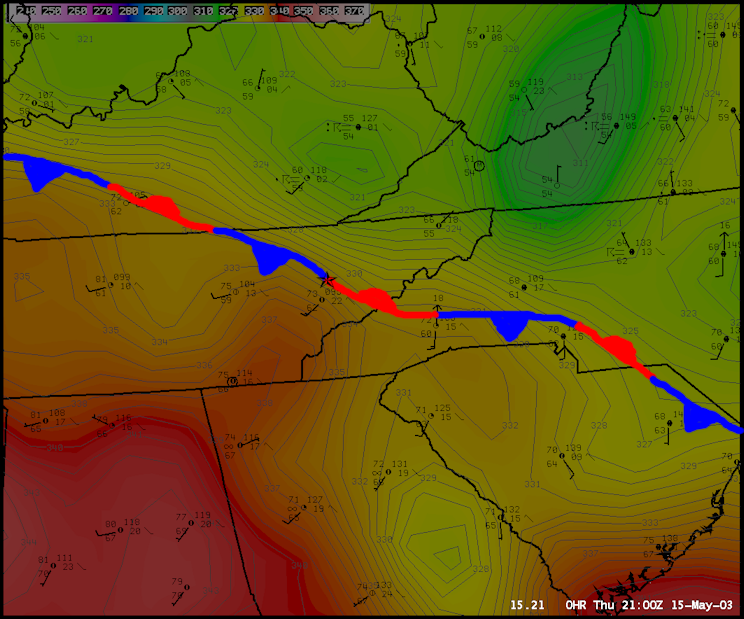
Figure 18. Surface observation plot with MSAS equivalent potential temperature (K) and frontal analysis on 15 May 2003 at 21 UTC (star shows the location of RUC40 sounding).
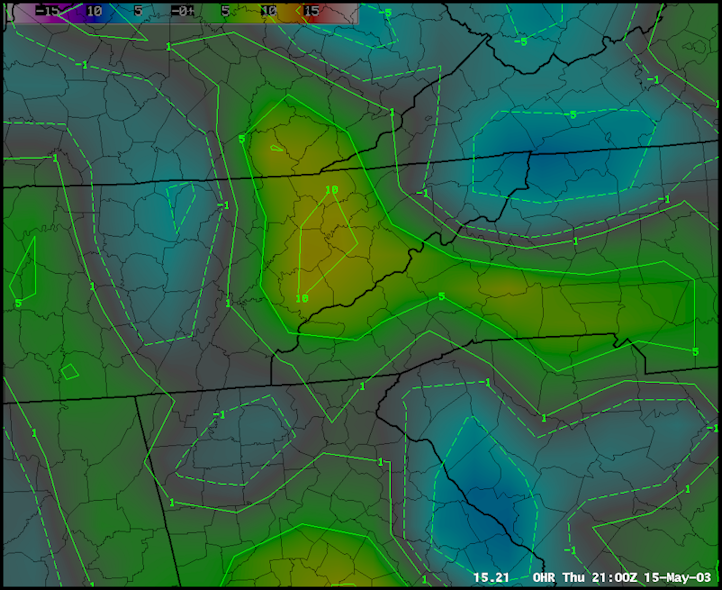
Figure 19. MSAS equivalent potential temperature advection (0C 12 hr-1) on 15 May 2003 at 21 UTC.
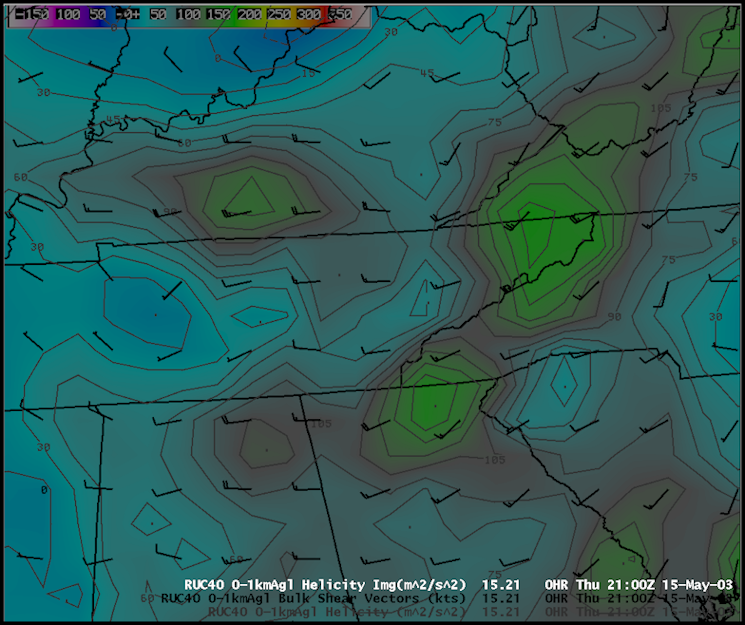
Figure 20. RUC40 helicity (m2 s-2) and bulk shear vectors (kt) between 0 and 1 km AGL on 15 May 2003 at 21 UTC.

Figure 21. RUC40 sounding on 15 May 2003 at 21 UTC in central Knox County.

Figure 22. KMRX radar reflectivity (dBZ) imagery on 25 April 2006 at 2224 UTC (arrows denote locations of supercells; lines denote county boundaries; bold lines denote state boundaries; text denotes county names).
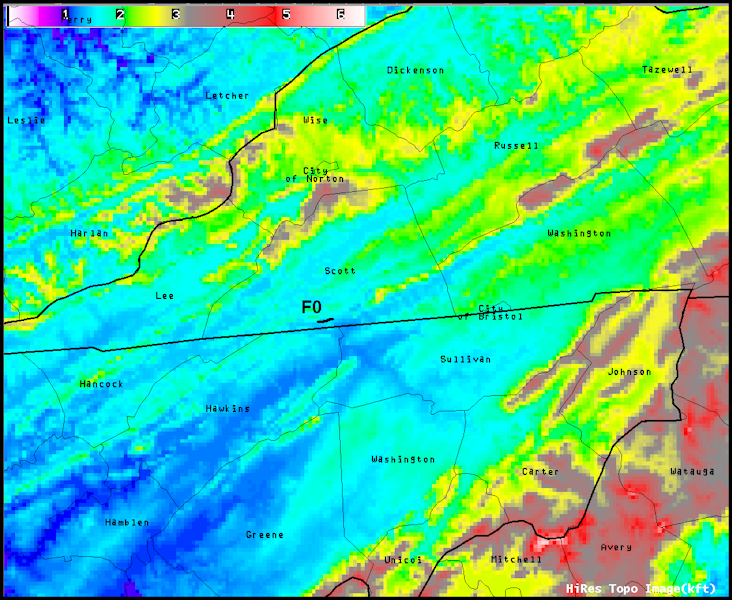
Figure 23. Tornado tracks (including Fujita-scale ranking and relief map) on 25 April 2006 around the eastern Tennessee River Valley (lines denote county boundaries; bold lines denote state boundaries; text denotes county names).
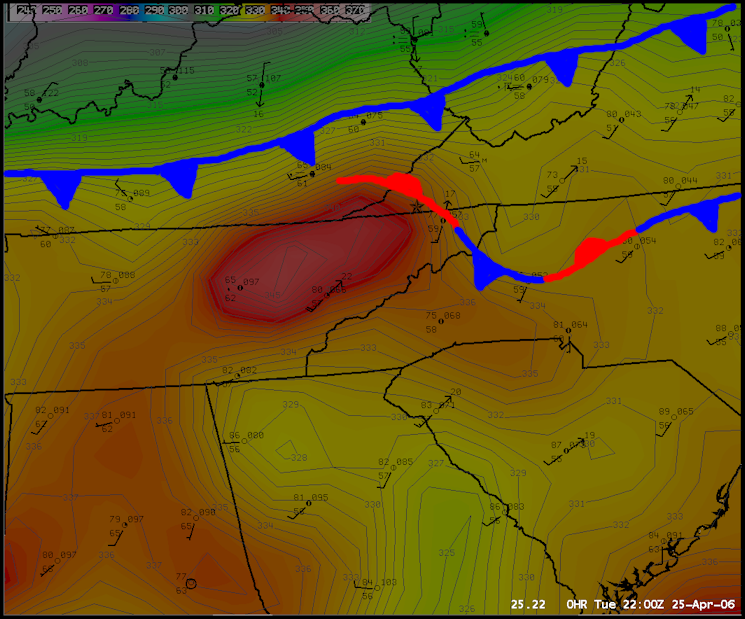
Figure 24. Surface observation plot with MSAS equivalent potential temperature (K) and frontal analysis on 25 April 2006 at 22 UTC (star shows the location of RUC40 sounding).
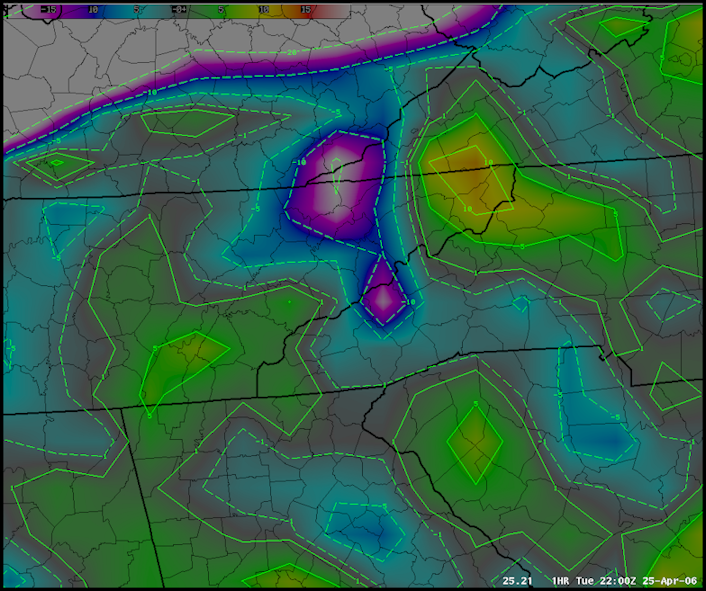
Figure 25. MSAS equivalent potential temperature advection (0C 12 hr-1) on 25 April 2006 at 22 UTC.

Figure 26. RUC40 helicity (m2 s-2) and bulk shear vectors (kt) between 0 and 1 km AGL on 25 April 2006 at 22 UTC.
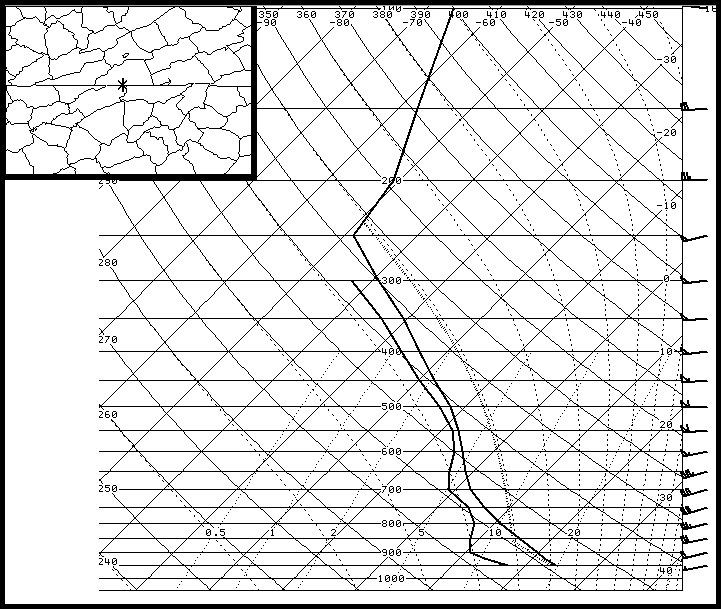
Figure 27. RUC40 sounding on 25 April 2006 at 22 UTC in southern Scott County.

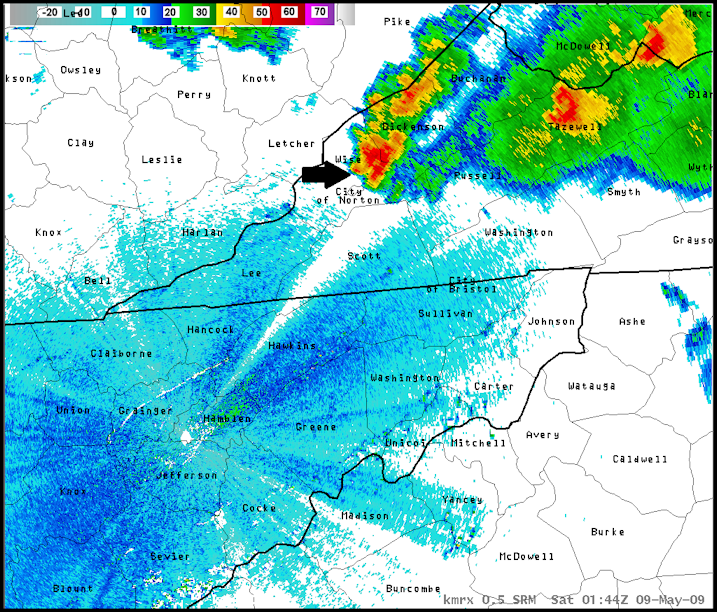
Figure 28. KMRX radar reflectivity (dBZ) imagery on 8 May 2009 at 2158 UTC (top) and on 9 May 2009 at 0144 UTC (bottom) (arrows denote locations of supercells; lines denote county boundaries; bold lines denote state boundaries; text denotes county names).

Figure 29. Tornado tracks (including Fujita-scale ranking and relief map) on 8-9 May 2009 around the eastern Tennessee River Valley (lines denote county boundaries; bold lines denote state boundaries; text denotes county names).
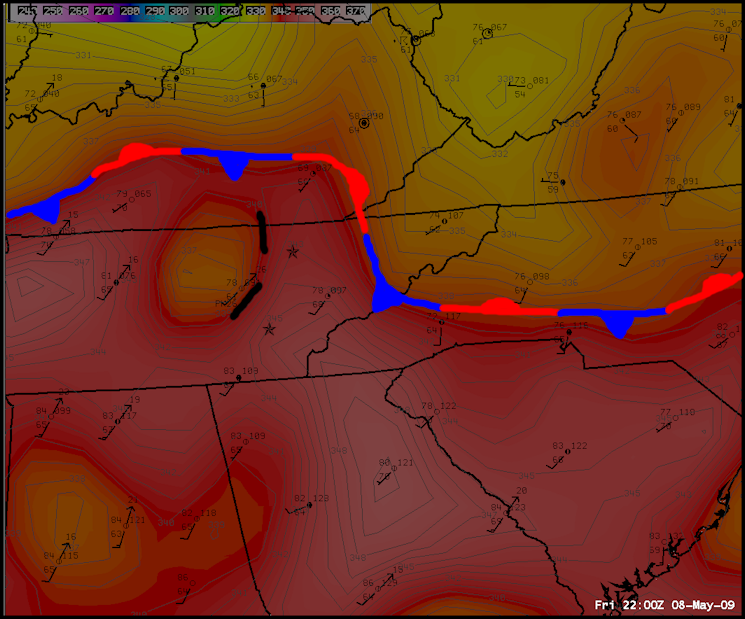

Figure 30. Surface observation plots with MSAS equivalent potential temperature (K) and frontal analysis on 8 May 2009 at 22 UTC (top; stars show the locations of RUC40 soundings) and on 9 May 2009 at 02 UTC (bottom).

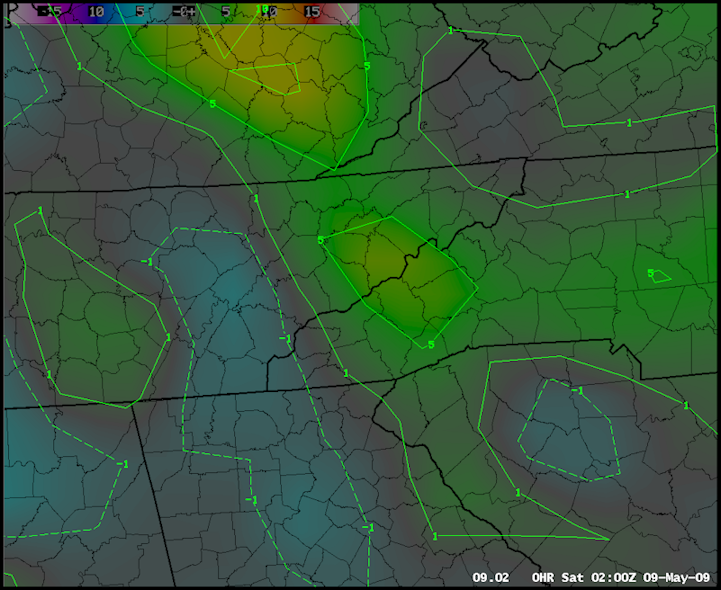
Figure 31. MSAS equivalent potential temperature advection (0C 12 hr-1) on 8 May 2009 at 22 UTC (top) and on 9 May 2009 at 02 UTC (bottom).


Figure 32. RUC40 helicity (m2 s-2) and bulk shear vectors (kt) between 0 and 1 km AGL on 8 May 2009 at 22 UTC (top) and on 9 May 2009 at 02 UTC (bottom).
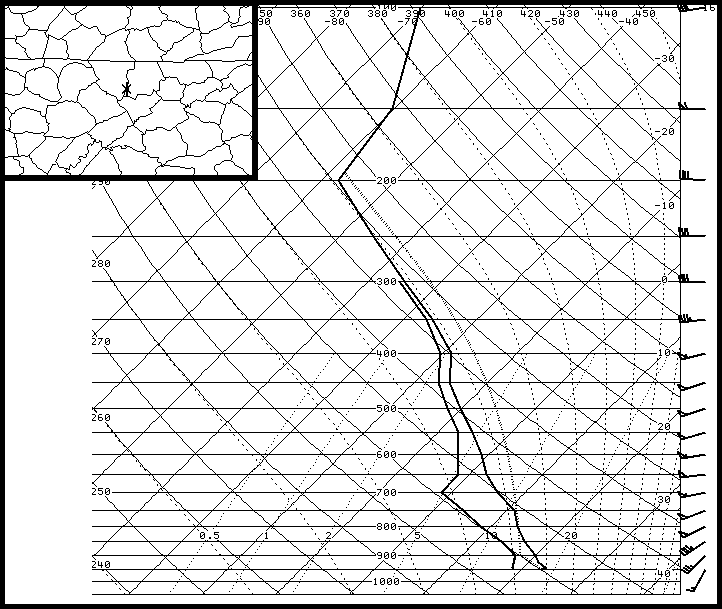
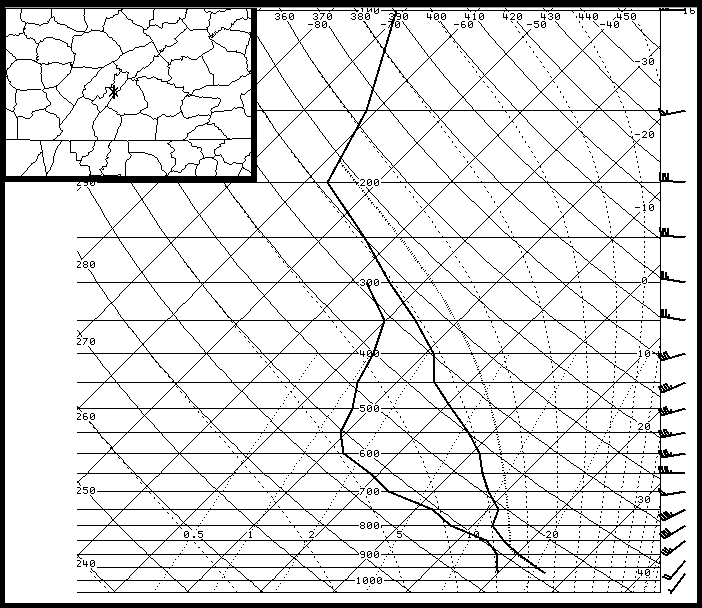
Figure 33. RUC40 soundings on 8 May 2009 at 22 UTC in southeastern Scott County (top) and central Meigs County (bottom).


 Local Radar
 Huntsville Radar
 Regional Satellite
 Graphical Forecast
 Weather Map
 Daily Graphics
 Follow us on YouTube