The Influence of Terrain during the 27 April 2011 Super Tornado Outbreak and 5 July 2012 Derecho around the Great Smoky Mountains National Park
by
David M. Gaffin
ABSTRACT
- The complex terrain around the Great Smoky Mountains National Park appeared to have influenced the evolution of two significant convective events and the resulting location of the extensive tree damage. During the Super Tornado Outbreak of 27 April 2011, an EF4 tornado moved across the Tennessee side of the Park creating a long path of fallen trees. The initiation of this violent tornado coincided with the opening of the southeast-to-northwest oriented Little Tennessee River Valley. Several other tornado tracks during the Super Outbreak initiated near the openings of other southeast-to-northwest oriented valleys located farther northeast up along the southern Appalachian Mountain range. It appeared that the strong southeasterly boundary-layer winds observed on 27 April 2011 may have accelerated through these valleys (due to constricted flow), and could have encouraged tornadogenesis within the northeast-propagating supercells.
- Another significant blowdown of trees occurred in the Park on 5 July 2012, as a derecho moved southwest across the Great Tennessee Valley. There were several reports of strong northeasterly winds in excess of 60 mph at several observation sites within the Park. Northeasterly winds are an unusual direction to observe high winds in the southern Appalachian region, which may have contributed to the significance of the tree damage. The most significant tree damage occurred within the Laurel Creek valley and near Cades Cove, where pockets of damage were observed mainly in areas that had a good open view to the northeast direction. On the Tennessee side of the Park, there are no mountain barriers to slow down or block winds from a northeasterly direction. Chilhowee Mountain normally blocks strong westerly winds from reaching the Laurel Creek and Cades Cove valleys, while Hannah Mountain likely slows down or blocks any winds from the southwest (the predominant wind direction in the area). The strong northeasterly winds observed on July 5th likely flowed unimpeded into the northeast-to-southwest oriented valleys of the southwestern portion of the Park (and possibly even accelerated in the valleys due to constricted flow).
1. INTRODUCTION
- Two recent significant events around the Great Smoky Mountains National Park (hereafter referred to as GSMNP; Figure 1) provided some clues about the influence of terrain on the evolution of strong convection and their resulting damaging winds. During the Super Tornado Outbreak on 27-28 April 2011, several long-lived supercells produced long-tracked tornadoes over Mississippi and Alabama, but these tornado tracks became more fragmented around the complex terrain of east Tennessee (Figure 2). This Super Tornado Outbreak provided an excellent and rare opportunity to observe numerous tornadic supercells closely interacting with complex terrain.
- Another significant convective event occurred around the GSMNP on 5 July 2012, when a derecho moved southwestward across the Great Tennessee Valley. The resulting significant tree damage within the GMSNP was greatly influenced by the orientation of the complex terrain and the unusual direction of the convective winds. In fact, the largest known forest blowdown ever recorded in the Rocky Mountains was the result of strong winds from an unusual direction (Meyers et al. 2003). The significant blowdown of trees during the 5 July 2012 event killed two people and injured seven within the GSMNP. This study will examine the influence of the complex terrain around the GSMNP on the evolution of the significant convection and their resulting damaging winds during the events of 27-28 April 2011 and 5 July 2012.
2. SUPER TORNADO OUTBREAK ON 27-28 APRIL 2011
- The Super Tornado Outbreak of 27-28 April 2011 produced numerous tornadoes over the southern Appalachian region (Figure 3), many of which appeared to have initiated around the openings of the numerous southeast-to-northwest oriented valleys located within the southern Appalachian Mountains (Figure 4). The first documented violent (EF4) tornado to affect the GSMNP started near Chilhowee Lake, which coincided with the opening of the southeast-to-northwest oriented Little Tennessee River Valley. On the evening of 27 April 2011, a strong low pressure system was moving northeastward across the Ohio River Valley (Figure 5), with its associated trailing cold front moving across the Tennessee River Valley. The environment over east Tennessee was very conducive to the formation of tornadoes, as evidenced by the large helicity values and moderate instability observed in the central Great Tennessee Valley (Figure 6). Since surface observations are very limited in the Great Tennessee Valley, the NAM12 model’s surface winds (Figure 7) confirmed the existence of a strong southeasterly wind flow in the boundary layer on the evening of 27 April 2011. With many of the river valleys in the southern Appalachian region oriented from southeast to northwest, these southeasterly winds likely accelerated through these valleys due to constricted flow (Figure 8) and may have encouraged tornadogenesis within the supercells with pre-existing mid-level vorticity that were moving northeastward up the Great Tennessee Valley. Previous studies of tornadoes in complex terrain (Seimon and Bosart 2004; Bosart et al. 2006; Schneider 2009) have examined the influence of terrain in modifying the low-level inflow into supercells so that helicity increased enough to ultimately enhance tornadogenesis.
- The lack of surface observations near the valley openings along the southern Appalachian Mountains prevented any direct confirmation of stronger winds in the areas of tornado initiation, but fortunately, several of the tornadic supercells that moved closely along the foothills of the southern Appalachian Mountains also moved within 30 nm (55.6 km) of the Doppler radar site at Morristown, Tennessee (KMRX). Thus, the Doppler radar’s wind velocity estimates can reasonably be expected to verify any acceleration of southeasterly winds near the valley openings within the southern Appalachian Mountains.
- Velocity estimates from KMRX (Figure 9) revealed inbound wind velocities (green colors in the imagery, which are winds from the southeast in this event) persisting around 60 kt (31 m s-1) for at least an hour between 0025 and 0124 UTC near the Pigeon River Valley opening in southwestern Cocke county. At this location, the radar beam was around 3,100 ft (945 m) MSL at a distance of approximately 25 nm (46.3 km) from KMRX. Thus, the radar beam was still at a good elevation to detect the boundary-layer wind velocities that could have been the result of channeling through the river valleys in the southern Appalachian Mountains (the mountains are up to 4,000 to 5,000 ft (1,219 to 1,524 m) MSL in elevation around this area). When a supercell later in the evening moved northeastward up along (or parallel to) the southern Appalachian Mountain range, inbound wind velocities increased and decreased according to the supercell’s proximity to a valley or mountain. At 0215 UTC, this supercell was moving close to Webb Mountain, which decreased the inbound wind velocities (Figure 10) flowing into the storm to between 35 and 40 kt (18 and 21 m s-1). The inbound wind velocities into the storm then quickly increased at 0224 UTC to between 50 and 55 kt (26 and 28 m s-1), as this supercell moved farther northeastward in front of the Pigeon River Valley. An EF0 tornado was reported at 0230 UTC near Hartford in the opening of the Pigeon River Valley.
- A similar scenario unfolded a short time later, as this supercell moved further northeastward up along the foothills of the southern Appalachians. KMRX velocity images at 0233 UTC (Figure 11) revealed decreasing inbound wind velocities to between 40 and 45 kt (21 and 23 m s-1), as it moved in front of Snowbird Mountain. Inbound wind velocities quickly increased at 0238 UTC to between 45 and 50 kt (23 and 26 m s-1), as the storm moved in front of the French Broad River Valley. An EF1 tornado was reported at 0237 UTC near Del Rio in the opening of the French Broad River Valley. At 0247 UTC, this supercell moved in front of Paint Mountain with a decrease in the inbound velocities to between 40 and 45 kt (21 and 23 m s-1), but inbound velocities increased significantly at 0251 UTC to between 70 and 75 kt (36 and 39 m s-1) when the storm moved in front of the Little Laurel Creek Valley (Figure 12). An EF3 tornado was reported near Camp Creek at 0251 UTC.
3. DERECHO ON 5 JULY 2012
- A significant blowdown of trees occurred in the GSMNP on 5 July 2012, as a derecho (Johns and Hirt 1987) moved from the mid-Atlantic region southwestward across the Great Tennessee Valley (Figure 13). The early part of July 2012 was unusually hot across east Tennessee with all-time record temperatures recorded on June 30th and July 1st at many observation sites. These hot conditions were mainly the result of a large upper-level high that was lingering over the center of the nation (Figure 14). By 1800 UTC on July 5th, these unusually hot conditions had contributed to the intensification of a mesoscale convective system (MCS) over West Virginia (Figure 15), which moved southward along the eastern periphery of the upper-level high towards the southern Appalachian region in the northerly 500 hPa flow. As this MCS approached the southern Appalachian region by mid to late afternoon, it began to move southwestward down the northeast-to-southwest oriented Great Tennessee Valley. The KMRX radar was estimating strong wind speeds ahead of these storms between 60 and 65 knots (31 and 33 m s-1) around 5,000 ft (1,524 m) MSL (Figures 16 and 17). While the entire momentum of these winds may not have completely descended down to the surface, the Knoxville McGhee Tyson airport (KTYS) reported winds in excess of 50 kt (25.7 m s-1) and several observation sites in the GSMNP (Figure 18) reported winds in excess of 60 mph (26.8 m s-1). Most of the extensive tree damage in the GSMNP occurred near Laurel Creek (Figure 19) and Cades Cove, and it appeared that straight-line winds were the cause of the blowdown with pockets of damage found mainly in areas that had a good open view to the northeasterly direction.
- The strong convective winds on July 5th were coming from the northeast direction down the Great Tennessee Valley, which was an unusual direction to observe strong winds in east Tennessee. Around the western side (Tennessee side) of the GSMNP, there are no mountain barriers to slow down northeasterly winds (Figure 20). The long range of Chilhowee Mountain usually slows down any strong westerly winds from reaching the Laurel Creek Valley and Cades Cove, while Hannah Mountain likely slows down any winds from the southwest (the predominant wind direction around the GSMNP). The strong northeasterly winds observed on July 5th likely flowed unimpeded into the northeast-to-southwest oriented valleys in the southwestern portion of the GSMNP, and possibly even accelerated in these valleys due to constricted flow. Most of the trees that fell in the Laurel Creek and Cades Cove valleys were in the mid-slope region of the hillsides, with trees at the top of the hill remaining mostly intact. These trees may have fallen as a result of the steeper slopes in the mid-slope hillsides, but the fact that the convective winds came from an unusual direction could have also caused a lot of these trees to fall. It's possible that the tree roots are strongest in the direction of the prevailing winds (from the southwest direction in the southern Appalachian region), so these trees could have been more vulnerable to a blowdown created by strong northeasterly winds.
4. SUMMARY
- During the Super Tornado Outbreak of 27-28 April 2011, several tornado tracks appeared to initiate near the openings of the many southeast-to-northwest oriented valleys located along the Appalachian Mountain range, where the synoptic-scale southeasterly wind flow may have been accelerated through the valleys due to constricted flow. Admittedly, observational evidence alone can’t completely validate the idea that these gap winds initiated tornadogenesis in the numerous supercells that moved parallel to the southern Appalachian mountain range, but future research with high-resolution models should be conducted to determine the exact influence of these mountains on 27-28 April 2011. These models should first be able to reconstruct the exact tracks of the supercells and their resulting tornadoes that occurred across east Tennessee on 27-28 April 2011. Then, the mountains should be removed from the model’s domain to determine the exact influence of the terrain on the development of the tornadoes during this event.
- On 5 July 2012, a derecho moved southwestward across the Great Tennessee Valley and produced strong northeasterly winds (an unusual direction to observe high winds in the southern Appalachian region) and a significant amount of tree damage near Cades Cove (according to GSMNP personnel). The unusual northeasterly winds that day had an unobstructed path into Laurel Creek Valley (where most of the tree damage was observed), and possibly even accelerated through the valley due to constricted flow. The significance of the blowdown of trees that day was also possibly attributed to the unusual direction of these severe winds (from the northeast), since the root system of these trees was likely strongest on the side of the prevailing wind direction (from the southwest).
5. ACKNOWLEDGMENTS
- The author would like to thank Jim Renfro at the Great Smoky Mountains National Park (GSMNP) for the 5 July 2012 wind data from three of the GSMNP observation sites, and to Amanda Pierce Hackworth at GSMNP for the pictures of significant tree damage along Laurel Creek road on 5 July 2012. Also, thanks to Shawn O’Neill (senior forecaster at WFO Morristown) for finding the colorized topography map of the GSMNP.
6. REFERENCES
- Bosart, L. F., Seimon, A., LaPenta, K. D., and M. J. Dickinson, 2006: Supercell tornadogenesis over complex terrain: The Great Barrington, Massachusetts, tornado on 29 May 1995. Wea. Forecasting, 21, 897-922.
- Johns, R. H., and W. D. Hirt, 1987: Derechos: Widespread convectively induced windstorms. Wea. Forecasting, 2, 32-49.
- Meyers, M. P., Snook, J. S., Wesley, D. A., and G. S. Poulos, 2003: A Rocky Mountain storm. Part II: The forest blowdown over the west slope of the northern Colorado Mountains - observations, analysis, and modeling. Wea. Forecasting, 18, 662-674.
- National Oceanic and Atmospheric Administration (NOAA), 2011: The Historic Tornadoes of April 2011 Service Assessment, 43 pp.
- Schneider, D. G., 2009: The impact of terrain on three cases of tornadogenesis in the Great Tennessee Valley. Electronic J. Operational Meteor., 10 (11), 1-33.
- Seimon, A., and L. F. Bosart, 2004: An observationally based hypothesis for significant tornadogenesis in mountain environments. Preprints, 22nd Conf. on Severe Local Storms, Hyannis, MA, Amer. Meteor. Soc., 3.2.
Figure 1. Location of southern Appalachian region (shaded area) in relation to the United States (top) with relief map of the southern Appalachian region (bottom) [bold lines denote state boundaries with state names in bold capital letters; regular lines denote county boundaries with county names in small text; large text denotes geographic features].
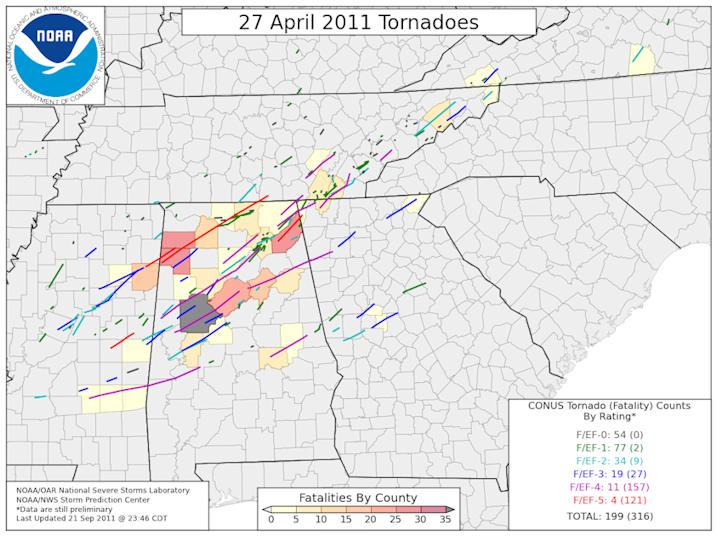
Figure 2. Tornado tracks from the 27 April 2011 Super Outbreak (from NOAA 2011) showing how tracks from the long-lived supercells became more fragmented over east Tennessee (bold lines denote state boundaries; regular lines denote county boundaries).
Figure 3. Tornado tracks and intensities across the southern Appalachian region during the Super Tornado Outbreak on 27-28 April 2011 (bold lines denote state boundaries; regular lines denote county boundaries with the county names included).
Figure 4. Topographical features of the southern Appalachian region, along with the names of the numerous southeast-to-northwest oriented river valleys within the southern Appalachian mountains (bold lines denote state boundaries).
Figure 5. Isobar/frontal analysis and infrared satellite imagery on 28 April 2011 at 0000 UTC.
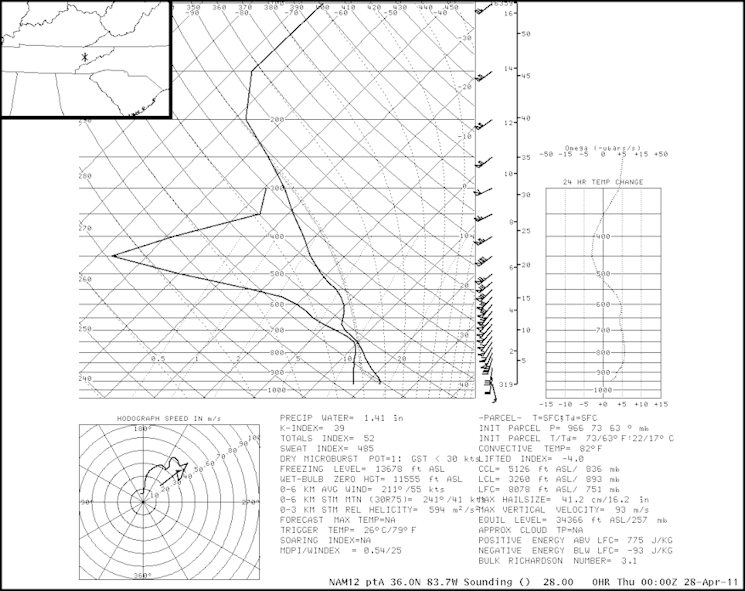
Figure 6. Sounding from the NAM12 model over central east Tennessee (exact location shown in upper left corner) at 0000 UTC on 28 April 2011 (wind barbs in kt; 1kt = 0.5144 m s-1).
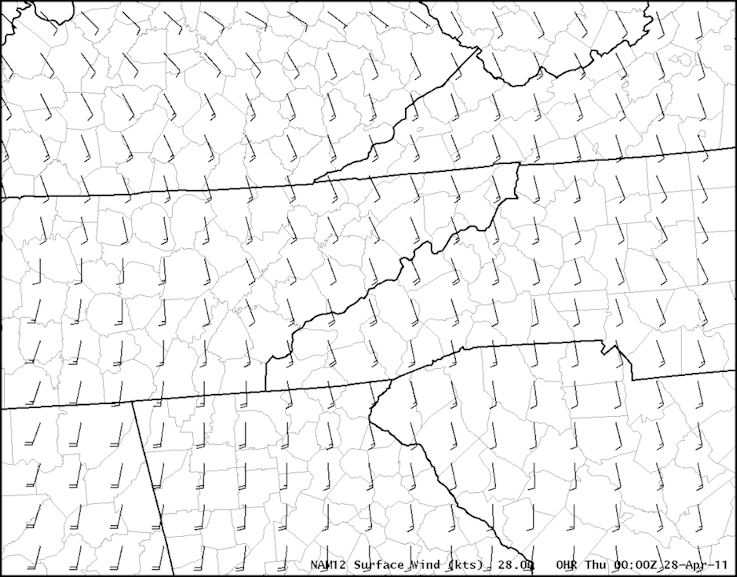
Figure 7. Surface winds (wind barbs in kt; 1kt = 0.5144 m s-1) from the NAM12 model at 0000 UTC on 28 April 2011 (bold lines denote state boundaries; regular lines denote county boundaries).
Figure 8. Same as Fig. 3, but with red arrows drawn to show the probable paths of stronger southeasterly winds that were likely channeled and accelerated through the numerous southeast-to-northwest oriented valleys.
Figure 9. KMRX velocity images (color scale in kt; 1kt = 0.5144 m s-1) on 28 April 2011 at 0025 UTC (top) and 0124 UTC (bottom) [bold lines denote state boundaries; regular lines denote county boundaries with county names included; arrows point to the inbound velocities of interest].
Figure 10. KMRX velocity images (color scale in kt; 1kt = 0.5144 m s-1) on 28 April 2011 at 0215 UTC (top) and 0224 UTC (bottom) [bold lines denote state boundaries; regular lines denote county boundaries with town locations and names included; arrows point to the inbound velocities of interest].
Figure 11. Same as Fig. 10, but at 0233 UTC (top) and 0238 UTC (bottom).
Figure 12. Same as Fig. 10, but at 0247 UTC (top) and 0251 UTC (bottom).
Figure 13. Storm reports received at the Storm Prediction Center (SPC) from the 5 July 2012 derecho event.
Figure 14. 500 hPa heights (solid lines in decameters), temperatures (dashed lines; in 0C), and winds (wind barbs in kt; 1kt = 0.5144 m s-1) on 5 July 2012 at 1200 UTC.
Figure 15. Isobar/frontal analysis and infrared satellite imagery on 5 July 2012 at 1800 UTC.
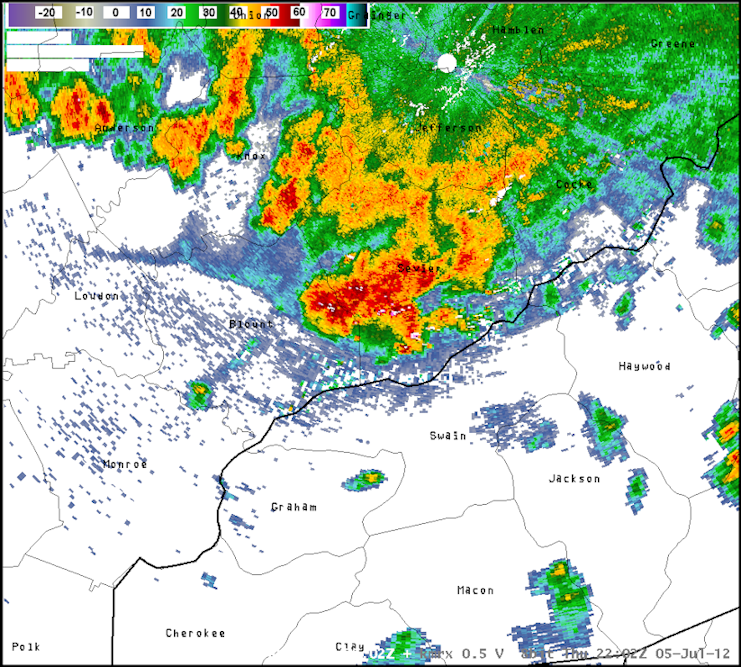
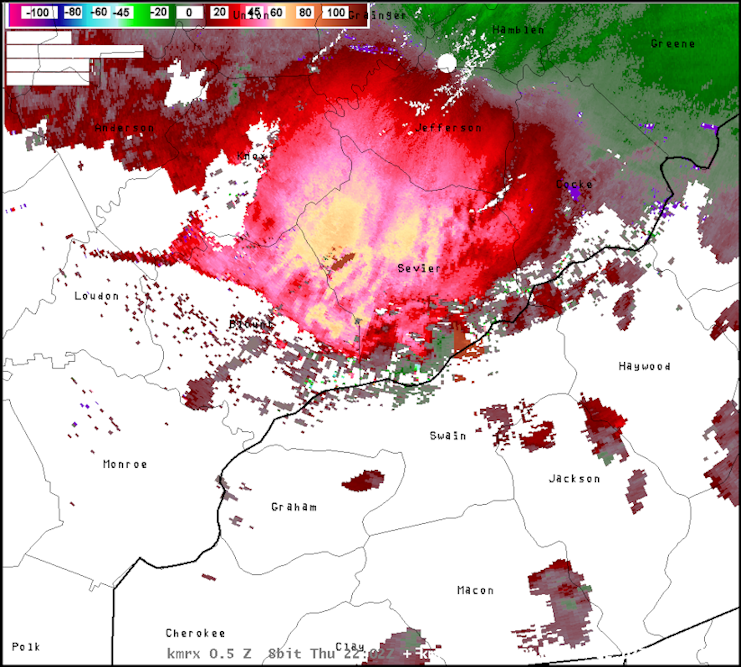
Figure 16. KMRX reflectivity image (top; color scale in dBz) and velocity image (bottom; color scale in kt; 1kt = 0.5144 m s-1) on 5 July 2012 at 2202 UTC (bold lines denote state boundaries; regular lines denote county boundaries with county names included).
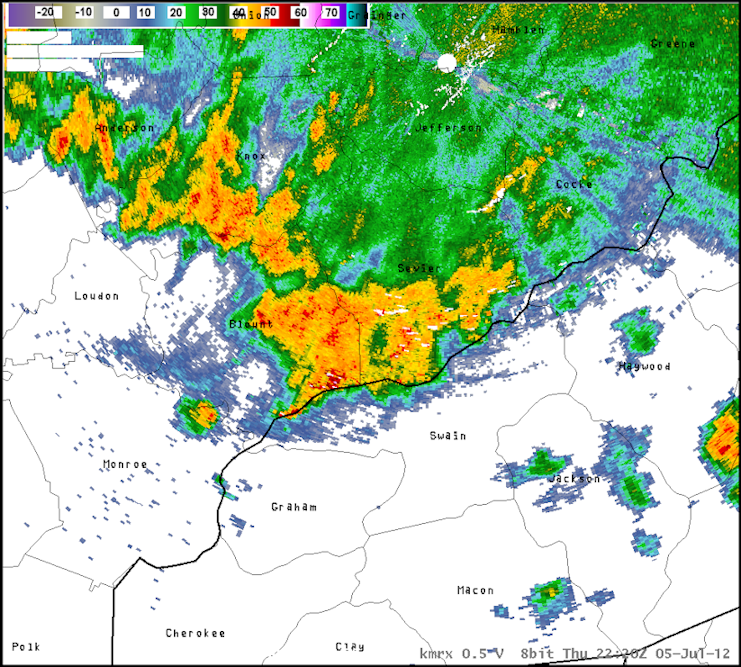
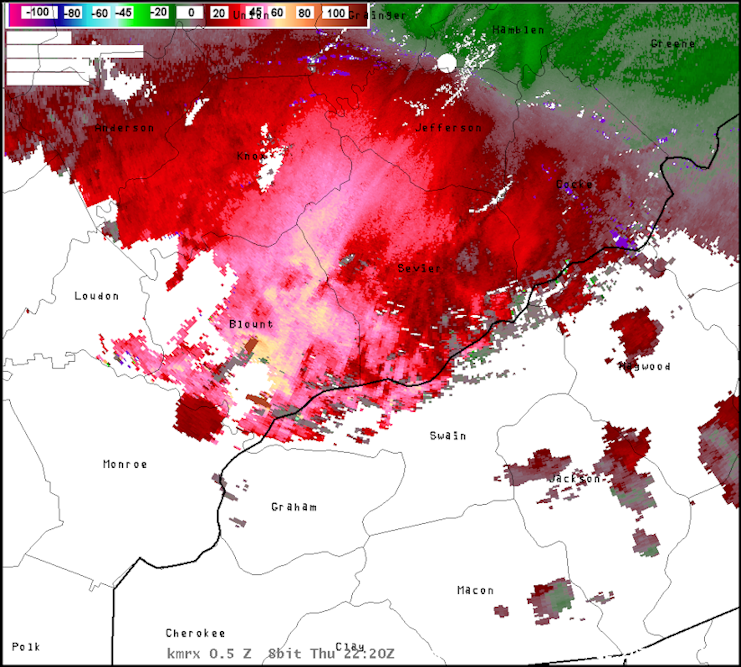
Figure 17. Same as Fig. 16, but at 2220 UTC.
Figure 18. Peak wind gusts (in miles per hour; 1 mph = 0.44704 m s-1) measured in the Great Smoky Mountains National Park on the afternoon of 5 July 2012 between 1300 and 1900 EST (1800 and 2400 UTC).
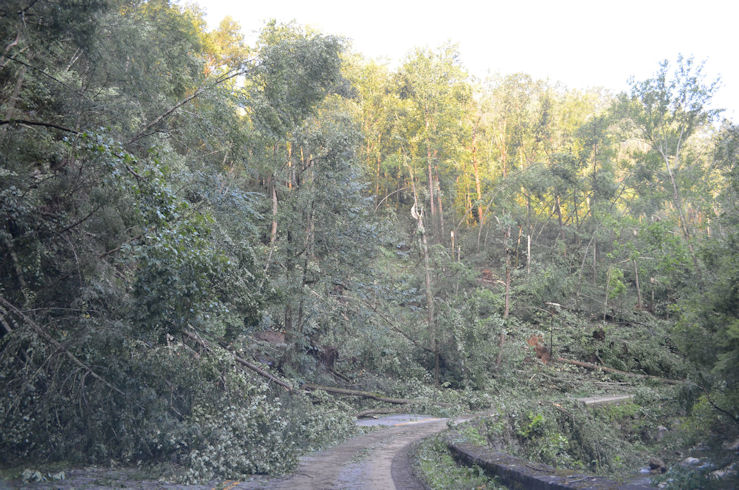
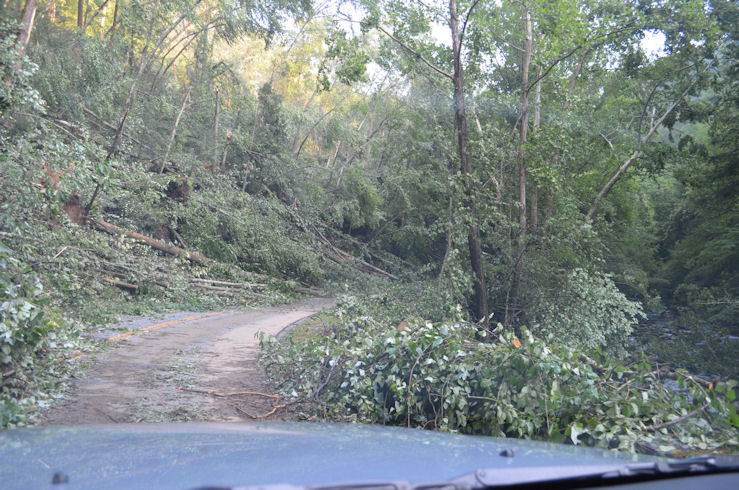
Figure 19. The extensive tree damage observed along Laurel Creek Road in the Great Smoky Mountains National Park on 5 July 2012.
Figure 20. Locations of geographical features on the Tennessee side of the Great Smoky Mountains National Park (top) and a smoothed elevation map (contours in meters; bold line denotes Park border) of the Great Smoky Mountains National Park with the locations of five wind observation sites (bottom).


 Local Radar
 Huntsville Radar
 Regional Satellite
 Graphical Forecast
 Weather Map
 Daily Graphics
 Follow us on YouTube