Morristown, TN
Weather Forecast Office
Note: The following monthly climatological data is not considered official. For copies of official data, contact the National Climatic Data Center.
| Daily and Monthly Climate Normals and Records ('Normals' are thirty year averages based on the period 1991-2020) |
|||||||||||
| Jan | Feb | Mar | Apr | May | Jun | Jul | Aug | Sep | Oct | Nov | Dec |
| Warmest/Coldest Monthly Average Temperatures | ||||||||||||
|---|---|---|---|---|---|---|---|---|---|---|---|---|
| JAN | FEB | MAR | APR | MAY | JUN | JUL | AUG | SEP | OCT | NOV | DEC | |
| Warmest | 47.1 | 50.4 | 60.6 | 65.6 | 74.4 | 80.3 | 82.2 | 83.6 | 78.8 | 66.2 | 55.4 | 52.8 |
| 1974 | 2023 | 2012 | 2017 | 2018 | 1952 | 2016 | 2007 | 2019 | 2016 | 2024 | 2015 | |
| Coldest | 24.7 | 31.0 | 36.0 | 51.0 | 60.5 | 67.7 | 72.1 | 72.3 | 64.1 | 51.7 | 39.7 | 30.4 |
| 1977 | 1978 | 1960 | 1950 | 1976 | 1974 | 1967 | 1950 | 1949 | 1988 | 1976 | 1963 | |
| Wettest/Driest Monthly Precipitation Totals | ||||||||||||
|---|---|---|---|---|---|---|---|---|---|---|---|---|
| JAN | FEB | MAR | APR | MAY | JUN | JUL | AUG | SEP | OCT | NOV | DEC | |
| Wettest | 13.27 | 15.62 | 12.24 | 14.03 | 10.70 | 11.14 | 19.27 | 10.46 | 10.14 | 8.02 | 12.22 | 12.64 |
| 1954 | 2019 | 1975 | 1998 | 1984 | 1989 | 1967 | 1960 | 2011 | 2019 | 1948 | 1990 | |
| Driest | 0.93 | 0.84 | 2.13 | 0.88 | 0.80 | 0.53 | 1.23 | 0.54 | 0.13 | 0.00 | 1.06 | 0.67 |
| 1981 | 1968 | 1957 | 1976 | 1970 | 1988 | 1995 | 1953 | 2019 | 1963 | 2021 | 1965 | |
For additional information via a searchable database:
US Dept of Commerce
National Oceanic and Atmospheric Administration
National Weather Service
Morristown, TN
5974 Commerce Blvd.
Morristown, TN 37814
(423) 586-3771
Comments? Questions? Please Contact Us.


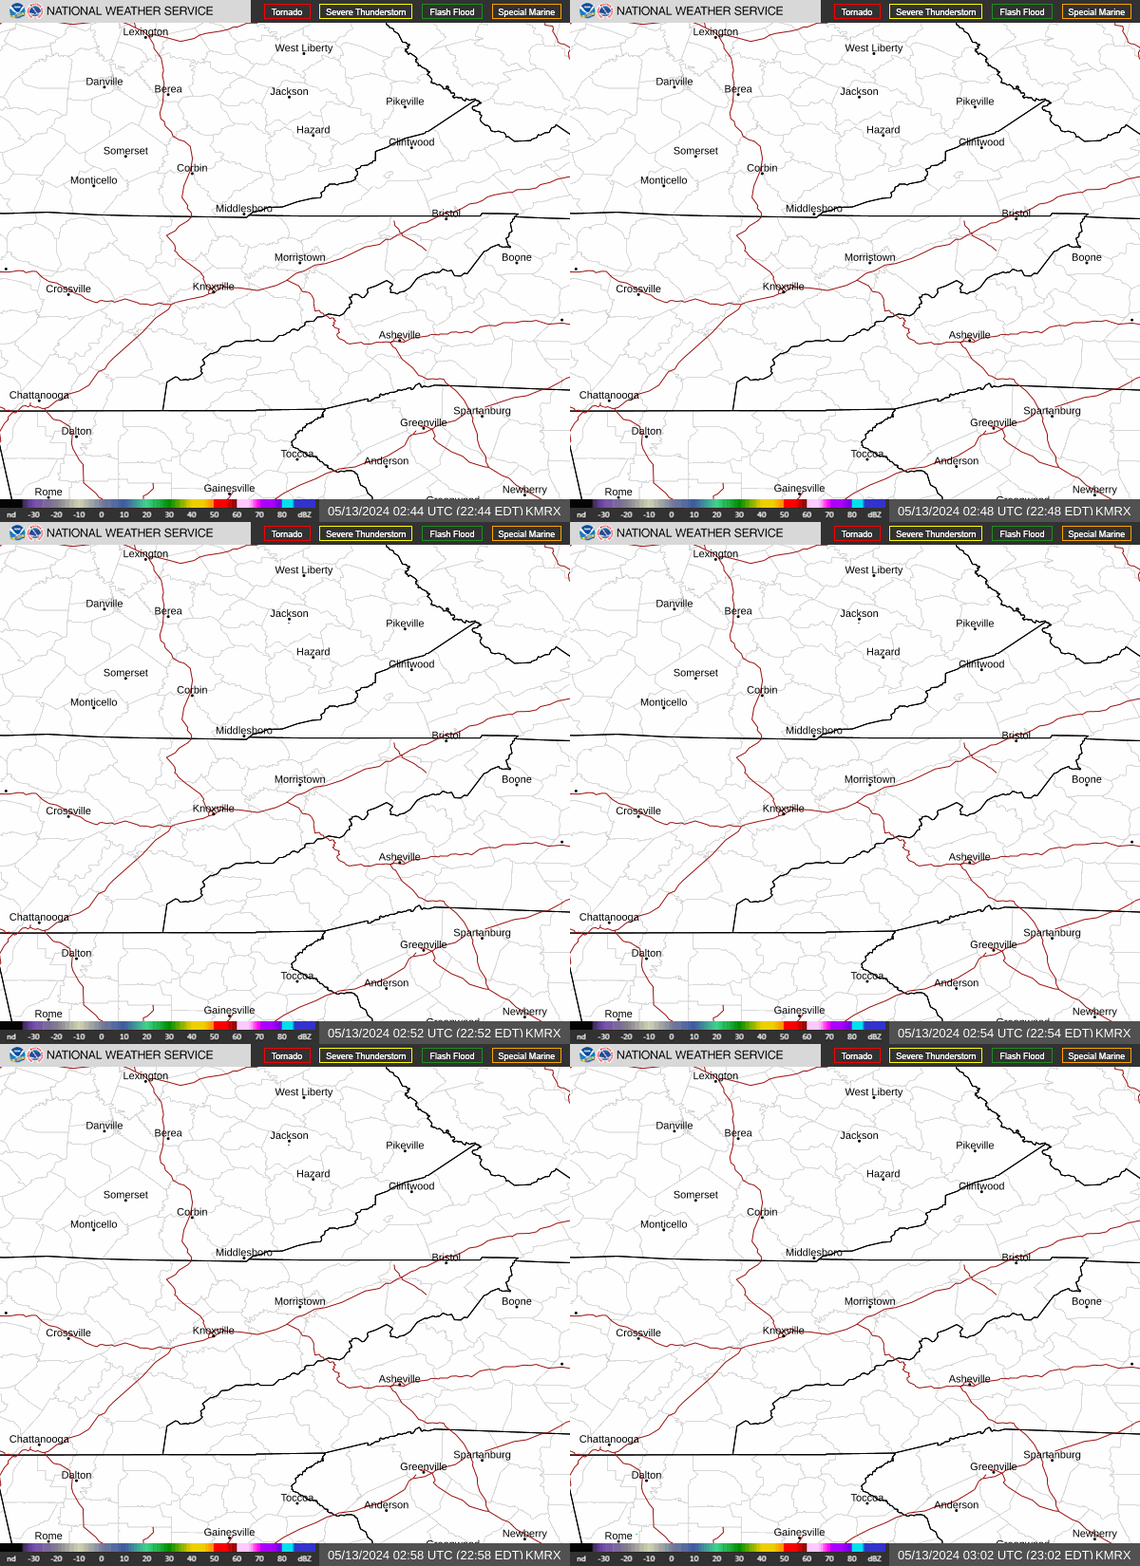 Local Radar
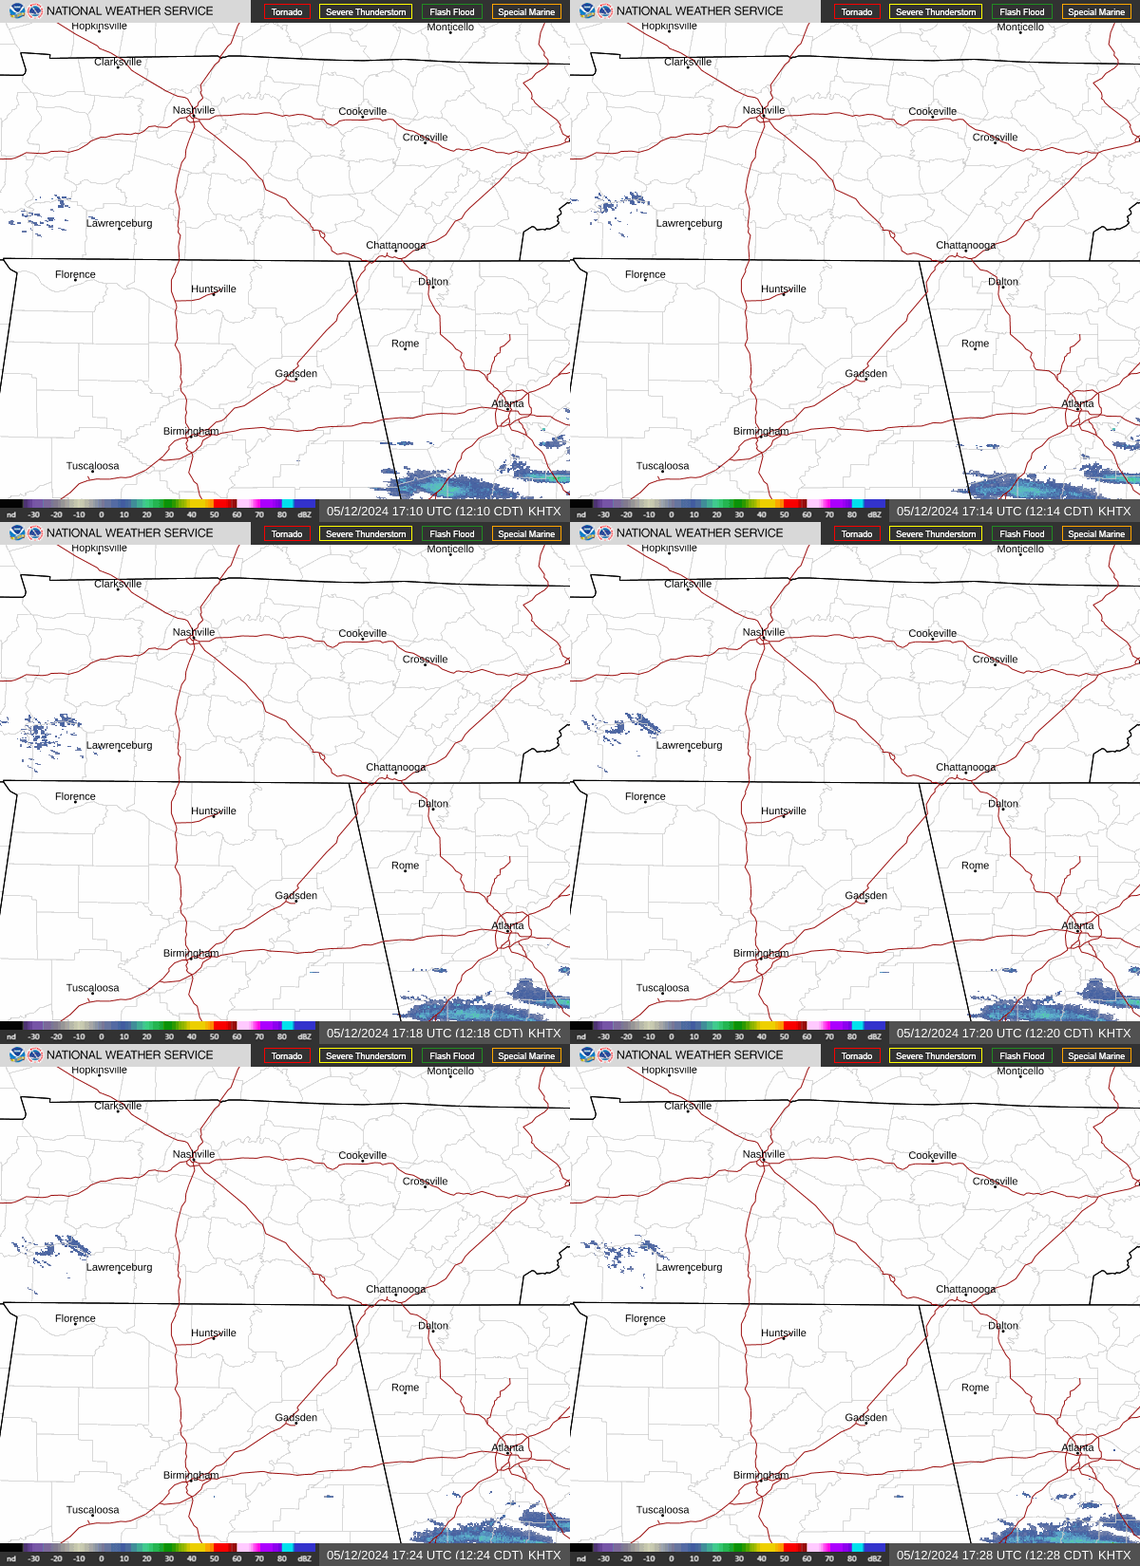 Huntsville Radar
 Regional Satellite
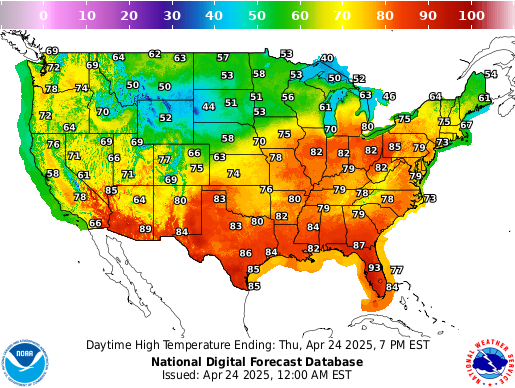 Graphical Forecast
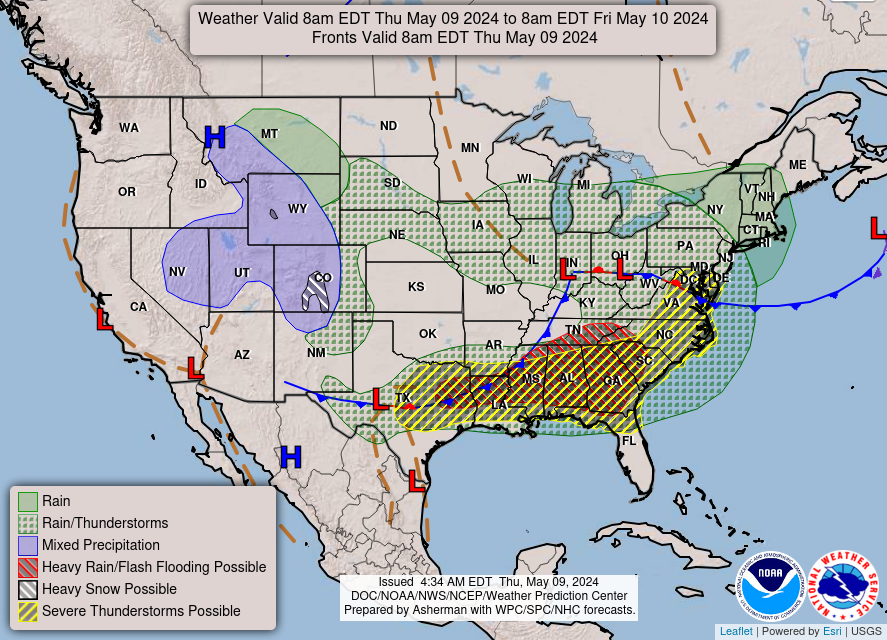 Weather Map
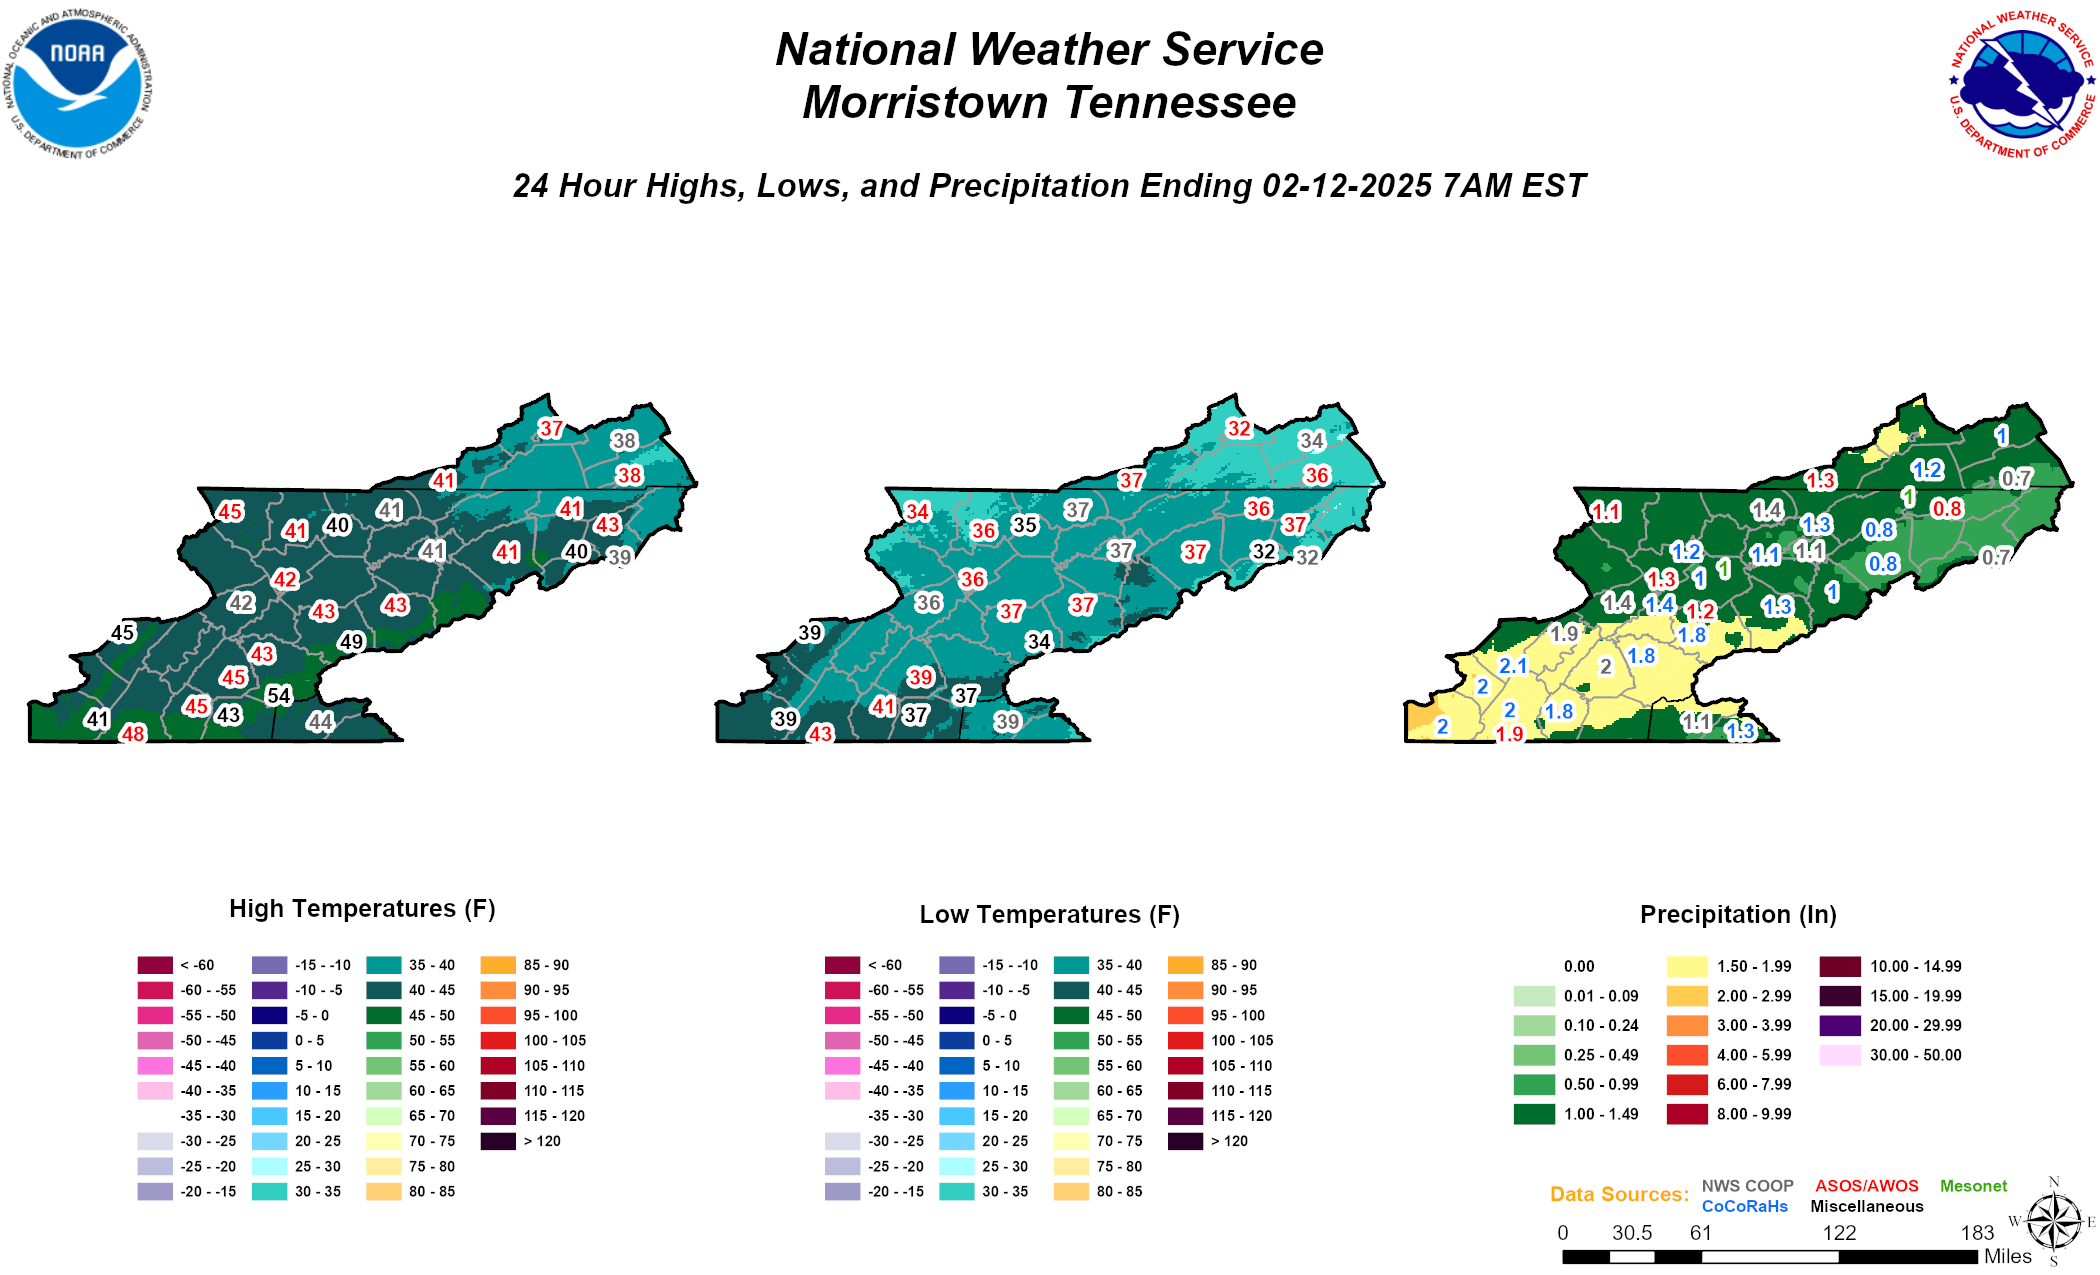 Daily Graphics