Major Tornado Outbreak in East Tennessee
May 18, 1995
by
Michael Buchanan, Terry Getz, and David Hotz
1. Introduction
- On May 18, 1995, the atmosphere over Tennessee was primed for an outbreak of tornadic supercell thunderstorms. Two primary supercells which originated in southwest and middle Tennessee tracked eastward through the state, reaching the county warning area (Fig. 1) of NWSO Knoxville/Tri-Cities by late afternoon. The utilization of the NWSO Knoxville/Tri-Cities WSR-88D radar (KMRX) during this tornadic outbreak will be examined in depth.
2. Synoptic Conditions
- Although observed regional upper air plots were not available for this particular tornadic supercell event, initialized meteorological fields from PCGRIDDS were available from both the ETA and NGM models. Although smoothed from observed data, these initialized fields valid at the synoptic times of 0000 and 1200 UTC were assumed to be close to the observed fields at the same valid time.
- Prior to the onset of severe convection at 1100 UTC on May 18 1995, a surface plot (not shown) depicted a 998 millibar low located in southwest Missouri. An associated warm front extended east from the low through sections of Illinois, Indiana, Ohio and Pennsylvania. A trailing cold front stretched southward from the low through extreme southeast Oklahoma, northeast Texas and south-central Texas. Later that evening at 0000 UTC the surface low had weakened slightly to 1000 millibars and had moved to a position close to Evansville, IN. The cold front had moved very close to the Mississippi River. Therefore for the entire day on May 18, east Tennessee remained well within the warm sector of the surface low pressure system.
- Conditions at 0000 UTC will now be examined in more depth, since most of the severe convection formed very close to this time. A low level jet (LLJ) at 850 millibars averaged around 45 knots across east Tennessee. This LLJ had been strengthening throughout the day and even continued strengthening beyond the 0000 UTC hour. As a result, there was weak warm air advection (WAA) and a low level moisture increase over east Tennessee. This was reflected at the surface by dewpoints rising into the middle to upper 60s and temperatures rising into the upper 70s to lower 80s. The effects of the LLJ combined with daytime heating to destabilize the atmosphere over east Tennessee.
- In the middle and upper levels of the atmosphere at 0000 UTC, conditions were also very favorable for upward vertical motion. At 500 millibars, a positively tilted full latitude trough extended from southeast Wisconsin to east Texas. A negatively tilted shortwave trough axis extended from south-central Kentucky through southeast Tennessee into eastern Georgia. This resulted in positive vorticity advection (PVA) across all of east Tennessee. In actuality, PVA had been increasing all day as both the short wave and long wave trough axes moved closer to east Tennessee. The right entrance region of a 110 knot jet streak at 300 millibars was located across east Tennessee during the afternoon and evening hours on May 18. As a result strong upper level divergence was also present.
3. Environmental Conditions
- The warm sector of the surface low provided moderately unstable air over east Tennessee. Surface based lifted indices as computed by the AFOS Data Analysis Programs (Bothwell, 1988) during this event averaged around -6. A similar lifted index was obtained from PCGRIDDS from both the ETA and NGM models valid at 0000 UTC. The air across east Tennessee remained essentially undisturbed since no convection occurred prior to the tornadic supercells.
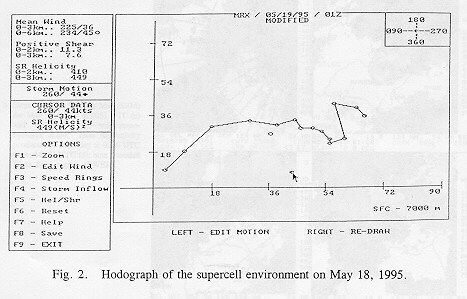
- A representative hodograph (Fig. 2) of the tornadic supercell environment was constructed using the KMRX WSR-88D Velocity Azimuth Display Wind Profile (VWP) in a SHARP (Hart, 1991) environment. The wind data used for this hodograph were from approximately the same time that one of the tornadic supercells passed within one mile from the KMRX radar. A mean storm motion of 260 degrees at 44 knots was determined by analyzing the WSR-88D storm track product (STI) from numerous volume scans. This storm motion fit the profile for a supercell very well since it was very close to 20 degrees to the right of and 75 percent of the mean wind. The hodograph curvature also fit the profile for a supercell. Consequently, the rotational potential in the form of storm-relative helicity was certainly favorable for tornadic development.
- Often it is desirable to look at the combined effects from both instability and storm-relative helicity. The energy-helicity index (EHI) combines these two into a dimensionless index which describes in a simplistic manner the optimal combination of the two values (Davies, 1993). The EHI for east Tennessee for this event averaged around 4.5. In Davies (1993), EHI values over 4 along with sufficient mid level winds and storm-relative inflow suggest that violent tornadoes are possible. Of course over the past few years, authors such as Davies-Jones et. al. (1990) and Johns et. al. (1993) have shown that storm-relative helicities over 400 m2/s2 along with adequate instability can enhance the potential significantly for strong and even violent tornadoes. The strongest tornado to affect east Tennessee on the evening of May 18, 1995 was rated an F3 on the Fujita scale. Although this was not a violent tornado, it was close enough to give validity to environmental parameters such as EHI and storm-relative helicity.
4. First Supercell Track: Cumberland County to Hamblen County
- The first tornadic supercell to affect east Tennessee on May 18 had its origin as far back as southwest Tennessee, some several hundred miles away. It was first tracked by the KMRX Storm Track (STI) product near Columbia TN, approximately 183 nautical miles (nm) away. The track of this supercell cut through the heart of the county warning area (CWA) of the NWSO Knoxville/Tri-Cities TN office (Fig. 1).
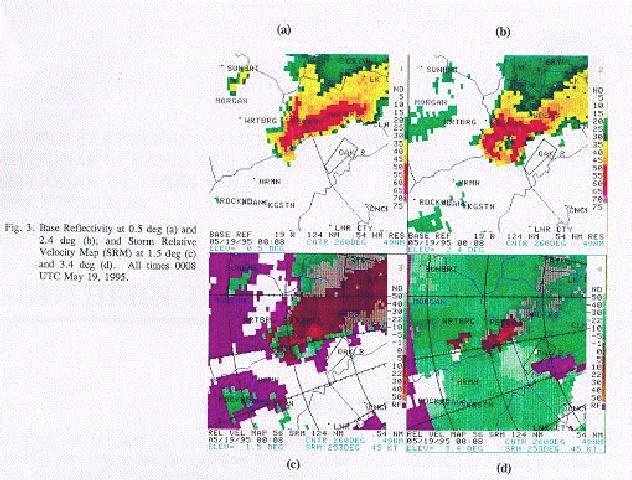
- At approximately 2307 UTC (707 PM EDT) on May 18, the storm had moved into western Cumberland county which is the westernmost county in the CWA. A moderate mesocyclone in the mid levels of the storm along with a well-defined V-notch and weak echo region (WER) were already being detected. Five minutes later, the mesocyclone was identified as strong since rotational velocities exceeded 40 knots at a range of more than 80 nm from the KMRX WSR-88D radar. At this time the supercell was approximately 5 nm west of Crossville, TN (CSV) in central Cumberland county. This time also marked the very first time that a low level appendage was observed by the KMRX radar. However it is believed that the low level appendage was present well before it tracked into Cumberland county since this supercell had a history of producing tornadoes earlier in middle TN. As the supercell moved through the city of Crossville between 2317 and 2322 UTC, an F3 tornado accompanied it. Approximately 30 minutes prior to this time, a tornado warning was issued for Cumberland county. The storm damaged or destroyed over 30 homes and injured 20 people. The mesocyclone strengthened but still remained a strong mesocyclone. Its vertical depth increased from 10k feet to 16k feet. A marked increase was also noted in the echo tops and VIL values as they increased to 51k feet MSL and 72 kg/m2, respectively.
- After the tornadic supercell had moved through Crossville, its radar reflectivity characteristics began resembling a classic supercell. Approximately 3 nm east of Crossville, the presence of a hook echo was first detected. Earlier when the supercell was moving through Crossville its WER became bounded. Thus by 2327 UTC the storm had all of the radar characteristics of a classic supercell such as a hook echo, BWER and V-notch. A deep, strong and persistent mesocyclone was also present. These radar characteristics as depicted by Figs. 3a-d became even more well-defined as the supercell tracked through the remainder of Cumberland county and also the counties of Morgan and Anderson. Tornado warnings were also issued for Morgan and Anderson counties with lead times between 15 and 20 minutes. This particular track lasted about one hour. During this time, rotational velocities averaged between 45 and 50 knots while the average vertical depth of the strong mesocyclone was 15k feet. However, some fluctuations in the mesocyclone depth did exist during this period. This may have been one of the reasons why the tornadic damage was cyclical. Numerous reports of golfball to softball size hail also accompanied the supercell. The corresponding VIL values ranged from the middle 60s to middle 70s.
- The supercell entered Knox county from Anderson county around 0030 UTC and moved across mainly the northern sections of the county before exiting the northeast corner of the county around 0100 UTC. The classic hook echo signature, that had been so notable in Anderson county, was noted on the 0.50 degree slice base reflectivity product. The 0028 UTC Storm Relative Velocity Map product (SRM) at 1.50 degrees showed 50 knots of rotational velocity about 4 nm southeast of the city of Clinton in extreme eastern Anderson county. This rotation was occurring roughly around 7800 feet MSL and met the criteria to be identified as a strong mesocyclone. Based on past history and this strong rotation, a tornado warning was issued for northern Knox county at 0029 UTC. The 0040 UTC SRM product at the 1.50 degree slice showed 45 knots of rotational velocity about 8 nm north of Knoxville at roughly 6200 feet MSL. No reports of funnel clouds or tornado sightings were relayed to NWSO Knoxville/Tri-Cities, but hail of 1.75 inches in diameter was reported in northern Knox county at 0030 UTC. The Vertically Integrated Liquid (VIL) products indicated values as high as 70 kg/m2 and the Layer Reflectivity Maximum (LRM) products for the layer from 24k feet to 33k feet reached as high as 75 dBZ, as the storm moved through northern Knox county.
- The next counties to be affected were Grainger and Jefferson, with the storm entering the southern part of Grainger county around 0045 UTC and the extreme northern part of Jefferson county around 0106 UTC. The storm was moving inside a 20 nm radius of the KMRX radar, and a switch to VCP 11 had been done well before the storm entered Knox county, which is roughly 20 to 40 nm west of NWSO Knoxville/Tri-Cities. As the storm moved into Grainger and Jefferson counties, the radar operator had to analyze higher slices of reflectivity and velocity to examine the storm at the proper levels. At NWSO Knoxville/Tri-Cities routine product lists and predefined user functions have been created for usage when storms move within 30 nm of the KMRX radar. These product lists and user functions have reflectivity and SRM products for 6.00, 10.00, and 14.00 degree elevation angles.
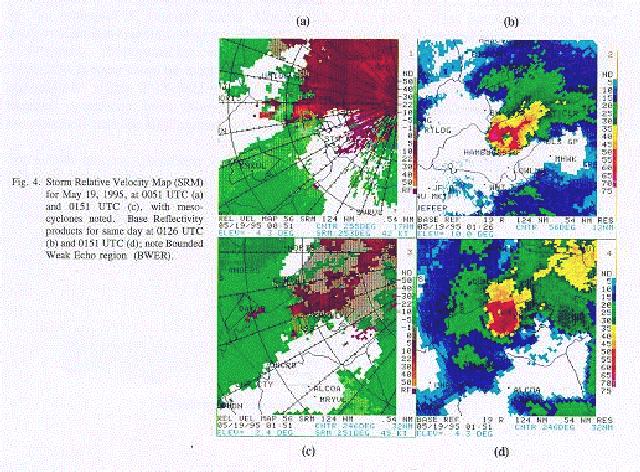
- As the storm entered Grainger county, the 0051 UTC SRM product at the 4.30 degree slice (Fig. 4a) showed a strong mesocyclone with 55 knots of rotational velocity about 17 nm west of the KMRX radar at 9500 feet MSL. Again based on past history and continued detection of a strong mesocyclone, tornado warnings were issued for Grainger county and also southern Union county at 0052 UTC. However, the storm continued on an almost due east track and no severe weather was observed in Union county with this storm. At 0107 UTC, tornado warnings were issued for Jefferson and Hamblen counties, as radar continued to show up to 55 knots of rotational velocity about 10 nm west of the KMRX radar along the Grainger-Jefferson county line. A funnel cloud was sighted in Jefferson county around 0115 UTC and some trees were downed around 0145 UTC. Wind damage was reported in Grainger county around 0100 UTC. As the storm continued to track rapidly east across Hamblen county, the 1.50 degree slice base reflectivity product continued to show a distinct hook echo and the 10.00 degree slice base reflectivity product at 0126 UTC (Fig. 4b) continued to show a bounded weak echo region (BWER) about 10-12 nm northeast of the KMRX radar. The 0126 UTC SRM product indicated 50 knots of rotational velocity about 10 nm northeast of the KMRX WSR-88D radar near 13k feet MSL. Golf ball sized hail and a funnel cloud were reported in Hamblen county around 0123 UTC, with a possible tornado around 0145 UTC. Due to the "cone of silence" effect, VIL and LRM products were of little use until the storm moved further east of the KMRX radar over eastern Hamblen county. After passing out of Hamblen county, the supercell began to weaken.
5. Second Supercell Track: Fountain City Tornado
- The second classic supercell originated over the southern counties of middle Tennessee then moved rapidly east northeast at 41 knots toward east Tennessee. By 2352 UTC (752 PM EDT), the KMRX radar indicated a mesocyclone with this storm over Bledsoe County, which is just to the west of Rhea county (Fig. 1). The rotational velocity was around 35 knots. At the same time, a strong thunderstorm was moving rapidly northeast at 50 miles an hour across Hamilton County in southeast Tennessee. The SRM indicated only weak shear with a rotational velocity around 16 knots and a VIL of around 30 kg/m2 with the Hamilton county storm. The KMRX radar indicated that a merger of the two cells was possible within the next hour about 35 nm southwest of Knox County.
- The supercell had a history of high VILs in the 50s and moderately strong rotation, so a severe thunderstorm warning was issued for Roane and Loudon Counties at 0002 UTC and later issued for Anderson County at 0033 UTC. Trees and power lines were reported down as well as golfball size hail. As the southeast Tennessee non-severe thunderstorm approached the supercell over Roane County from the southwest a disruption of the inflow to the supercell likely occurred, reducing storm- relative helicity and weakening the updraft in the storm. When the storms merged around 0056 UTC, the rotational velocity of the supercell decreased to 26 knots with only uncorrelated shear depicted. From 0101 to 0131 UTC, no mesocyclone, 3-D correlated or uncorrelated shear were detected and rotational velocities were only between 16 and 20 knots. VILs also decreased from the 50s to the 30s.
- Between 0136 and 0141 UTC however, a marked strengthening of the merged cells occurred over extreme southern Knox County with rotational velocities increasing from 15 to 30 knots with a WER becoming noticeable. A severe thunderstorm warning for Knox County was issued at 0140 UTC. Between 0141 and 0151 UTC, the storm top increased from 26k feet to 41k feet MSL. Also, a distinctive BWER became apparent having a "donut hole" appearance at both the 3.4 and 4.3 degree reflectivity slices (or 12k ft and 17k ft MSL, respectively) (Fig. 4d). An appendage was also noted at the 0.5 degree reflectivity slice and rotational velocities increased to 40 knots, which made it a moderate to strong mesocyclone (Fig. 4c). A tornado warning was issued for Knox County at 0152 UTC. By 0156 UTC, a small hook was noted over Knoxville in central Knox County at the 1.5 degree reflectivity slice or about 7k feet MSL. Rotational velocities were between 50 and 55 knots. From 0156 to 0206 UTC, the storm top collapsed from 39k feet to 29k feet MSL with the BWER becoming less distinctive and finally disappearing. However, rotational velocities remained between 40 and 50 knots until after 0212 UTC. A tornado was sighted between 0205 and 0230 UTC over Fountain City, which is a northern suburb of Knoxville. The tornado was rated an F1 and it uprooted numerous trees, downed power lines and damaged many homes in the Fountain City area.
- Since the tornadic storm was moving northeast at 40 knots a tornado warning was issued for both Grainger and Jefferson Counties at 0210 UTC and for Hamblen County at 0231 UTC. Even though the storm reflectivity lost its BWER/WER characteristics, VILs remained in the 50s. Also, base velocity at the 0.5 degree slice indicated 40 to 50 knot winds across southern Grainger and Jefferson Counties around 0235 UTC. Numerous reports of trees and power lines down were reported from southern Grainger, Jefferson, and southern Hamblen Counties. The severe thunderstorm then dissipated over northern Hamblen County.
6. Conclusion
- Overall the KMRX WSR-88D radar performed flawlessly during the first tornado outbreak to affect east Tennessee since the radar was accepted in July 1994. WSR-88D meteorological algorithms that produce overlays and products such as the STI, meso and VIL were extremely valuable in warning decisions. The STI was particularly accurate and helpful because the tornadic supercells were all isolated and had very little track deviation from volume scan to volume scan.
- Another obvious benefit from the WSR-88D was that identifiable supercell characteristics such as a bounded weak echo region and hook echo could be recognized easily. Ultimately, all of this radar information translated into lead times which averaged over 20 minutes for each affected county. Since the NWSO Knoxville/Tri-Cities office did not have full county warning area responsibility as of May 18,1995, the radar information was passed onto area WSO's, which issued tornado and severe thunderstorm warnings based upon this information. It is believed that this adequate lead time was primarily responsible for saving lives and minimizing injuries.
7. References
- Bothwell, P. D., 1988: Forecasting convection with the AFOS data analysis programs (ADAP-version 2.0). NOAA Tech. Memo. NWS SR-122, Scientific Services Div., NWS Southern Region, Fort Worth,TX, 92 pp.
- Davies, J. M., 1993: Hourly helicity, instability, and EHI in forecasting supercell tornadoes. Preprints, 17th Conf. Severe Local Storms (St. Louis, MO), Amer. Meteor. Soc., 107-111.
- Davies-Jones, R., D. Burgess, and M. Foster, 1990: Test of helicity as a tornado forecast parameter. em>Preprints, 16th Conf. Severe Local Storms (Kananaskis Park, Alberta), Amer. Meteor. Soc., 588-592.
- Hart, J. A., and W. D. Korotky, 1991: The SHARP workstation -- v1.50. A skew T/hodograph analysis and research program for the IBM and compatible PC. User's manual. NOAA/NWS Forecast Office, Charleston, WV, 62 pp.
- Johns, R. H., J. M. Davies, and P. W. Leftwich, 1993: Some wind and instability parameters associated with strong and violent tornadoes. Part II: Variations in the combinations of wind and instability parameters. The Tornado: its structure, dynamics, prediction, and hazards. (Geophys. Mono. 79), Amer. Geophys. Union, 583-590.


 Local Radar
 Huntsville Radar
 Regional Satellite
 Graphical Forecast
 Weather Map