Overview & Graphics
|
|
|
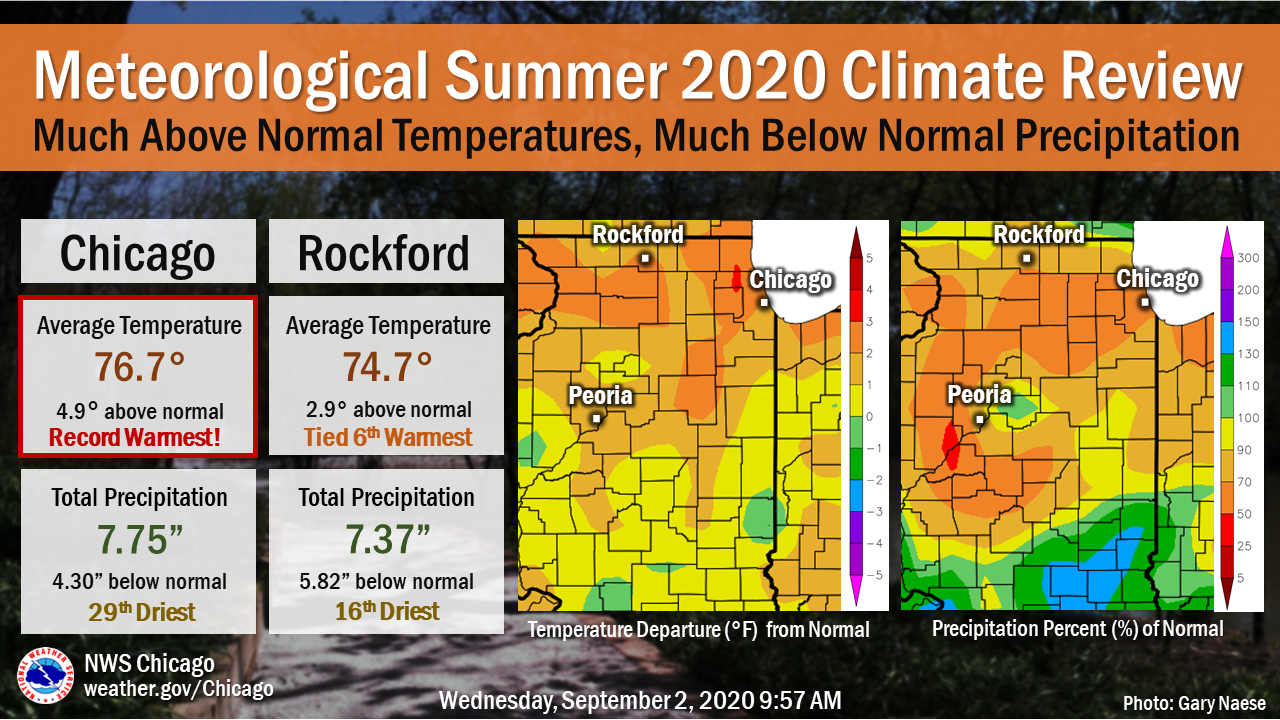
Meteorological Summer 2020 Climate Review June - August |
|
|
|
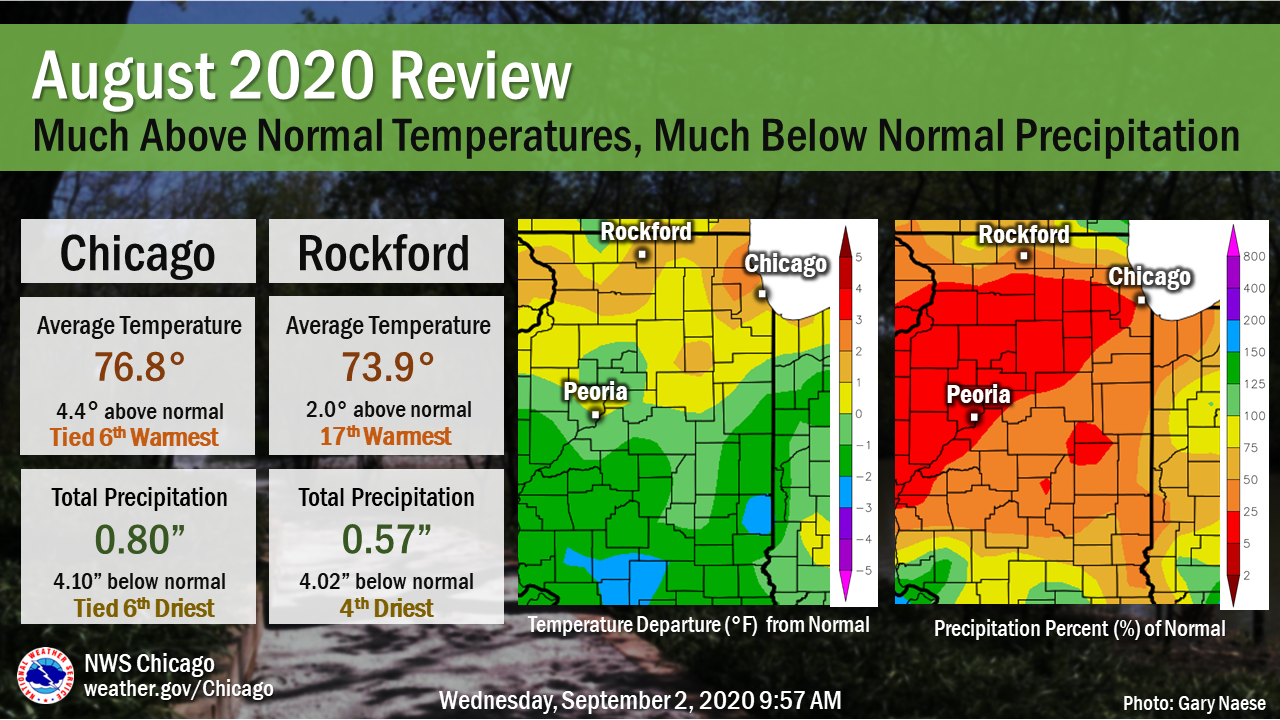
August 2020 Climate Review |
Public Information Statement...UPDATED
National Weather Service Chicago IL
1212 PM CDT Wed Sep 2 2020 /112 PM EDT Wed Sep 2 2020/

...A Look Back at the Climate for Meteorological Summer (June,
July, August) 2020 for Chicago and Rockford...

At Chicago, the average high temperature for the summer season was
86.2 degrees, which is 4.3 degrees above the 1981 to 2010
average. The average low temperature was 67.1 degrees, which is
5.4 degrees above normal. The mean temperature for the season was
76.7 degrees, which is 4.9 degrees above normal. A total of 7.75
inches of precipitation was recorded during this past summer,
which is 4.30 inches below normal.

Records established or tied during the summer months:

** The Summer of 2020 was the hottest summer on record, with a
 mean temperature of 76.7 degrees, exceeding the previous record
 of 76.4 degrees set in 1955.

June:
* Record daily high temperature of 94 degrees was set on the 2nd.
* Record daily precipitation of 1.55 inches on the 22nd.
* Record daily precipitation of 1.55 inches on the 26th.
** Tied for 6th hottest June on record with 74.0 degrees.

July:
** 4th warmest July on record with 79.2 degrees.

August:
* Record daily warmest minimum temperature of 78 degrees was tied
  on the 27th.
* Record daily warmest minimum temperature of 77 degrees was tied
  on the 28th.
** Tied for 6th warmest August on record with 76.8 degrees.
** Tied for 6th driest August on record with 0.80 inches.

At Rockford, the average high temperature was 86.0 degrees, which
is 3.3 degree above normal. The average low temperature was 63.4
degrees, which is 2.4 degrees above normal. The mean temperature
for the season was 74.7 degrees, which is 2.9 degrees above
normal. A total of 7.37 inches of precipitation was recorded
during this past summer, which was 5.82 inches below normal.

Records established or tied during the summer months:

** The Summer of 2020 was tied with the 6th hottest summer on
 record, with a mean temperature of 74.7 degrees.

June:
* Record daily warmest minimum temperature of 71 degrees was set
  on the 9th.
** Tied for 8th warmest June on record with 73.3 degrees.

July: None.

August:
** 4th driest August on record with 0.57 inches.

$$

BKL
Latest Seasonal Climate Report: Chicago | Rockford
Public Information Statement...UPDATED
National Weather Service Chicago IL
1204 PM CDT Wed Sep 2 2020 /104 PM EDT Wed Sep 2 2020/

...A Look Back at the Climate for the Month of August 2020 for
Chicago and Rockford...

At Chicago, the average high temperature was 86.4 degrees, which
is 4.5 degrees above normal. The average low temperature was
67.2 degrees, which is 4.3 degrees above normal. The average
temperature for the month was 76.8 degrees, which is 4.4 degrees
above normal. During the month of August, 0.80 inches of
precipitation were recorded, which is 4.10 inches below normal.


Two daily records were tied for Chicago during the month of
August 2020:
* Record daily warmest minimum temperature of 78 degrees was tied
  on the 27th.
* Record daily warmest minimum temperature of 77 degrees was tied
  on the 28th.

Two Top Ten Monthly Records:
**Tied for 6th warmest August on record since 1872 with 76.8
 degrees.
**Tied for 6th driest August on record since 1871 with 0.80
 inches.


At Rockford, the average high temperature was 85.7 degrees, which
is 3.3 degrees above normal. The average low temperature was 62.0
degrees, which is 0.7 degrees above normal. The average
temperature for the month was 73.9 degrees, which is 2.0 degrees
above normal. During the month of August, 0.57 inches of
precipitation were recorded, which is 4.02 inches below normal.

There were no daily records set for Rockford during the month of
August 2020.

One Top Ten Monthly Record:
**4th driest August on record since 1905 with 0.57 inches.

$$

BKL
Latest Monthly Climate Report: Chicago | Rockford
| Rank | Year | Mean Average Temperature (°F) |
|---|---|---|
| 1 | 2020 | 76.7 |
| 2 | 1955 | 76.4 |
| 3 | 1995 | 76.3 |
| 4 | 2012 | 76.1 |
| 5 | 1921 | 75.9 |
| 6 | 1949 | 75.5 |
| 7 | 1959 | 75.4 |
| T8 | 2010 | 75.2 |
| T8 | 1973 | 75.2 |
| T8 | 1953 | 75.2 |
| Rank | Year | Mean Average Temperature (°F) |
|---|---|---|
| 1 | 1921 | 76.2 |
| 2 | 1934 | 75.8 |
| T3 | 2012 | 75.2 |
| T3 | 1983 | 75.2 |
| 5 | 1949 | 74.8 |
| T6 | 2020 | 74.7 |
| T6 | 1995 | 74.7 |
| T6 | 1988 | 74.7 |
| T9 | 1936 | 74.5 |
| T9 | 1933 | 74.5 |
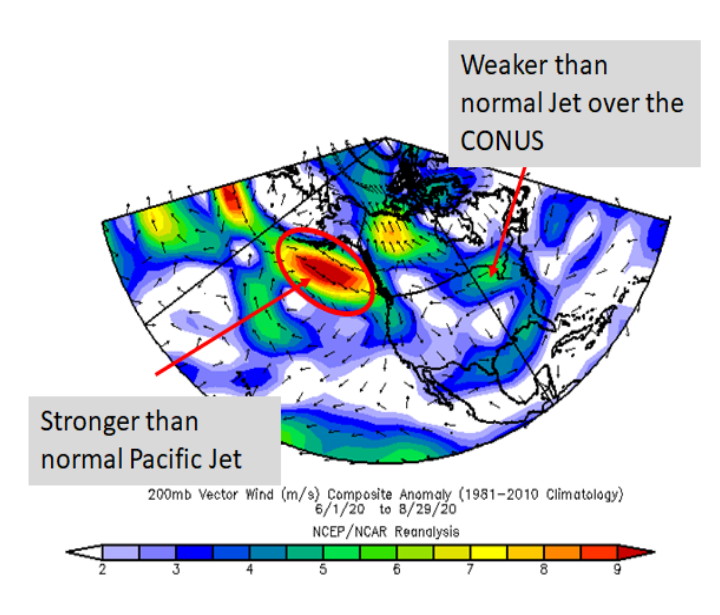
Meteorologically, the jet stream pattern across most of the continental U.S. during much of the summertime was weaker than average, which resulted in fewer and generally weaker atmospheric disturbances coming through the central U.S. during the course of the season. These disturbances produce most of our precipitation, so having fewer of them come through our area led to us seeing less widespread precipitation events, which ultimately led to us experiencing generally drier conditions than normal. Persistently dry conditions during the summer result in dry soils and less cloud cover, which in turn result in warmer temperatures due to more insolation and efficient heating of the ground.
|
|
|
Jet stream (250 mb wind) average pattern during June-August 2020. |
|
|
|
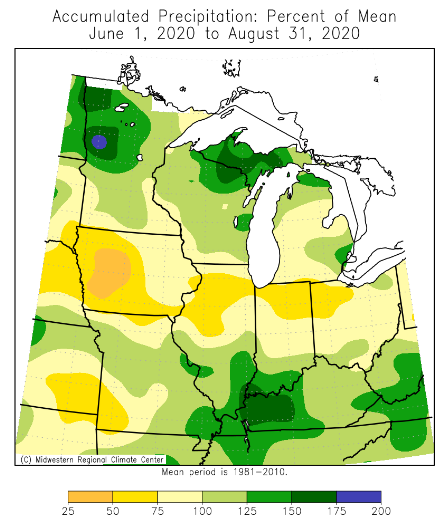
Midwest percent of normal precipitation during June-August 2020. |
Events
NWS Chicago Science and Past Events Page


 Follow us on YouTube