|
This page houses climatological tornado data for the NWS Chicago County Warning Area (CWA), a 23 county area that includes a large portion of northern Illinois and northwest Indiana. This page can serve to help with tornado risk assessment across the local area. For more on specific tornadoes of the past, please visit the NCEI Storm Events Database, the Midwestern Regional Climate Center's Tornado Tracks Page, and our Science and Past Events Page. Thank you to student Matthew Cello of Northern Illinois University and Stephen Strader Ph.D now at Villanova University, for their assistance in compiling, interpreting, and illustrating the statistics and spatial data. |
Statistics
| NWS Chicago CWA Tornado Counts by EF (Enhanced Fujita) Scale 1950-2017 | |||||
|
Maximum EF Damage |
Count |
Mean Length (mi) |
Mean Width (yds) |
Fatalities |
Injuries |
|
EF-0 |
227 |
1.14 |
43.4 |
0 |
7 |
|
EF-1 |
236 |
3.20 |
88.6 |
2 |
53 |
|
EF-2 |
113 |
7.13 |
147.9 |
10 |
469 |
|
EF-3 |
27 |
18.8 |
360.1 |
14 |
140 |
|
EF-4 |
11 |
28.62 |
681.8 |
90 |
1,660 |
|
EF-5 |
1 |
16.40 |
600.0 |
29 |
350 |
|
All Tornadoes |
615 |
4.32 |
106.2 |
145 |
2,679 |
|
Significant (EF-2+) |
152 |
10.81 |
227.2 |
143 |
2,619 |
|
Violent (EF-4+) |
12 |
27.60 |
675.0 |
119 |
2,010 |
For more on the Enhanced Fujita Scale for tornado damage, visit here.
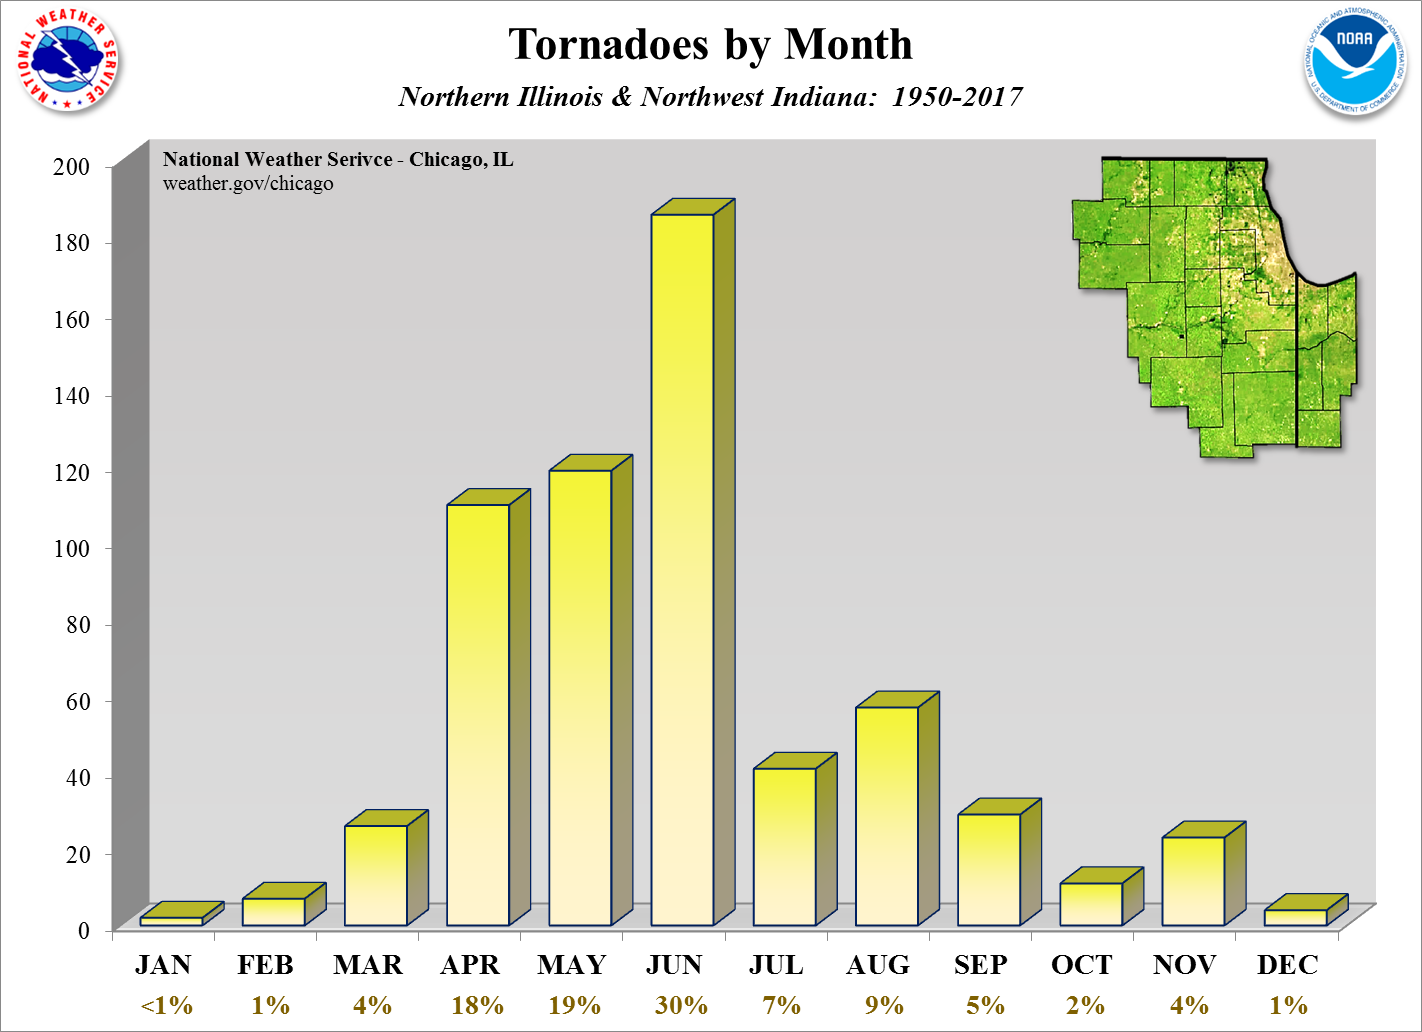
| NWS Chicago CWA Tornado Percentage Counts by Magnitude 1950-2017 | |||||||||||||||||||||
|
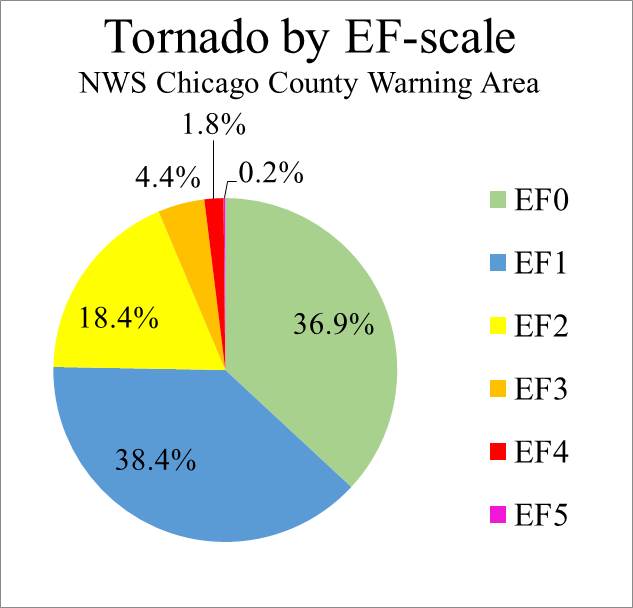 |
||||||||||||||||||||
Spatial Data
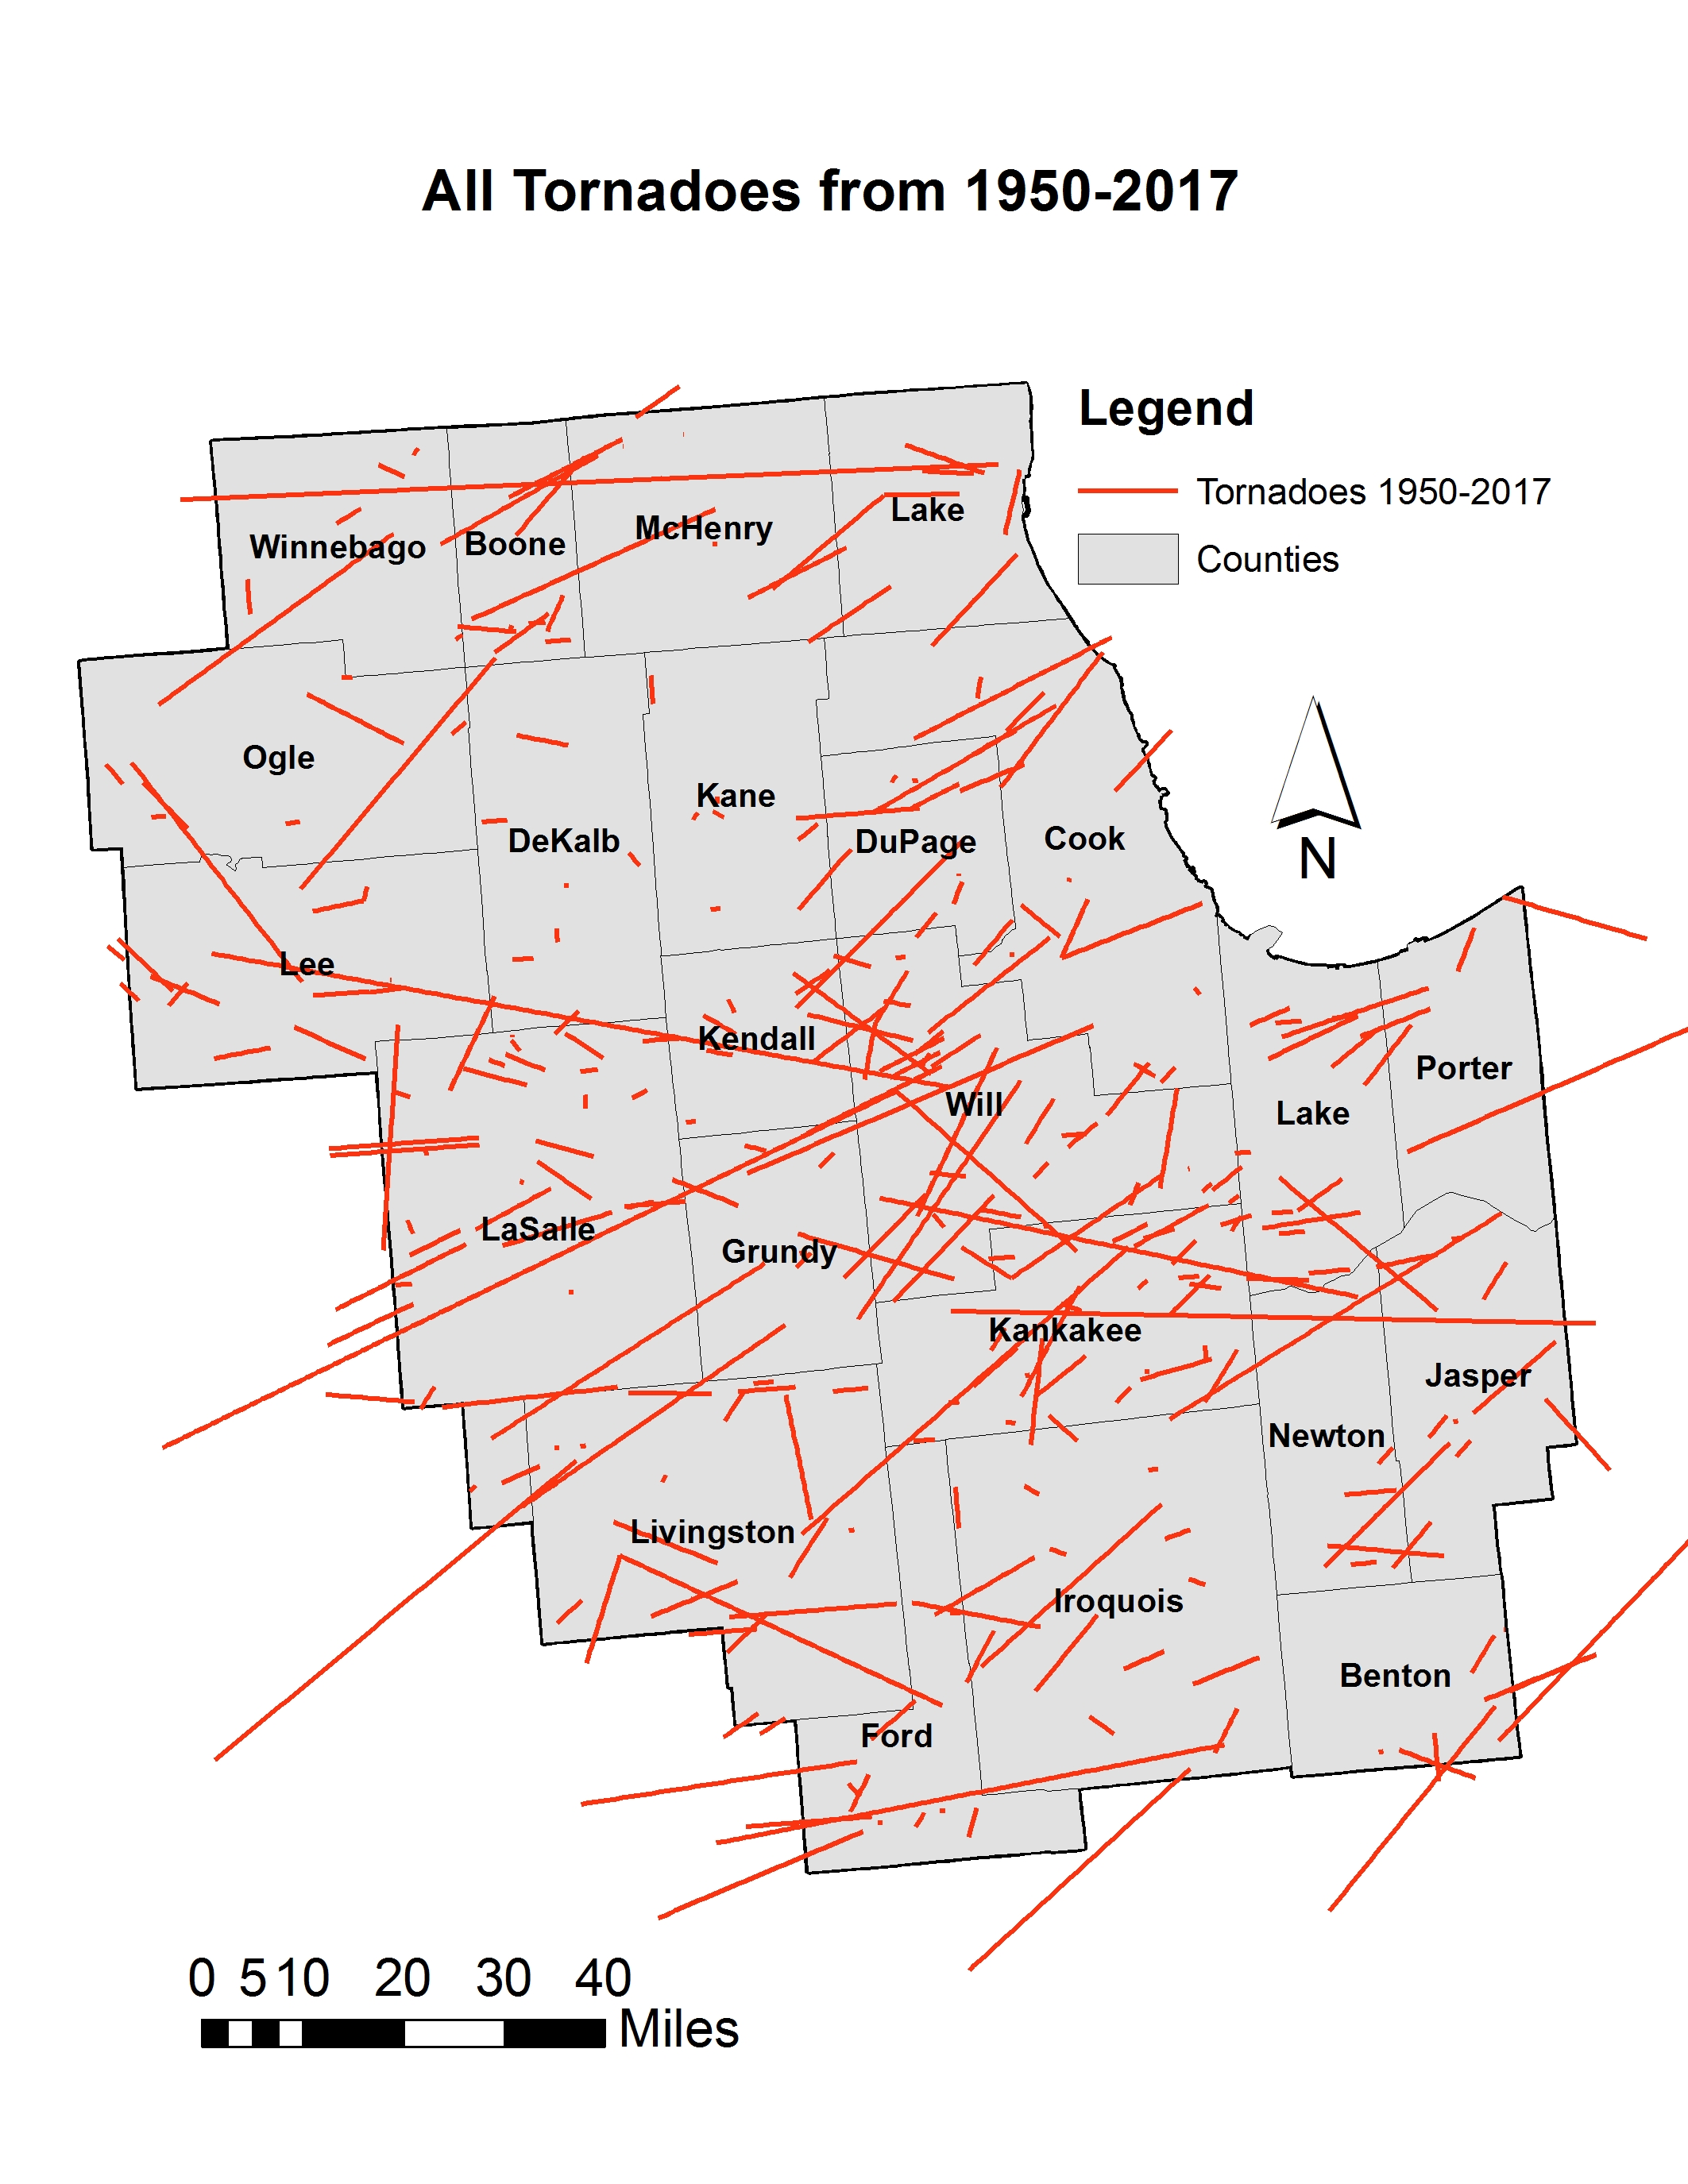 |
 |
 |
 |
| Tornado Paths Across the U.S. From 1950 - Present |
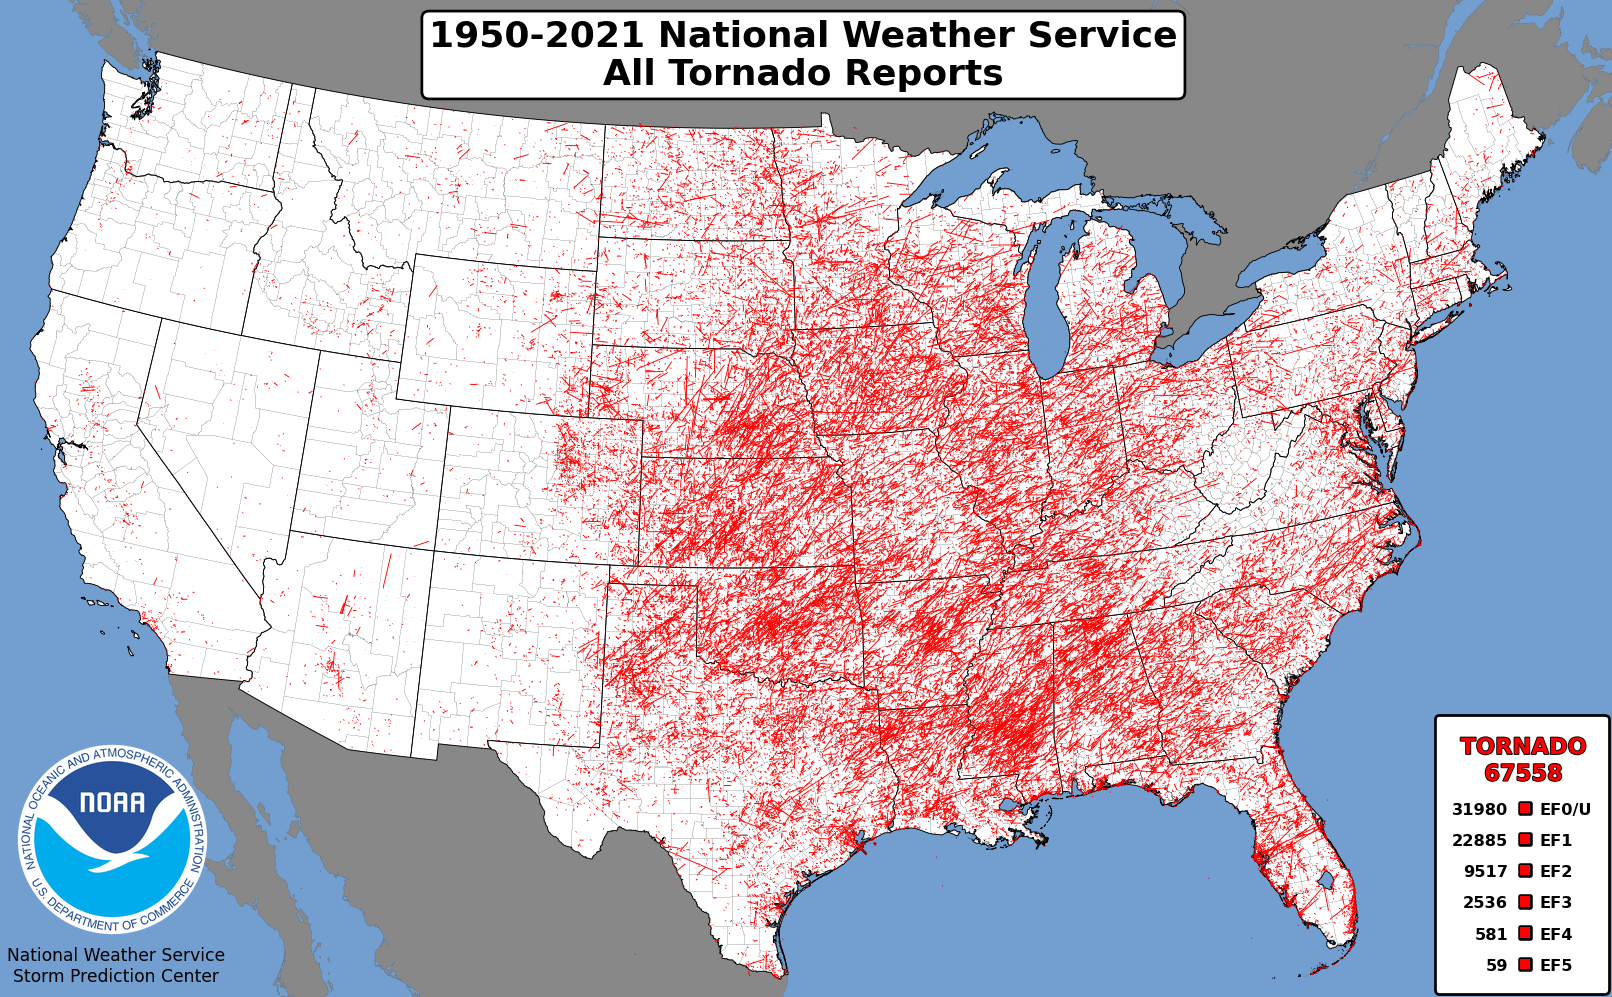 |
 |
 |
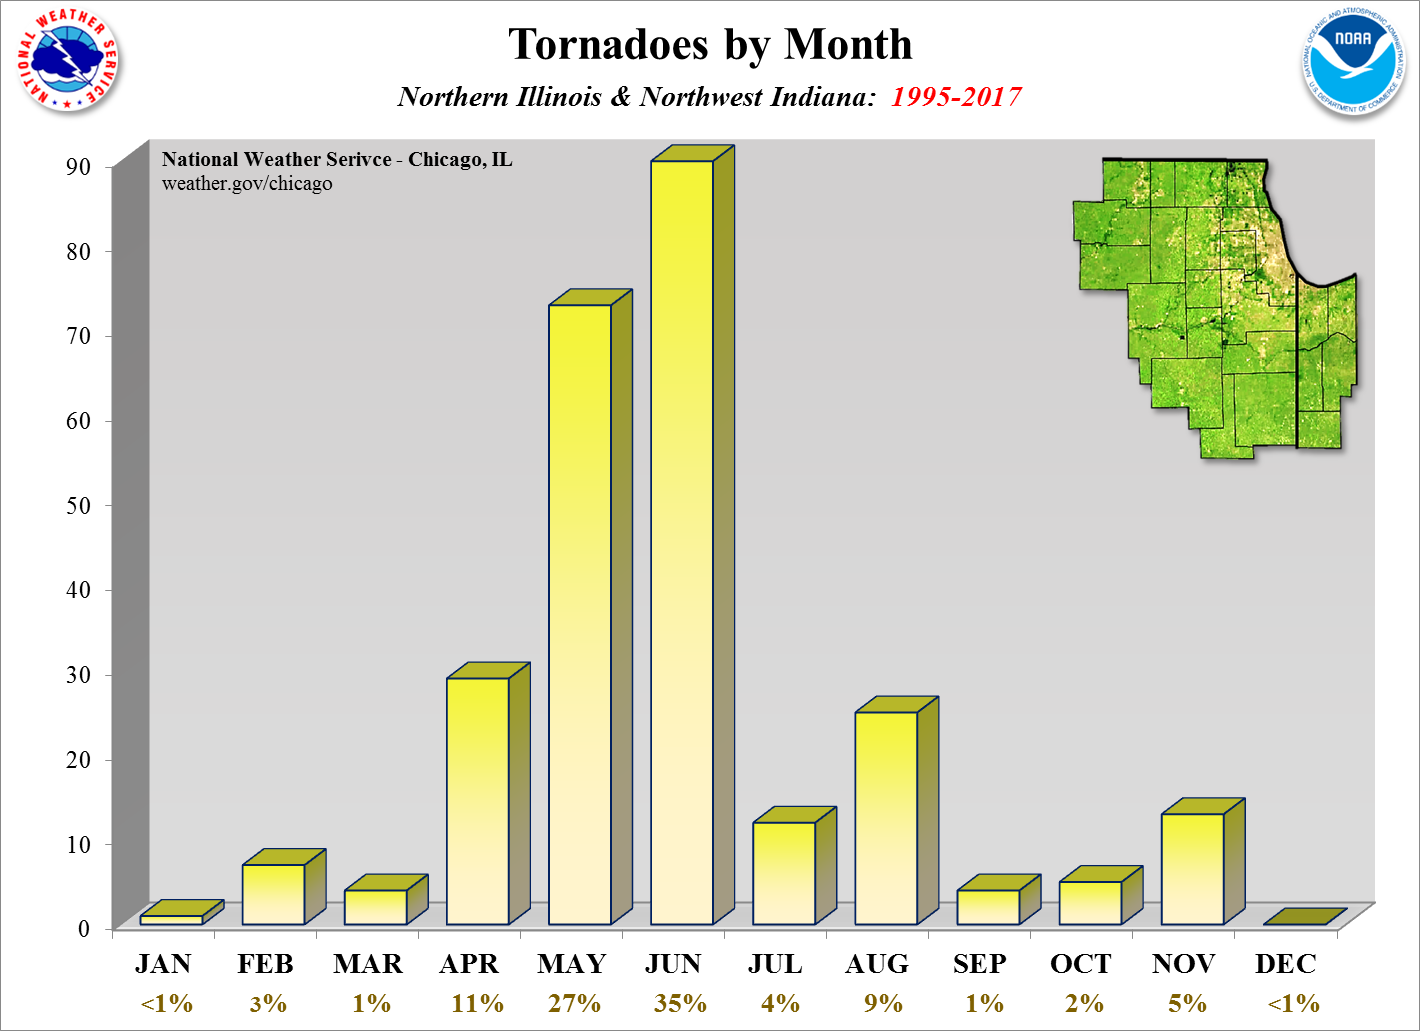
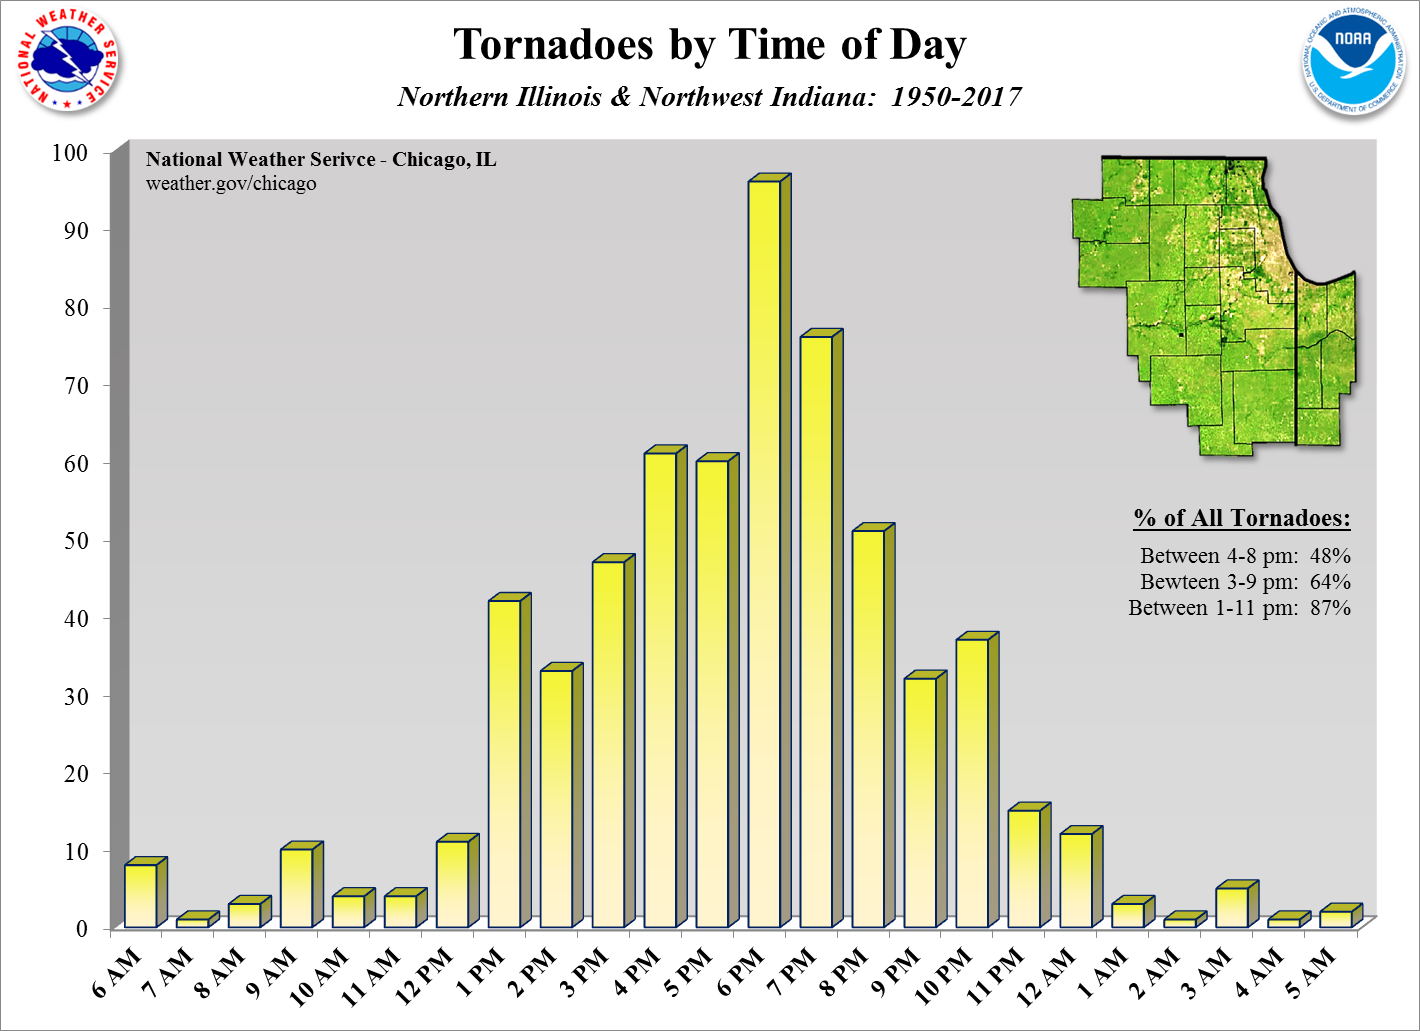
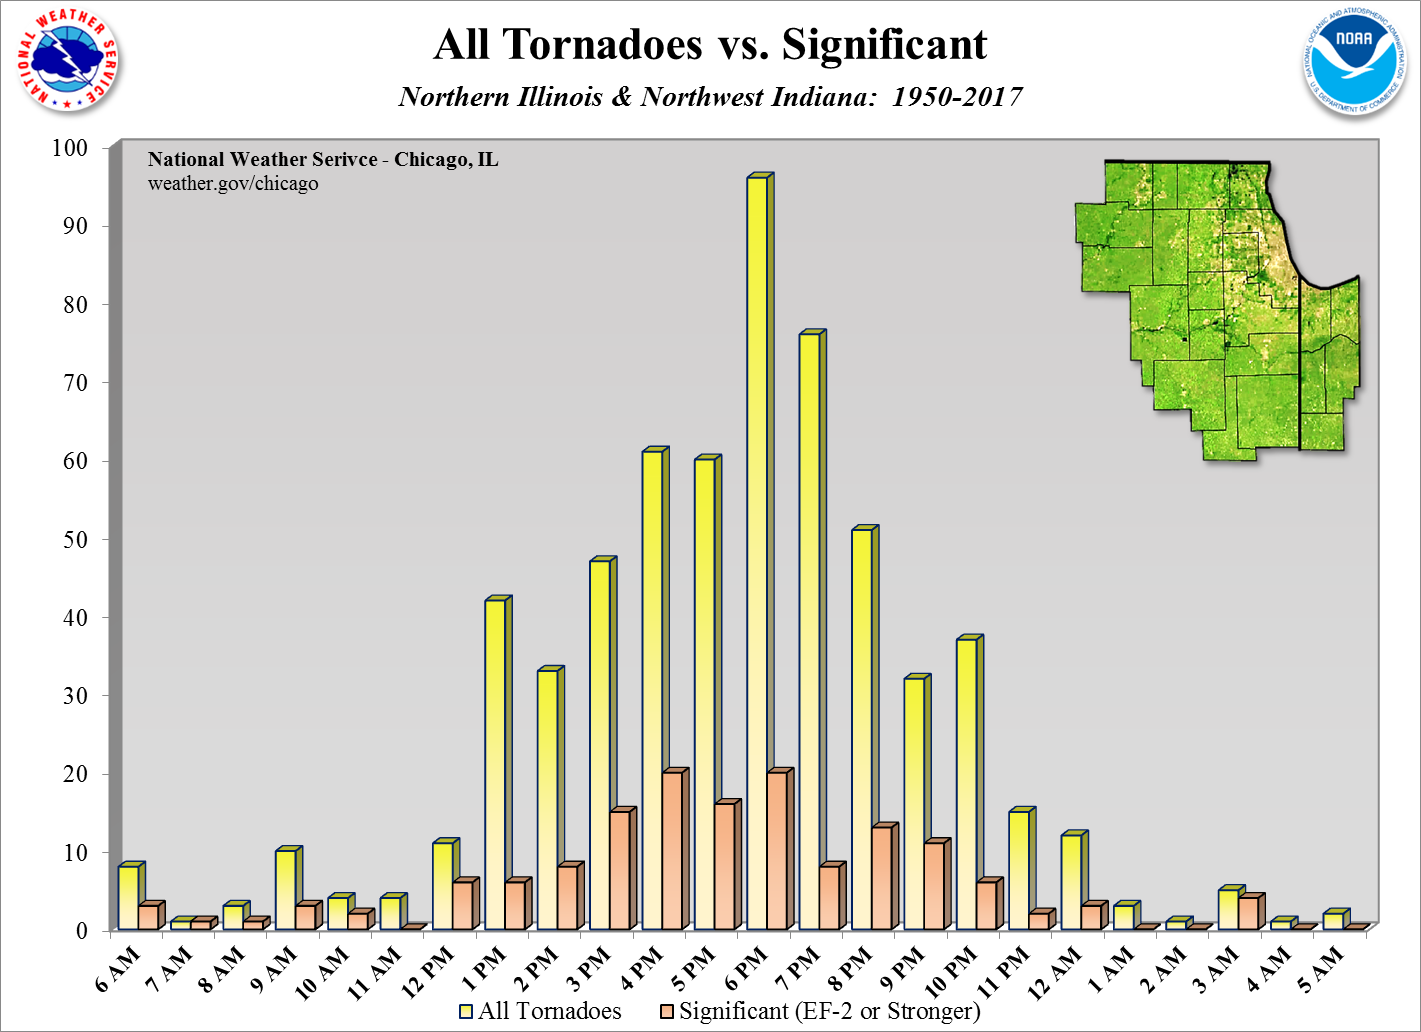
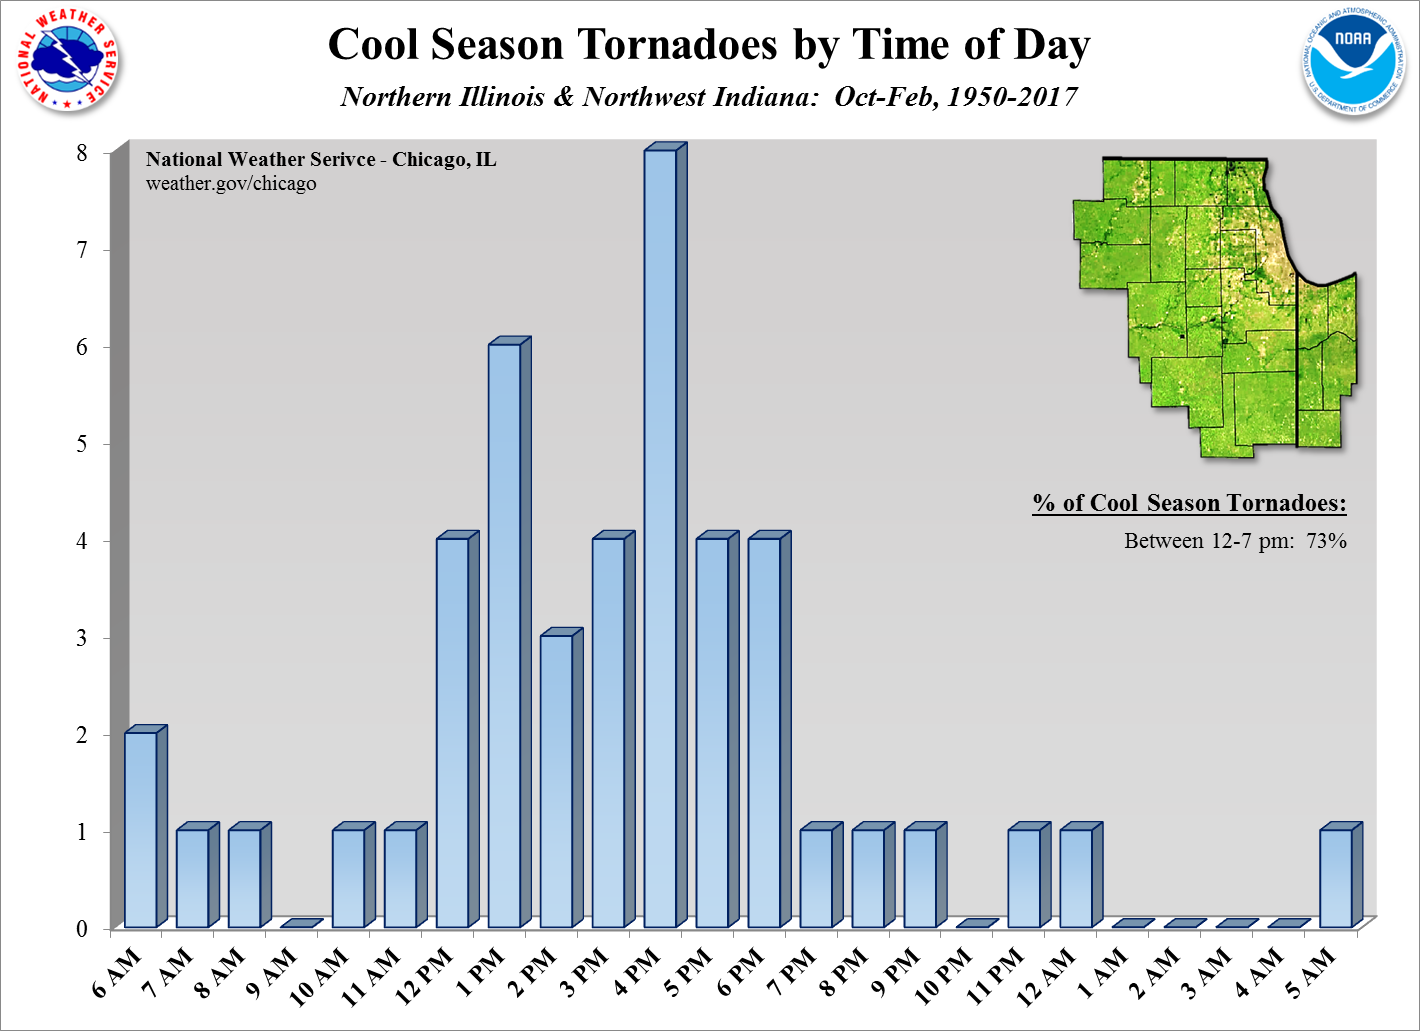
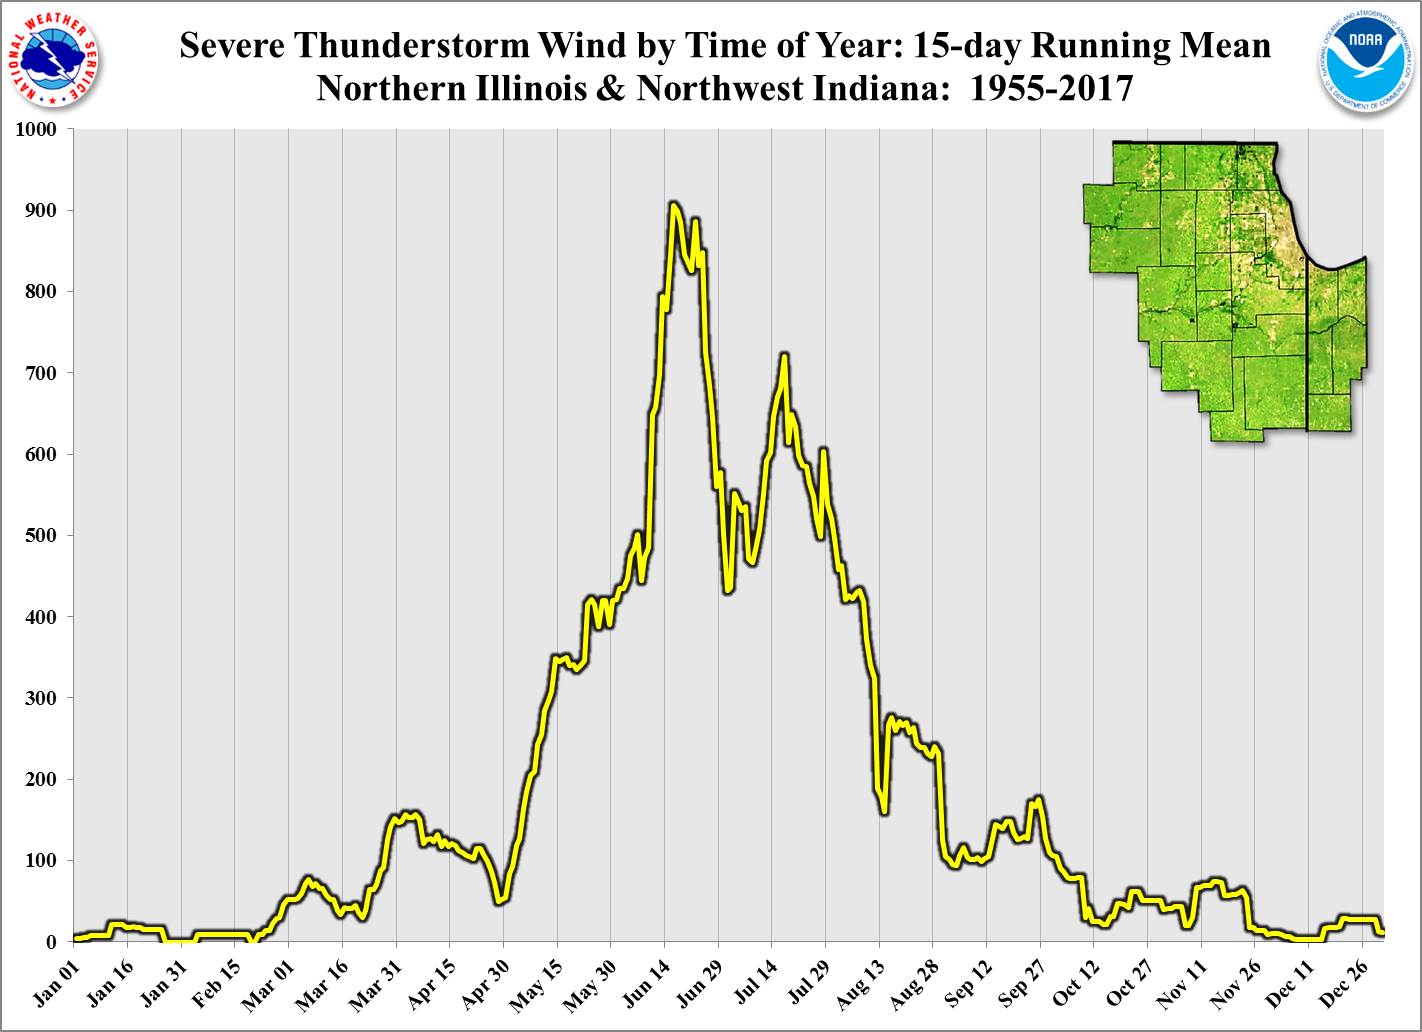
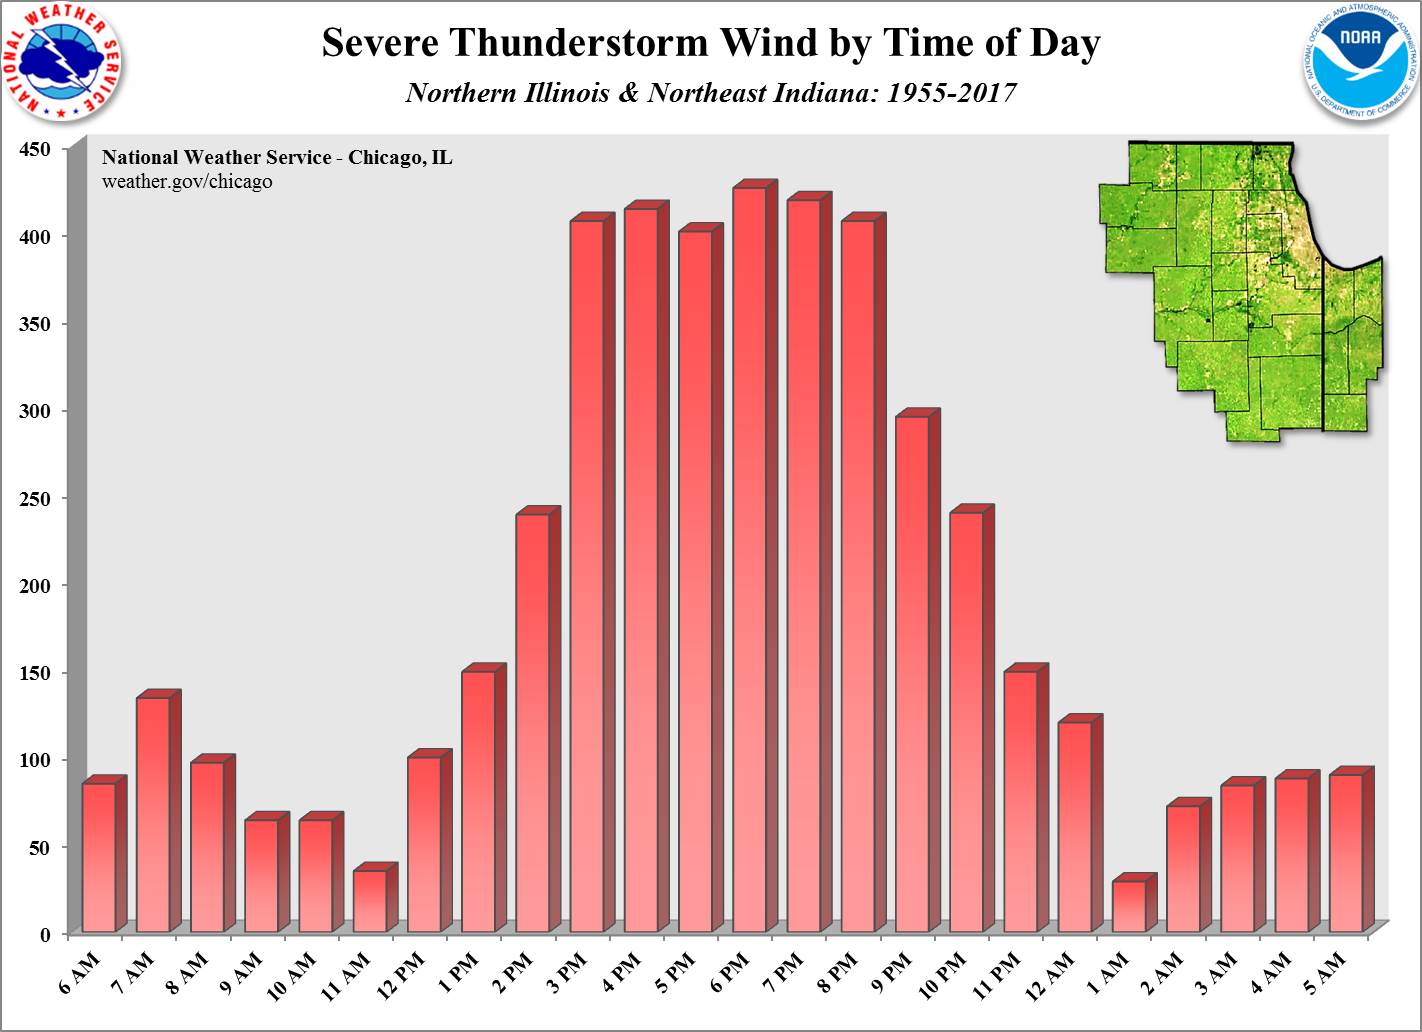
Temporal Data
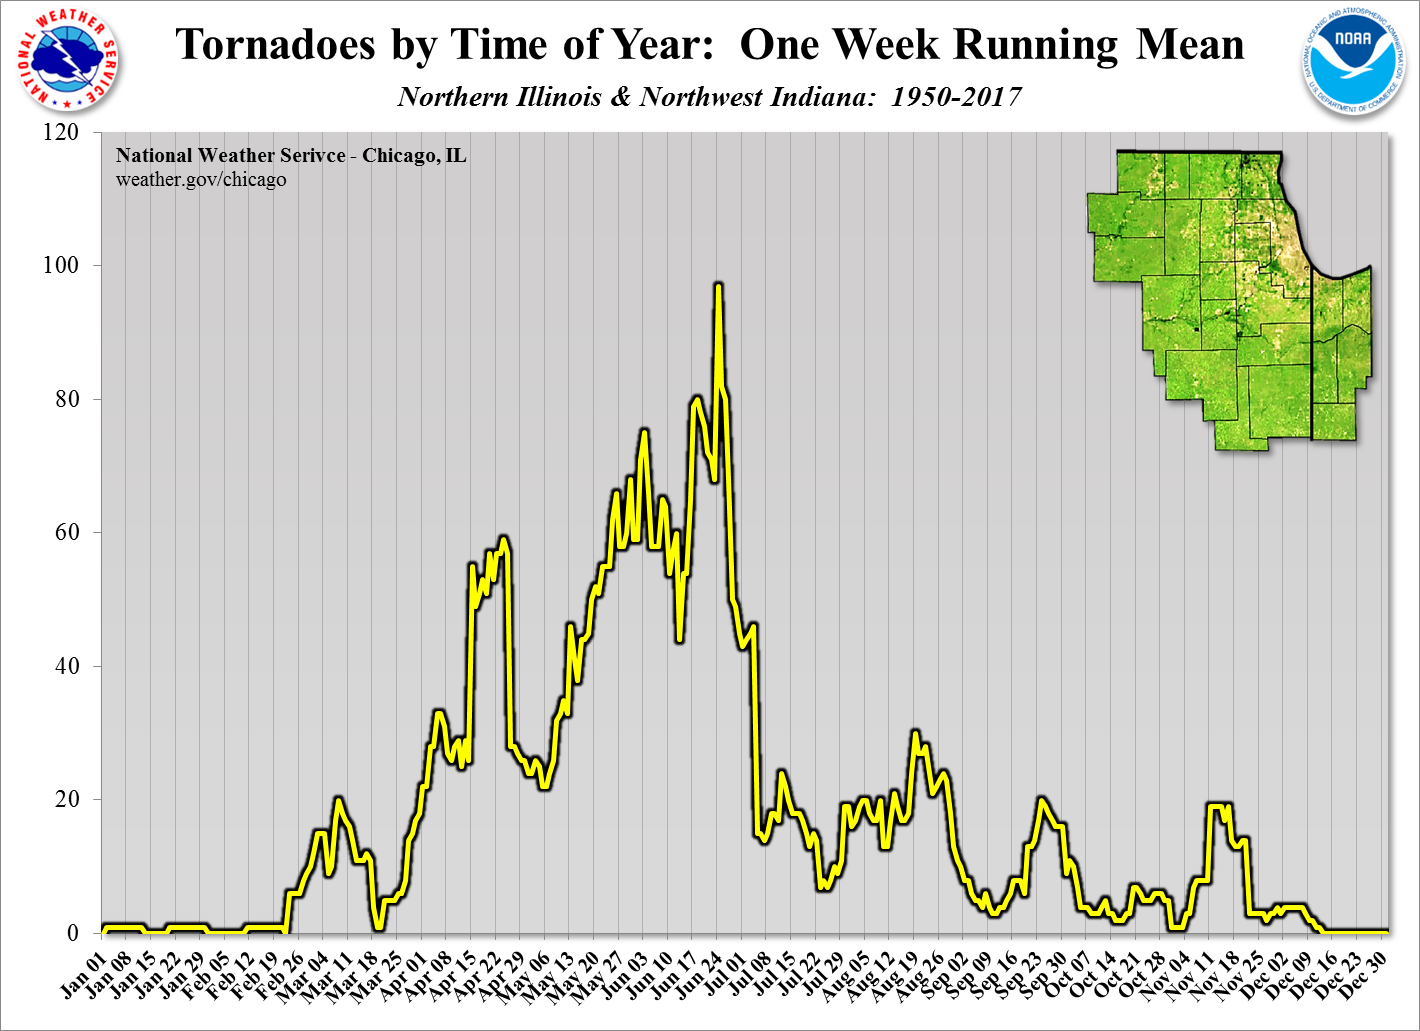 |
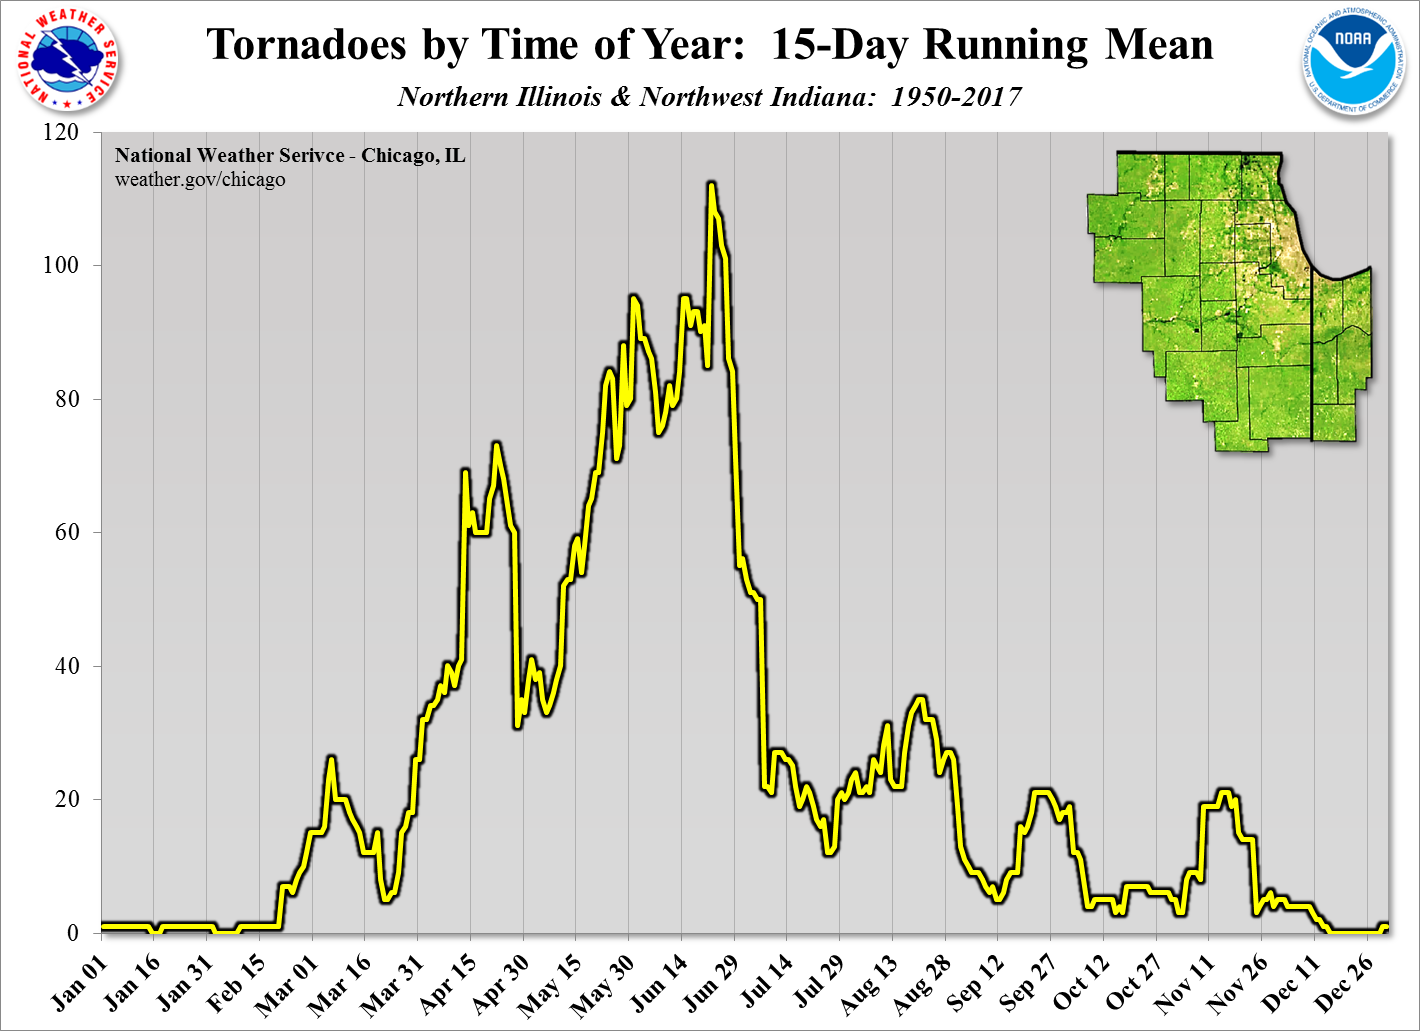 |
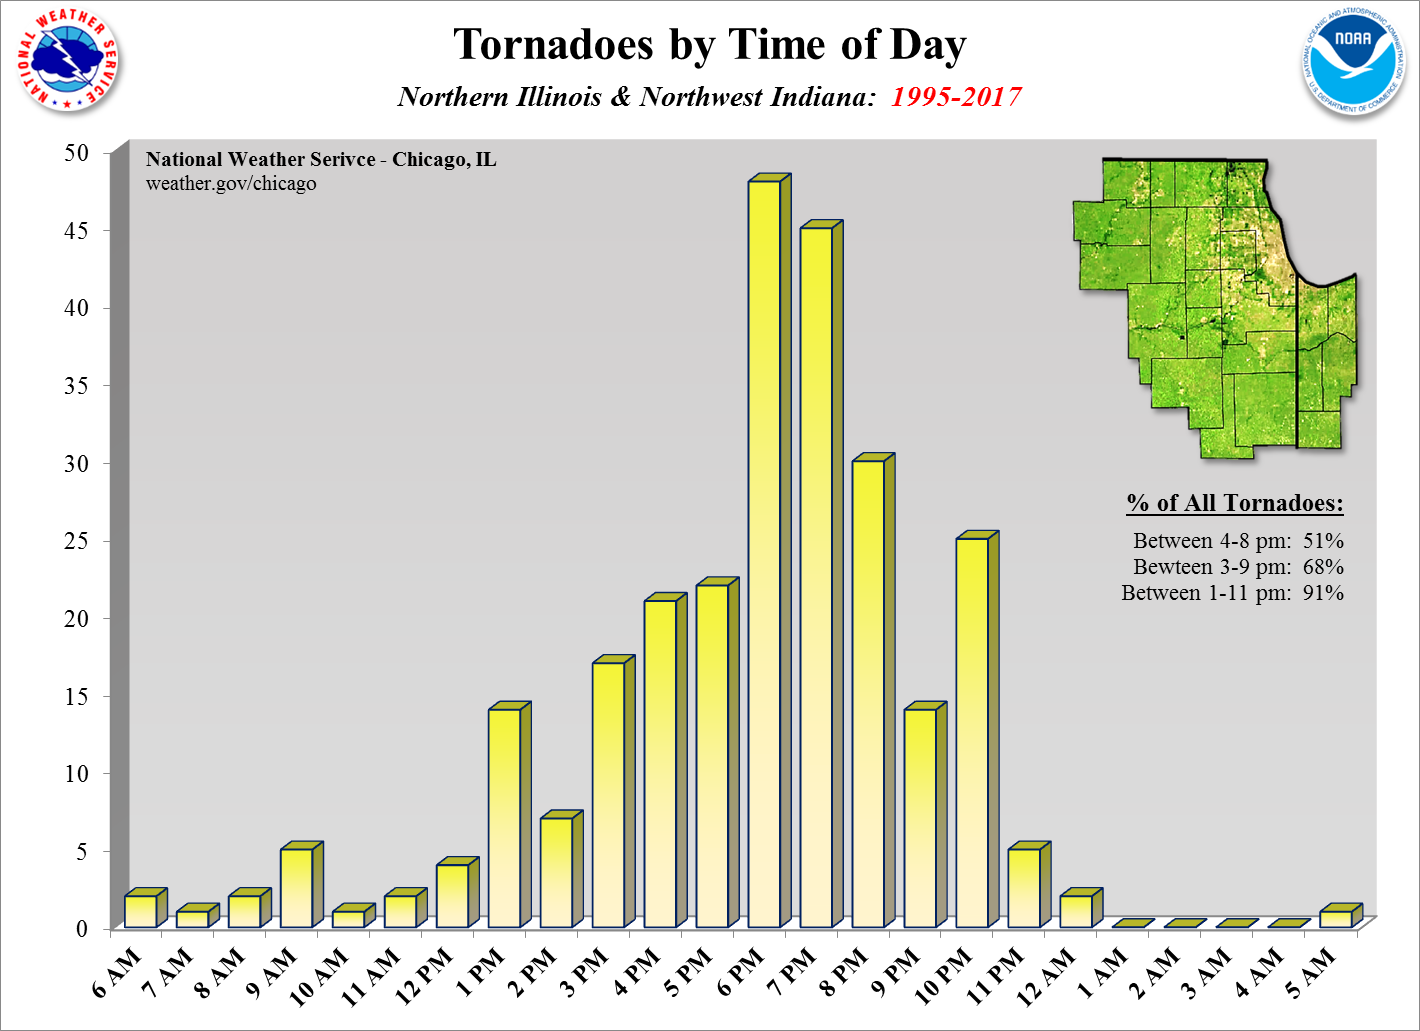
| Same Data as Above but for 1995-Present | ||
|
 |
 |
 |
For the entire state of Illinois, see these graphics: Time of Year | Time of Day
For the entire U.S., see these graphics: Time of Year | Time of Day
Year-To-Year Charts
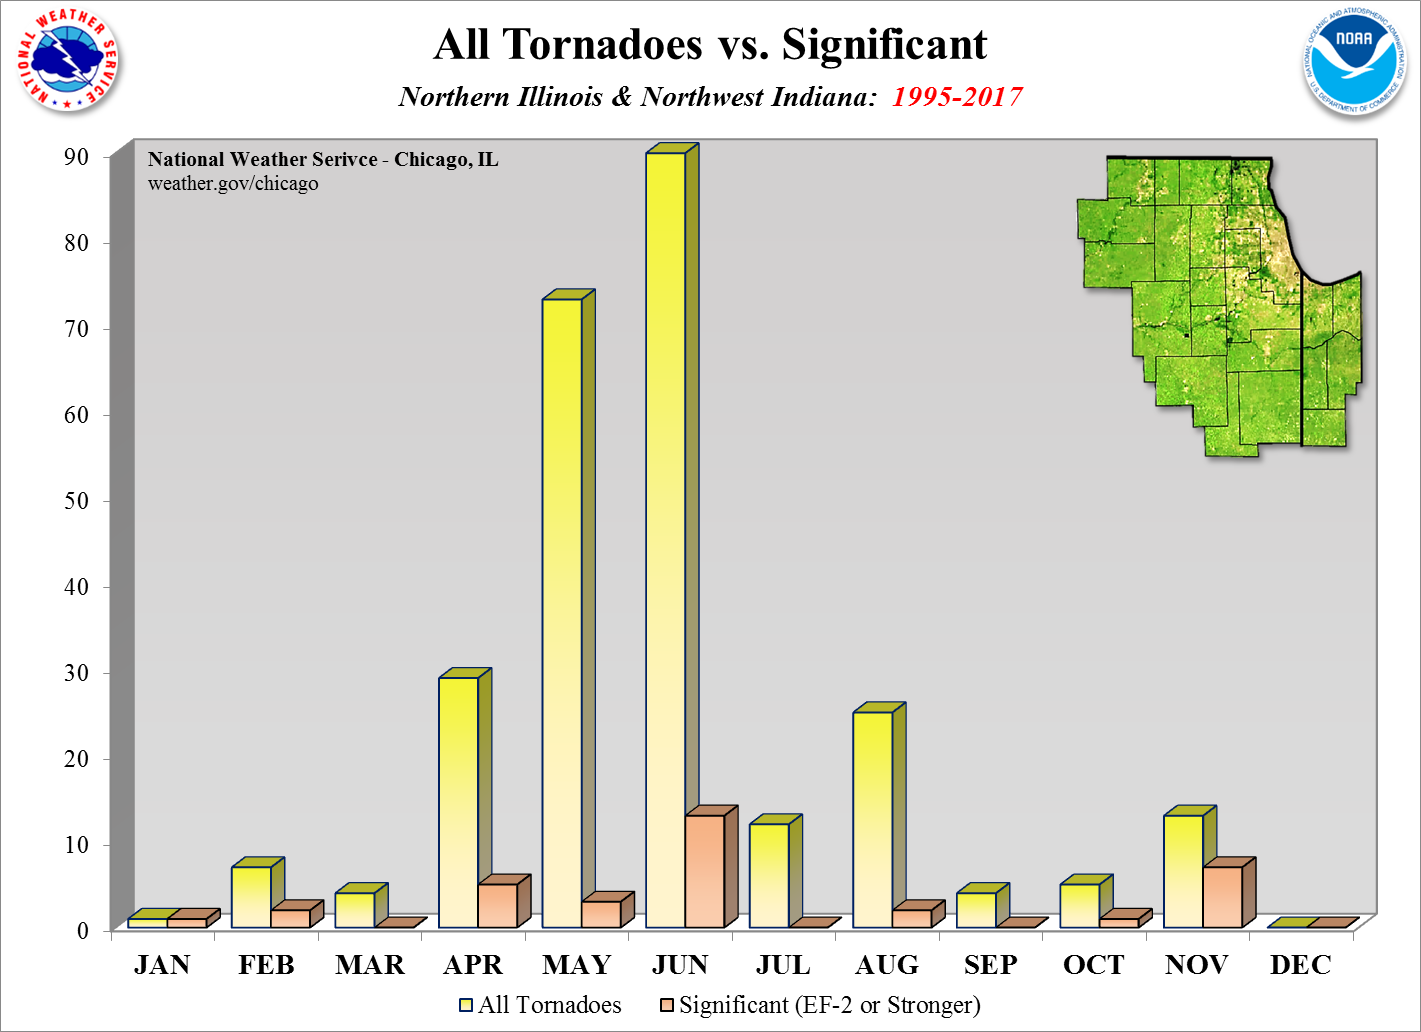
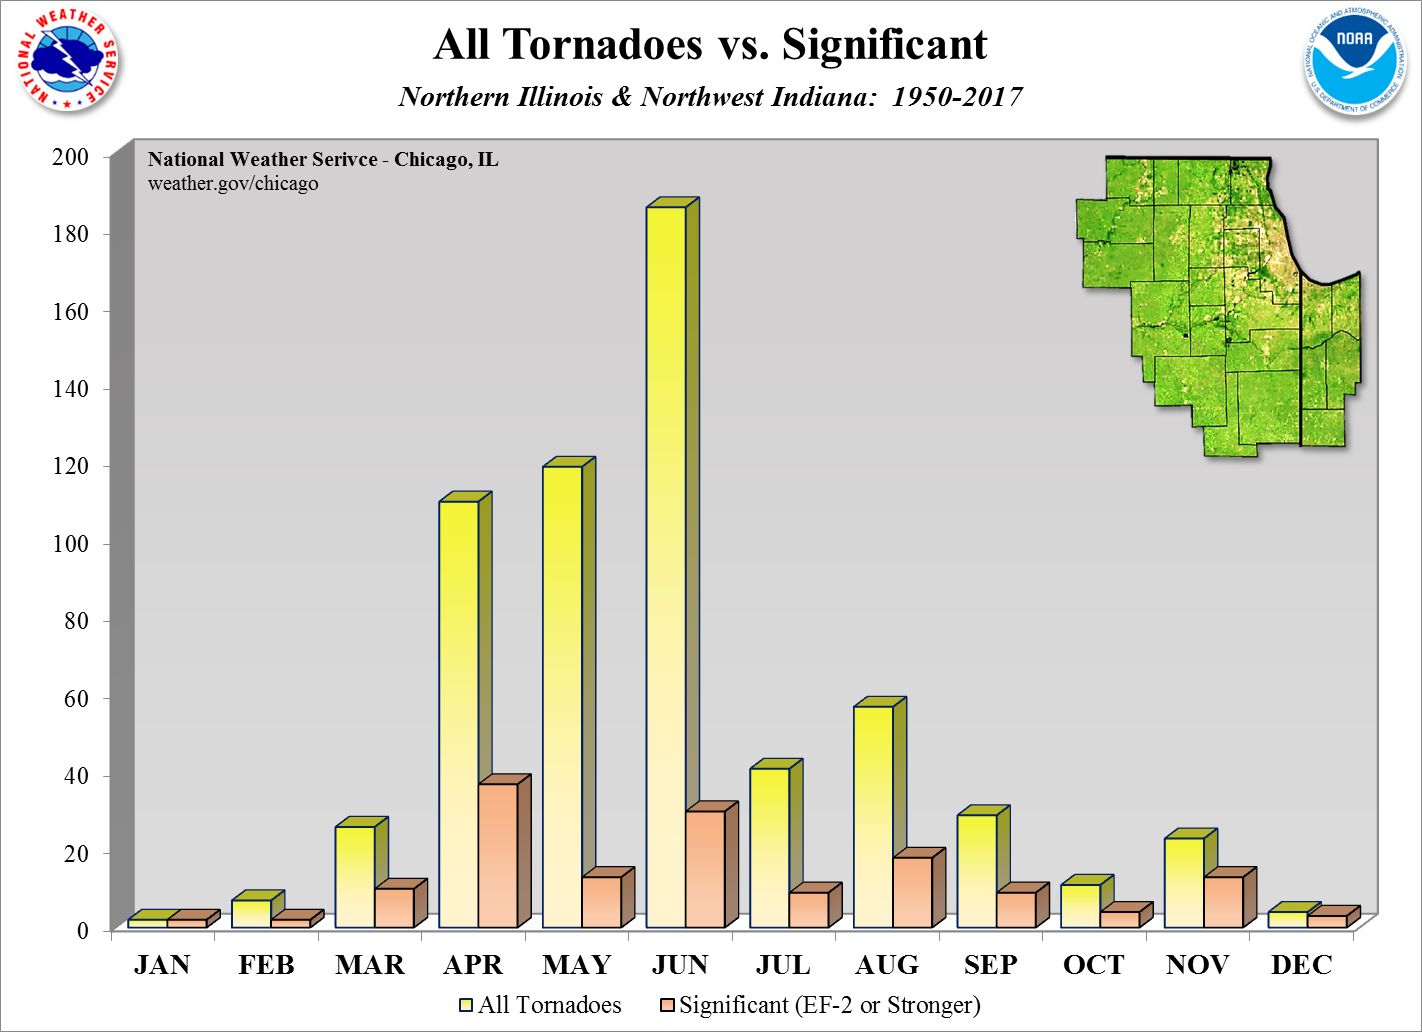
| NWS Chicago CWA Annual Tornadoes & Significant Tornadoes |
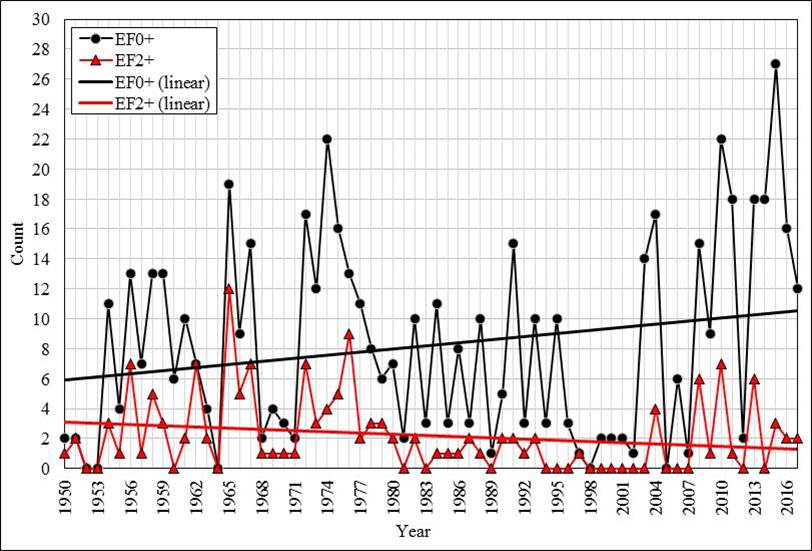 |
|
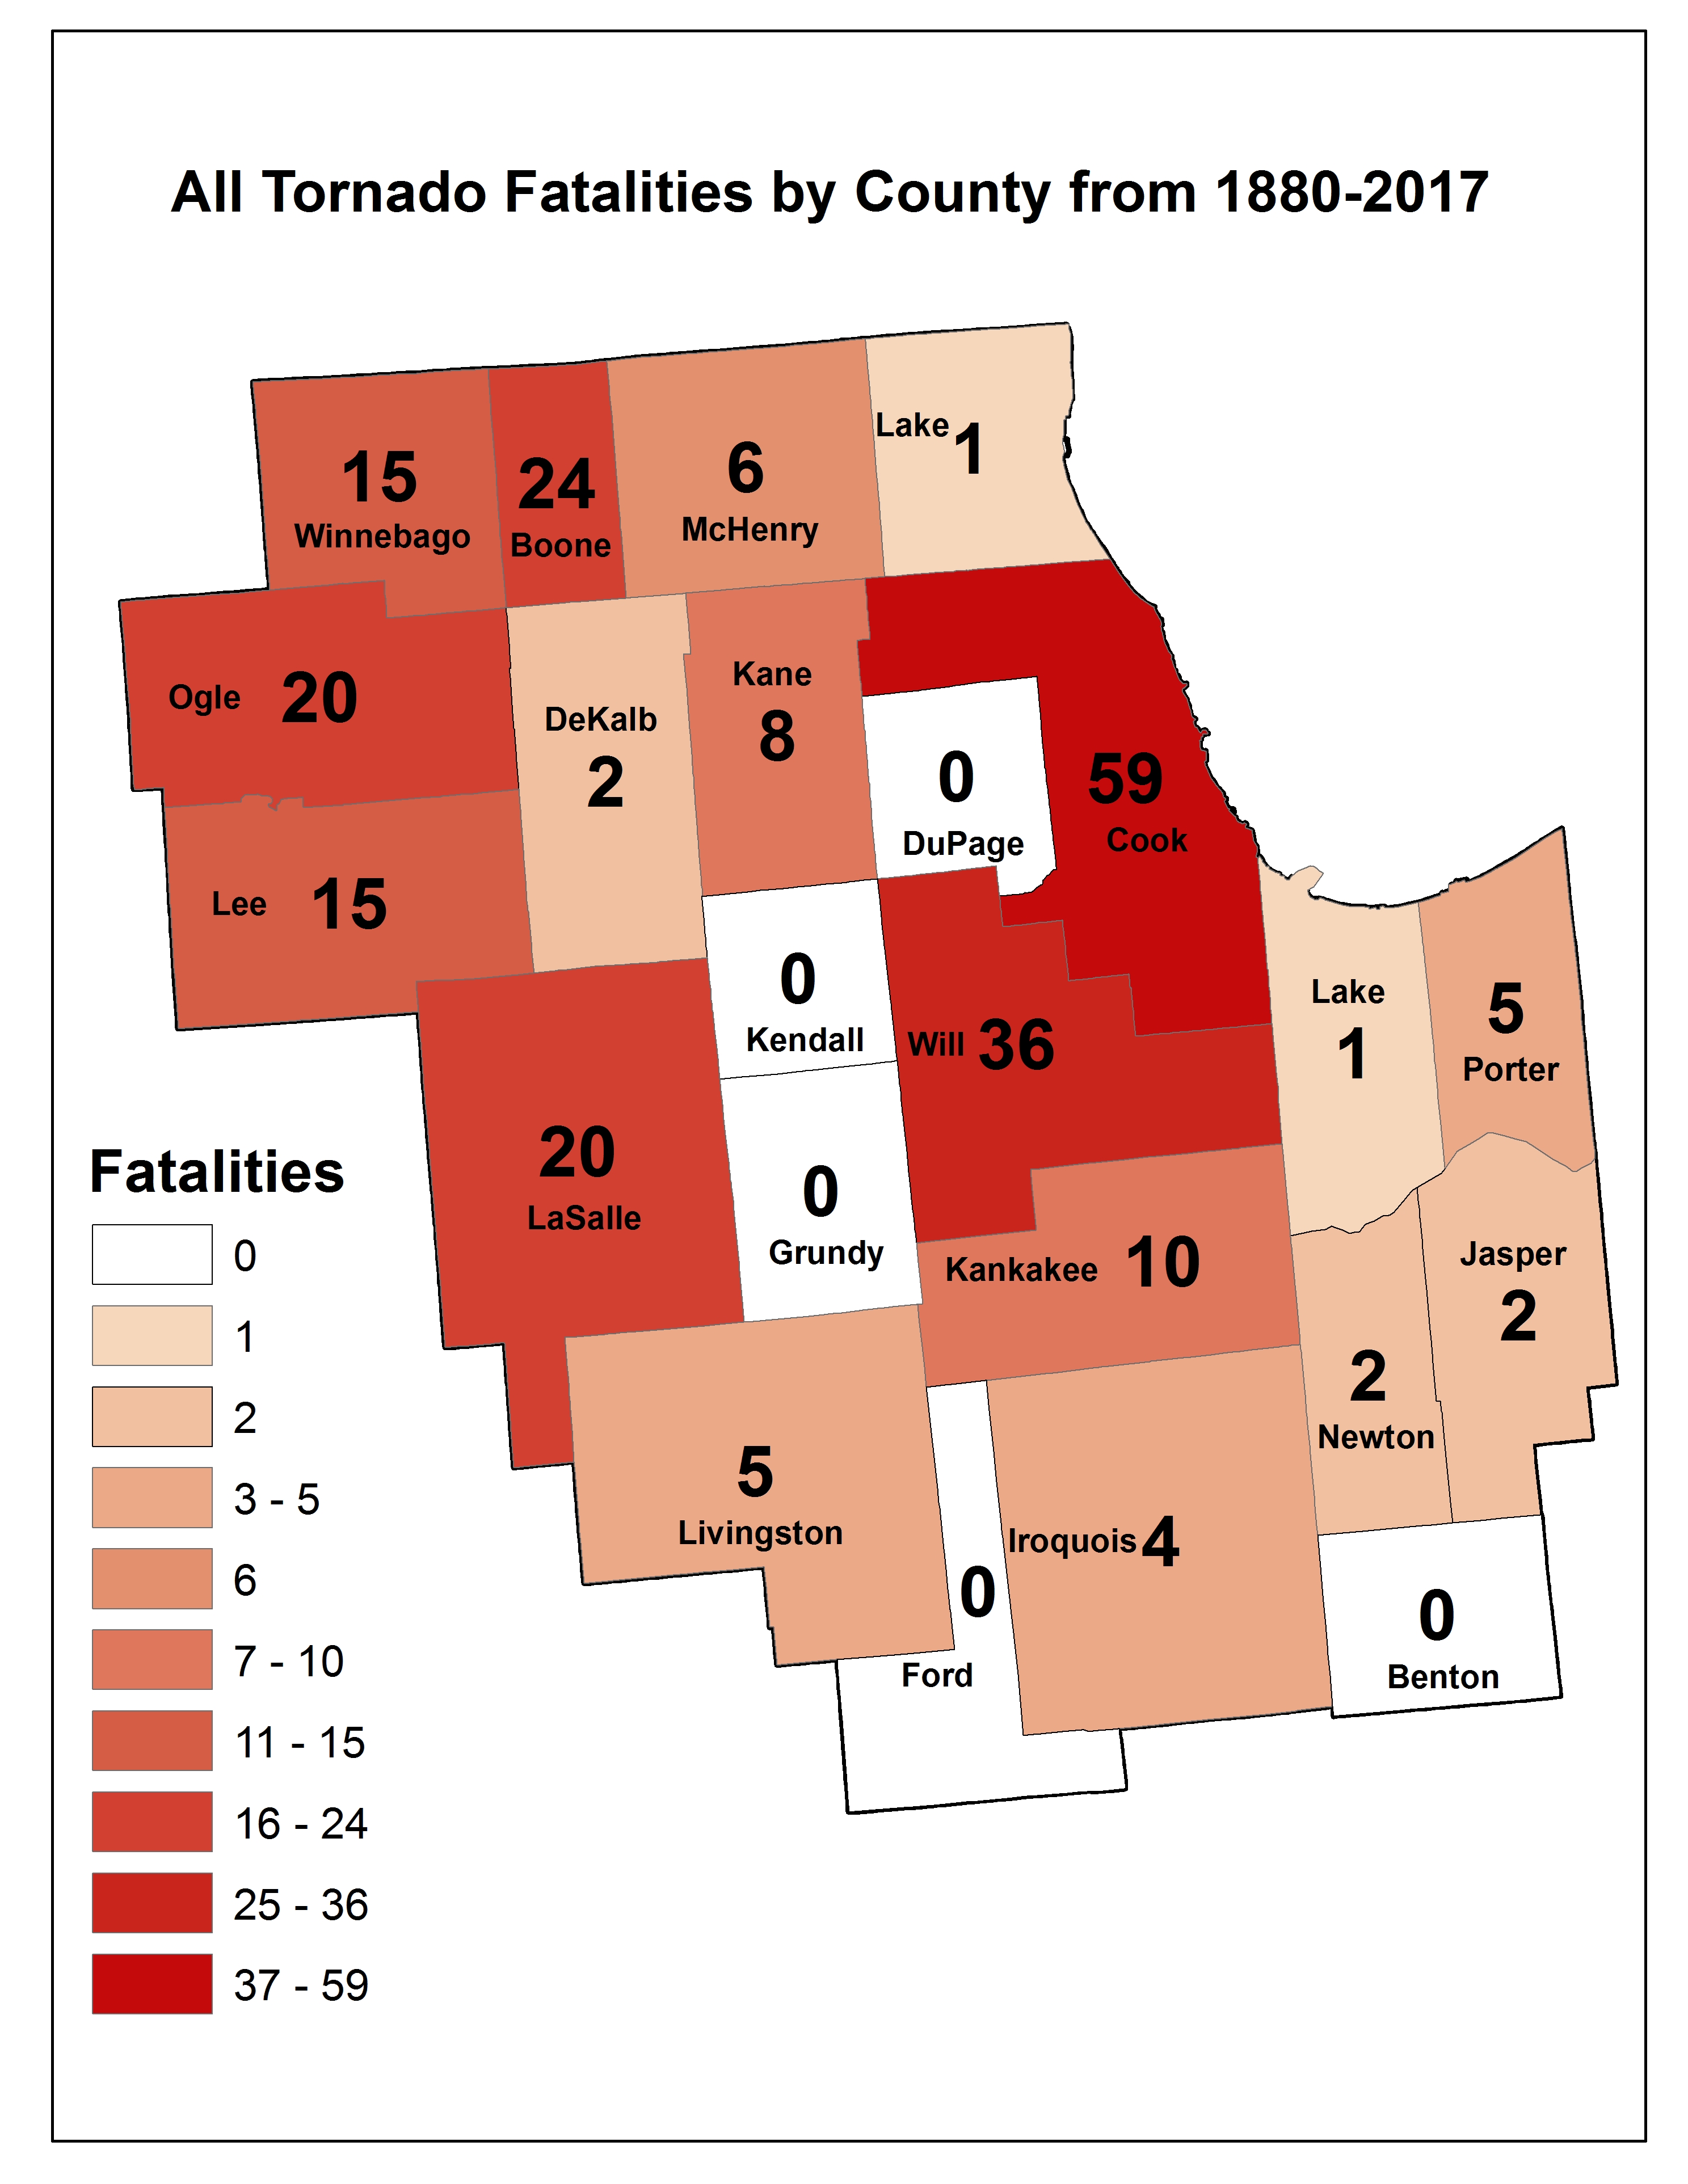
NWS Chicago CWA Annual Tornado Fatalities
1950 to 2014
|
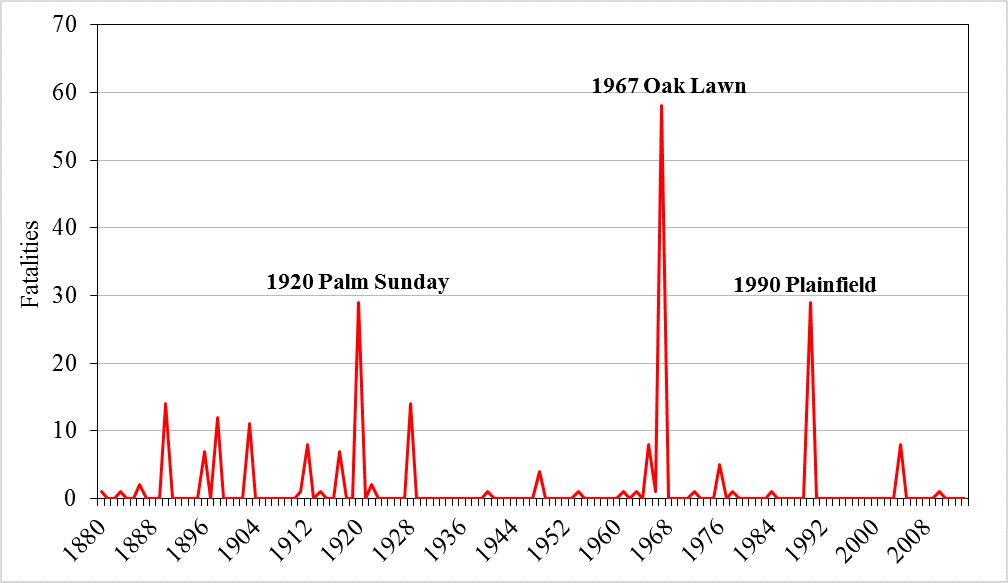 |
For tornado trends across the United States, visit here, and for significant tornado trends, see here.
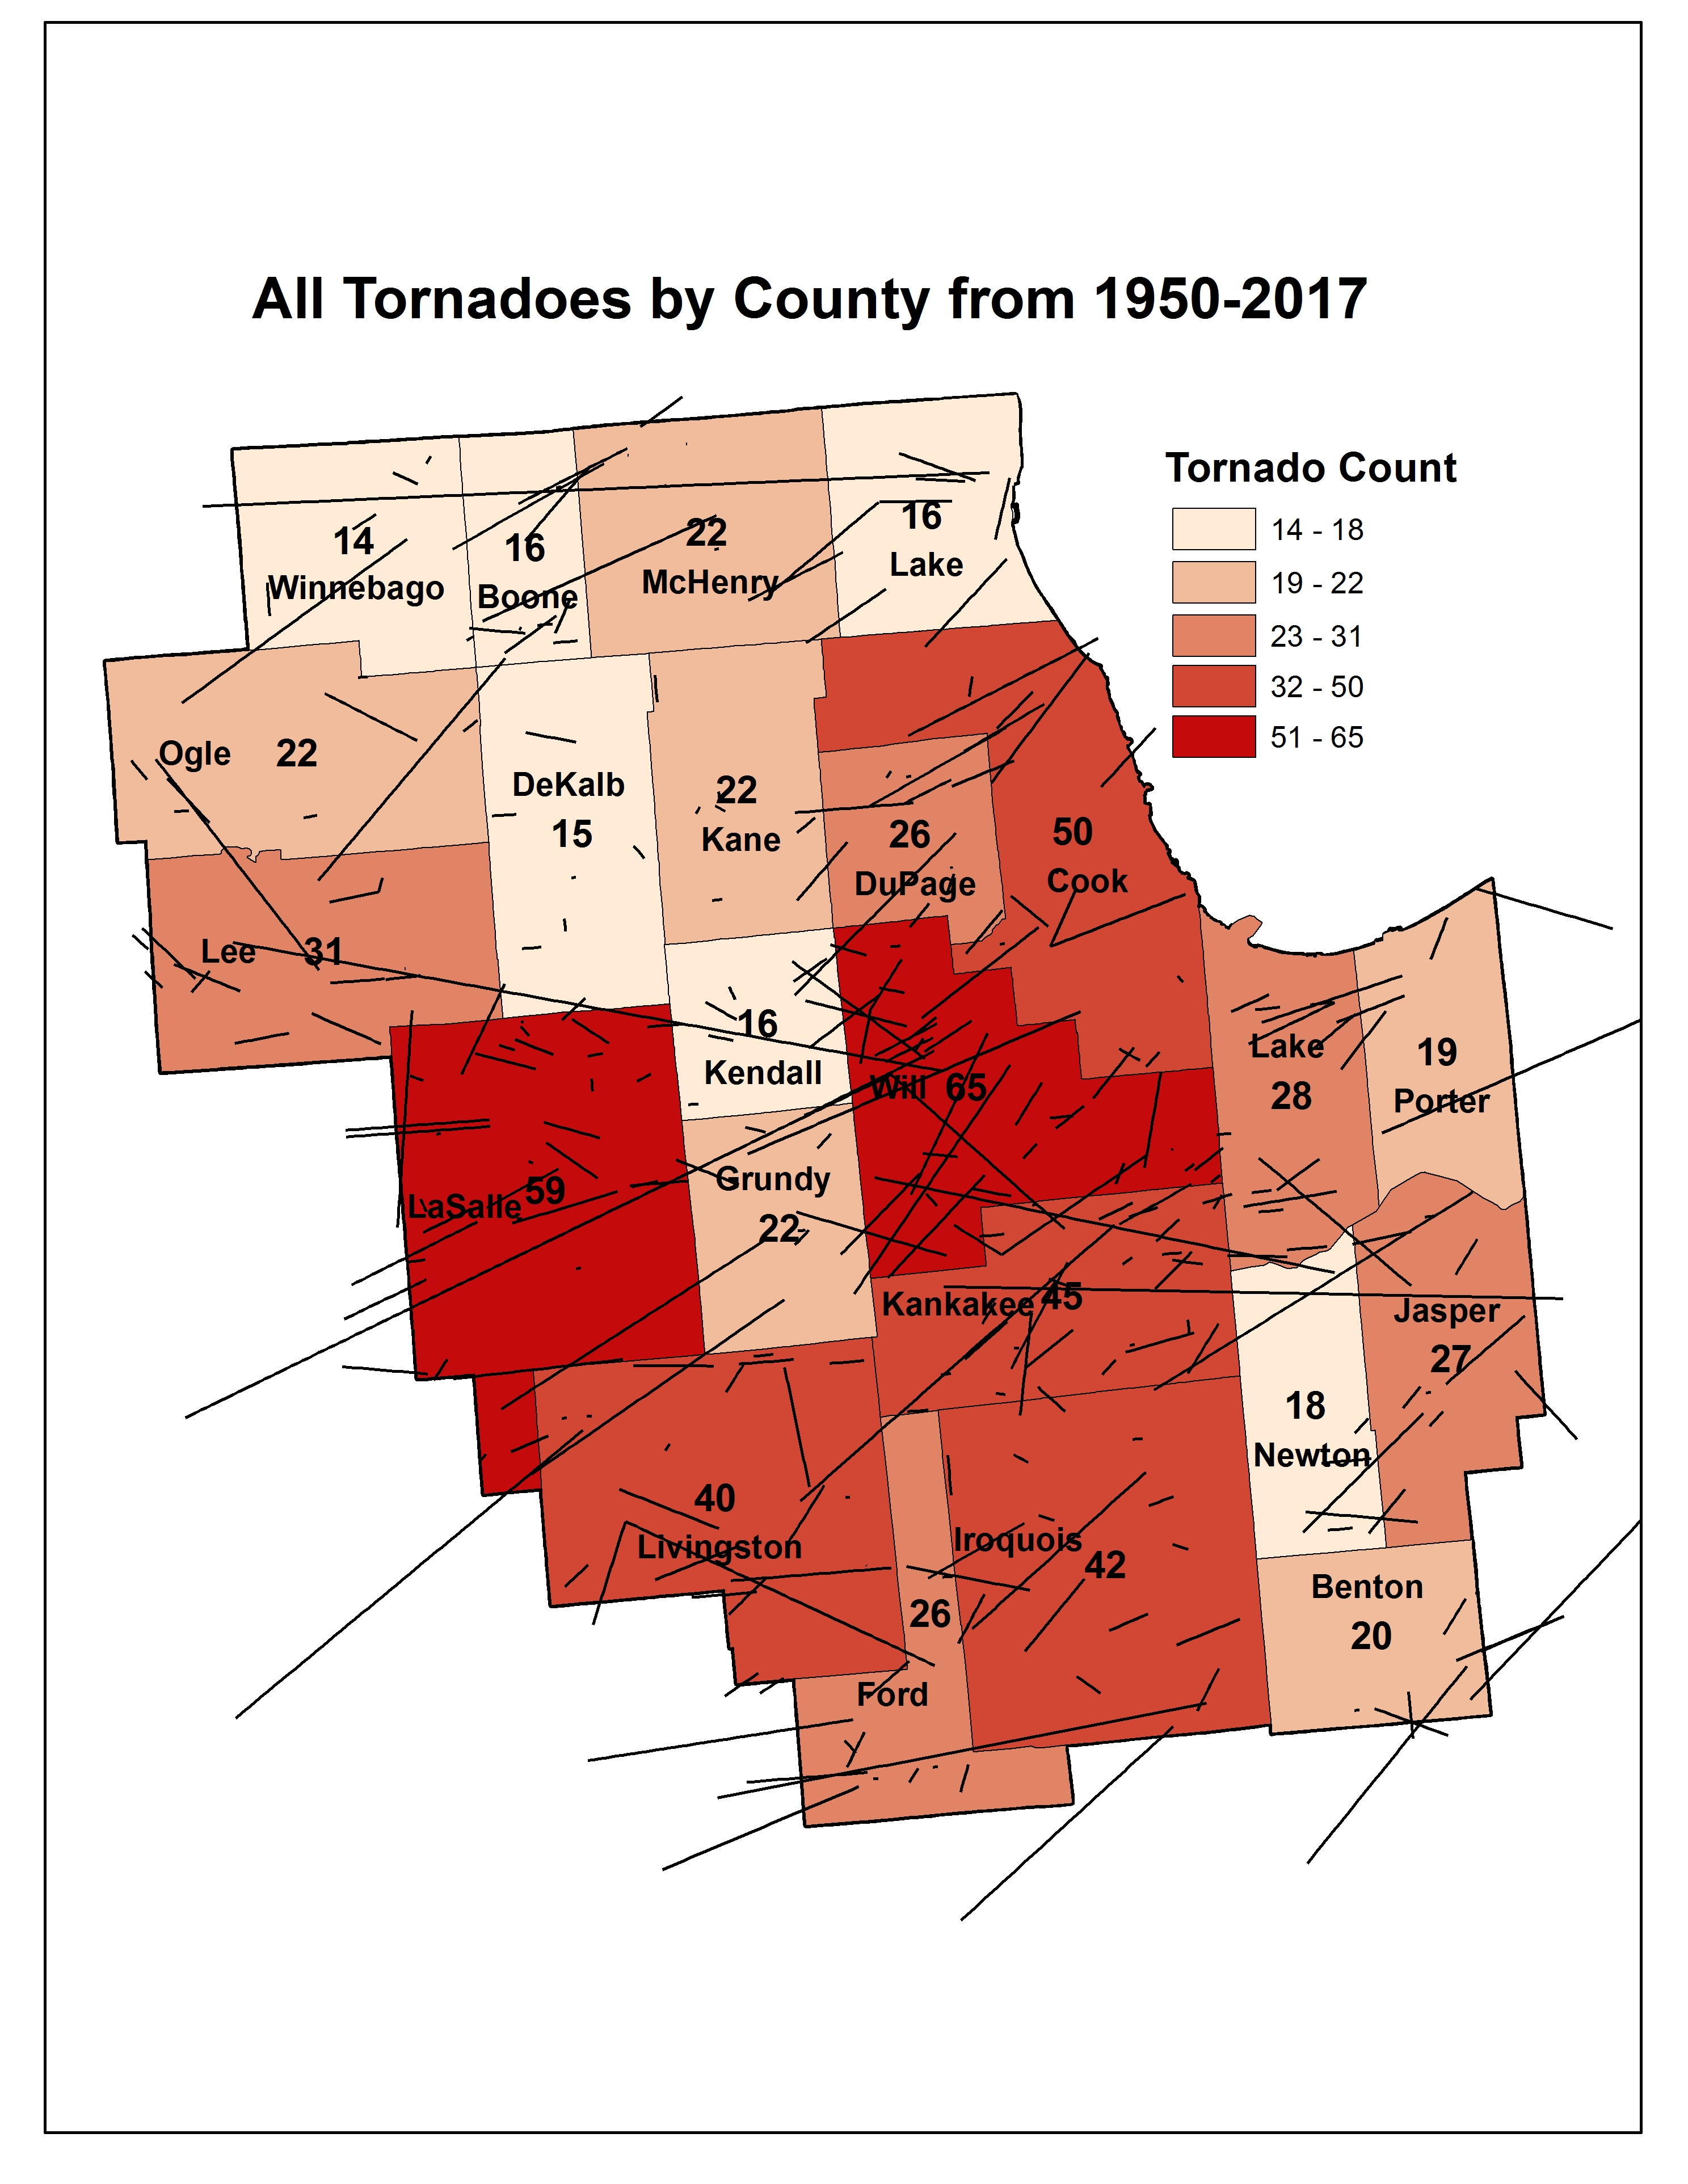
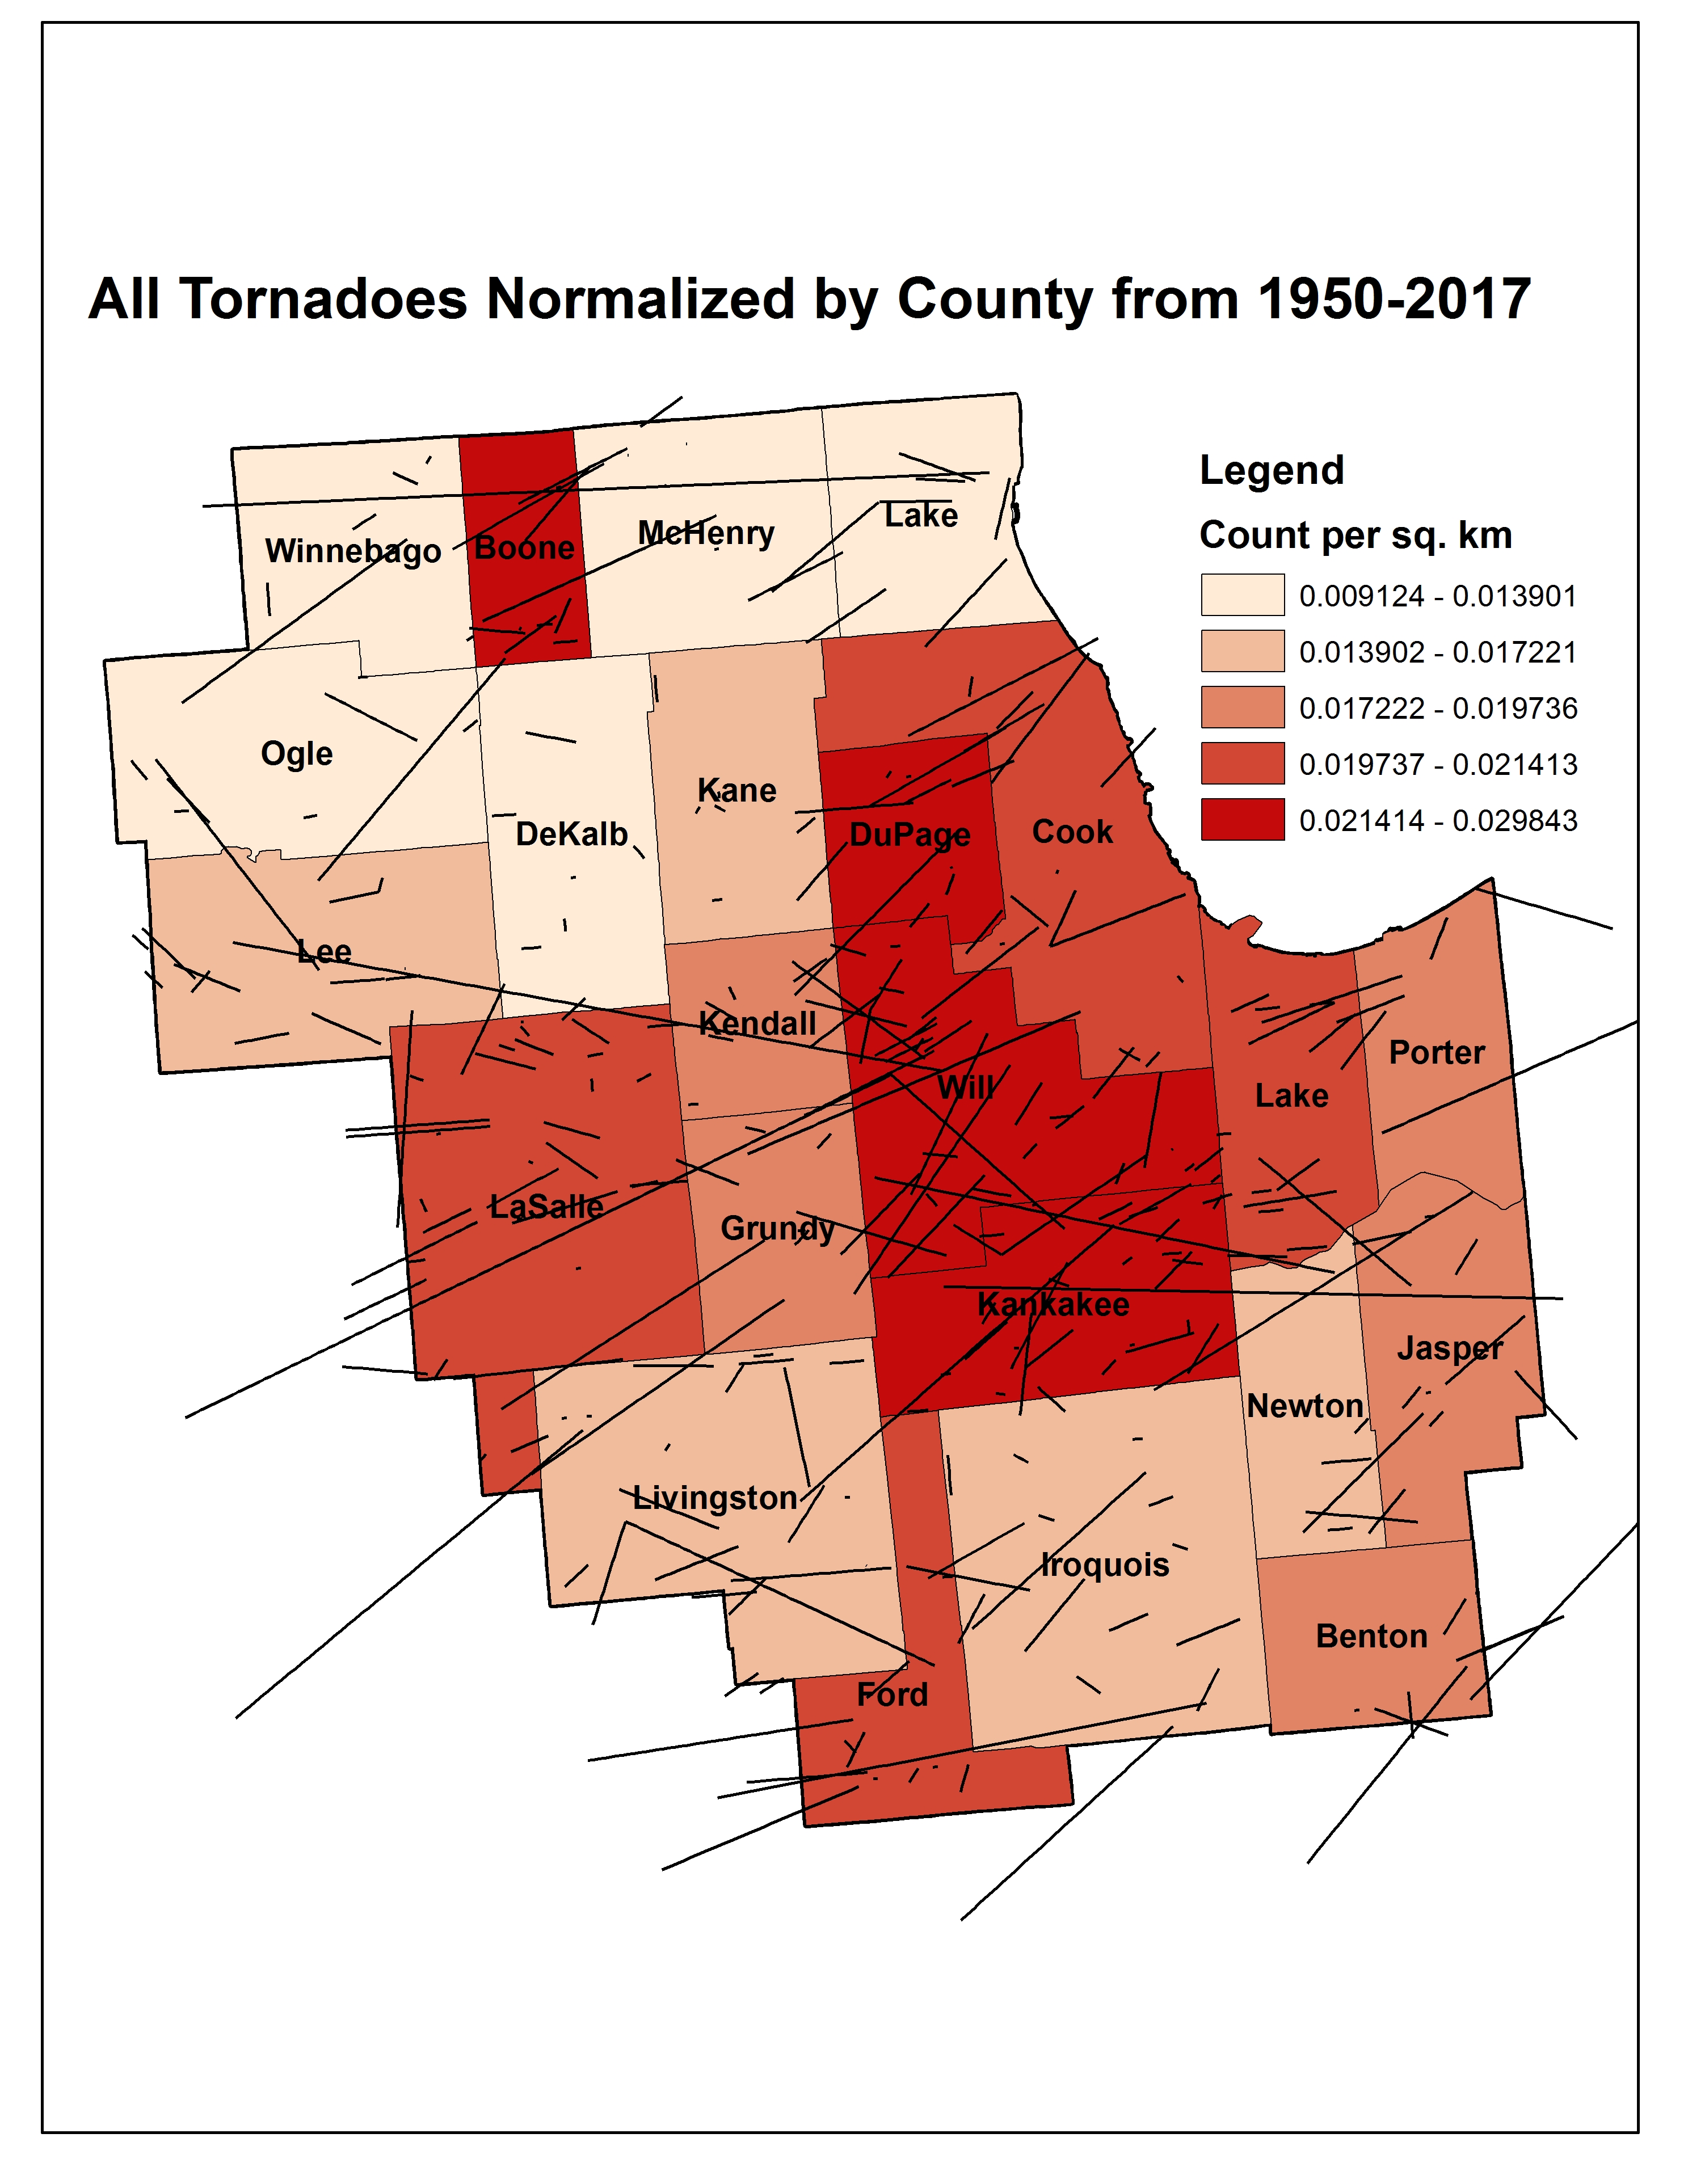
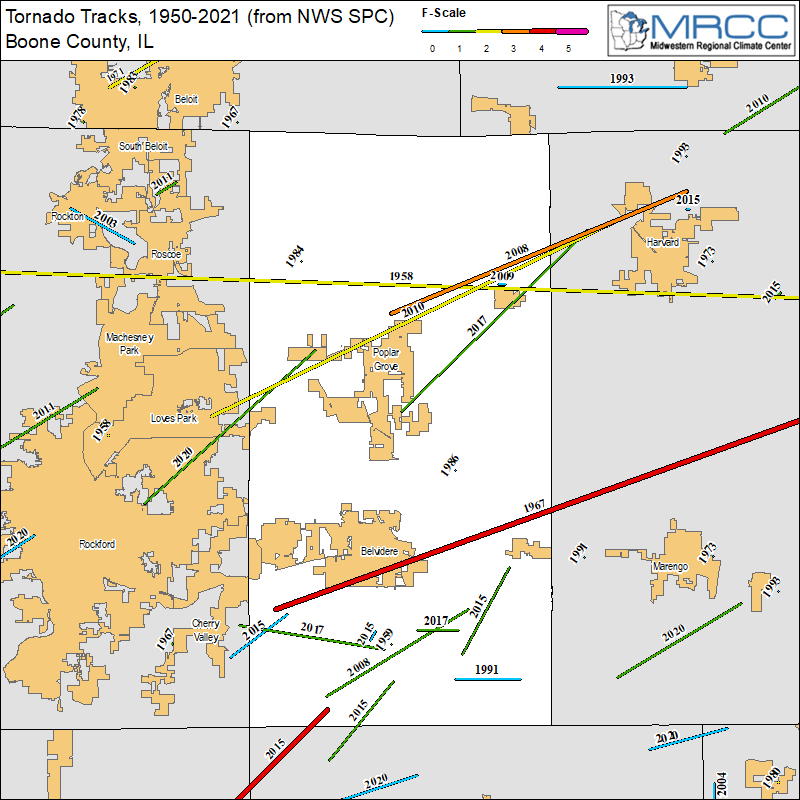
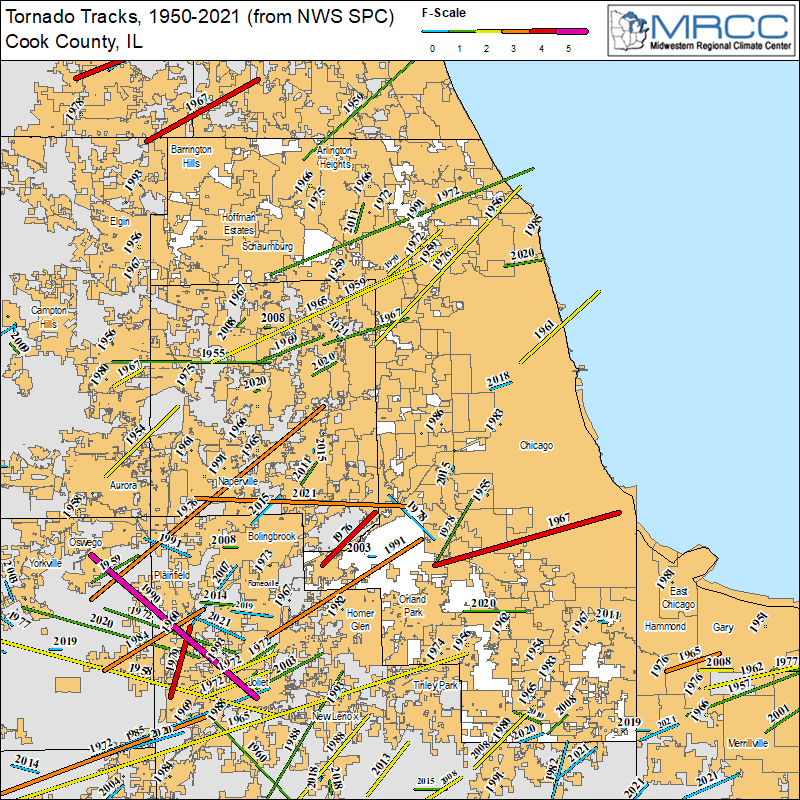
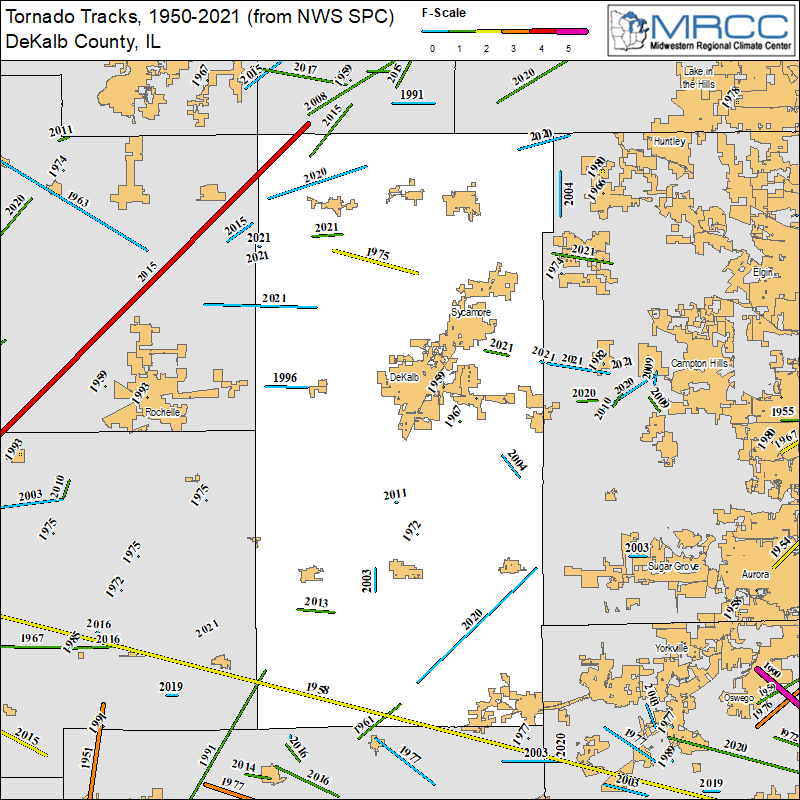
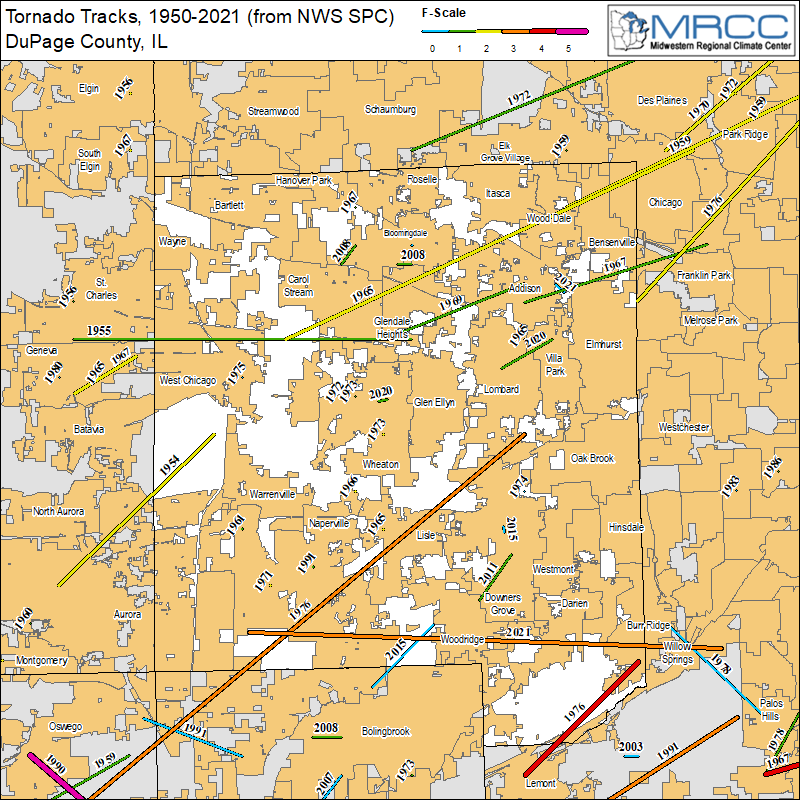
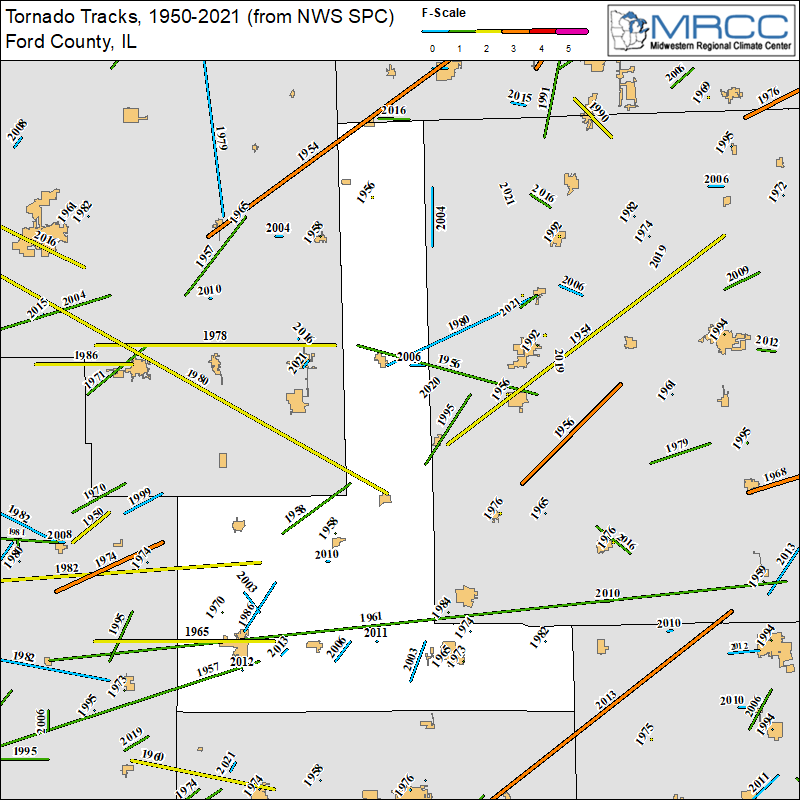
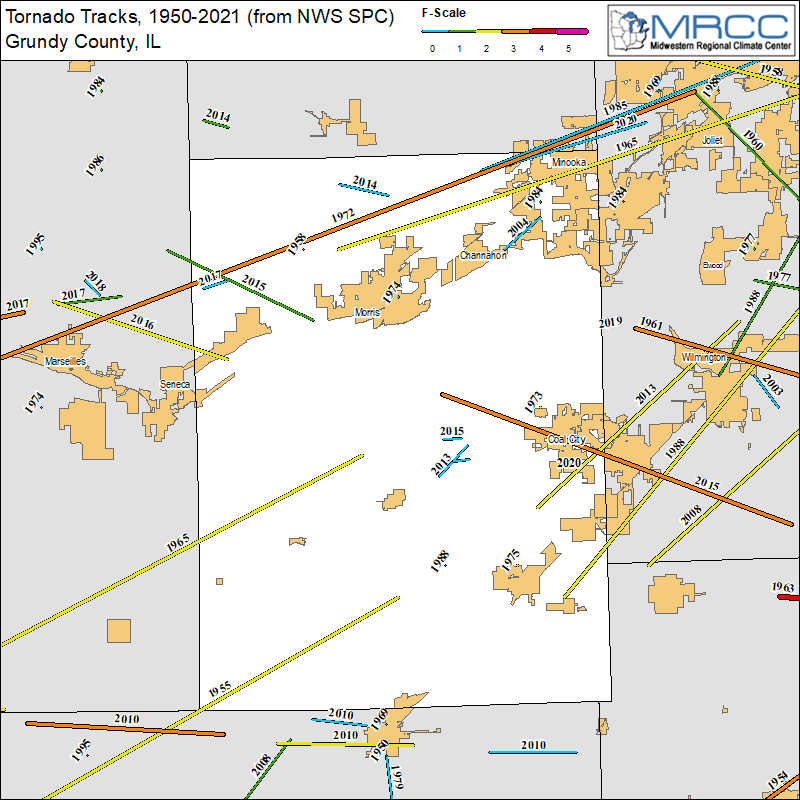
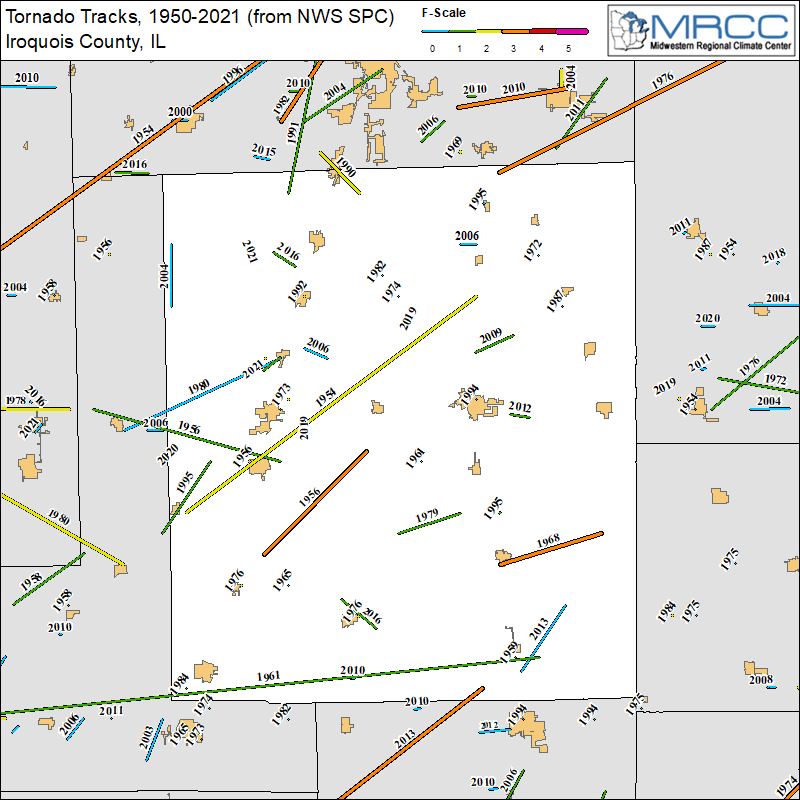
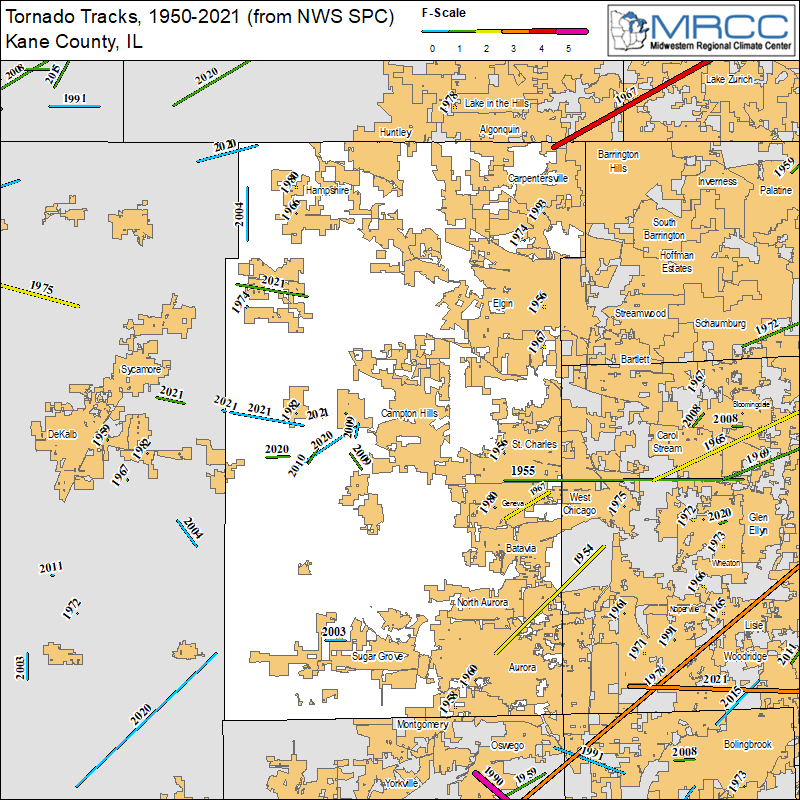
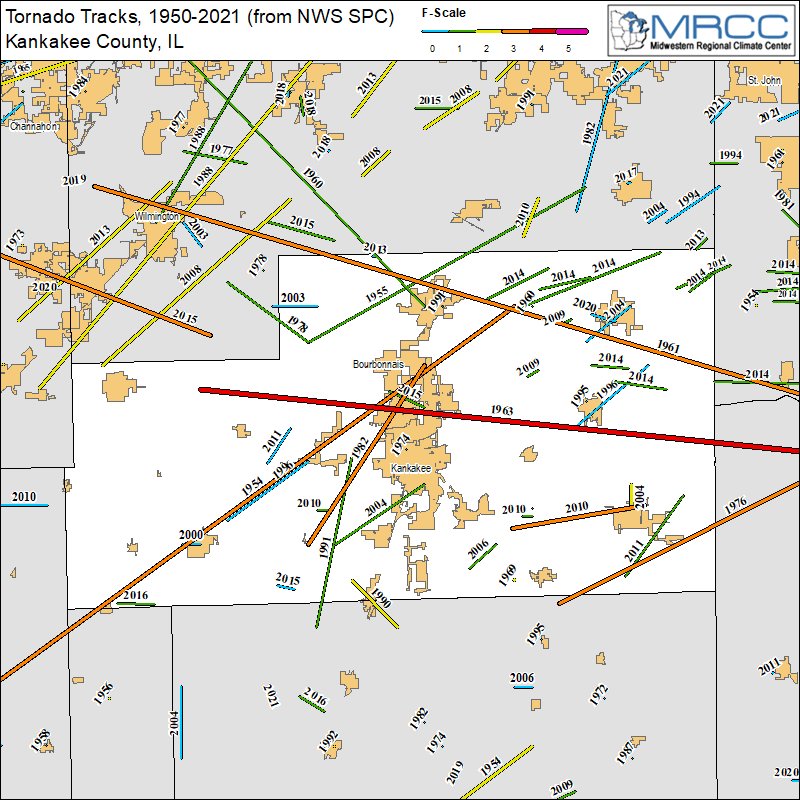
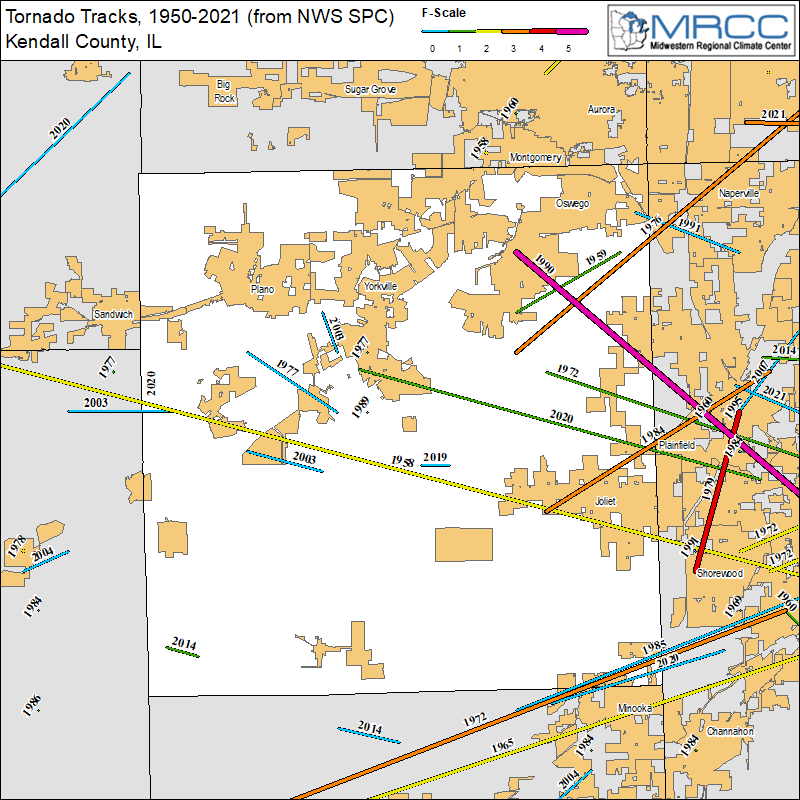
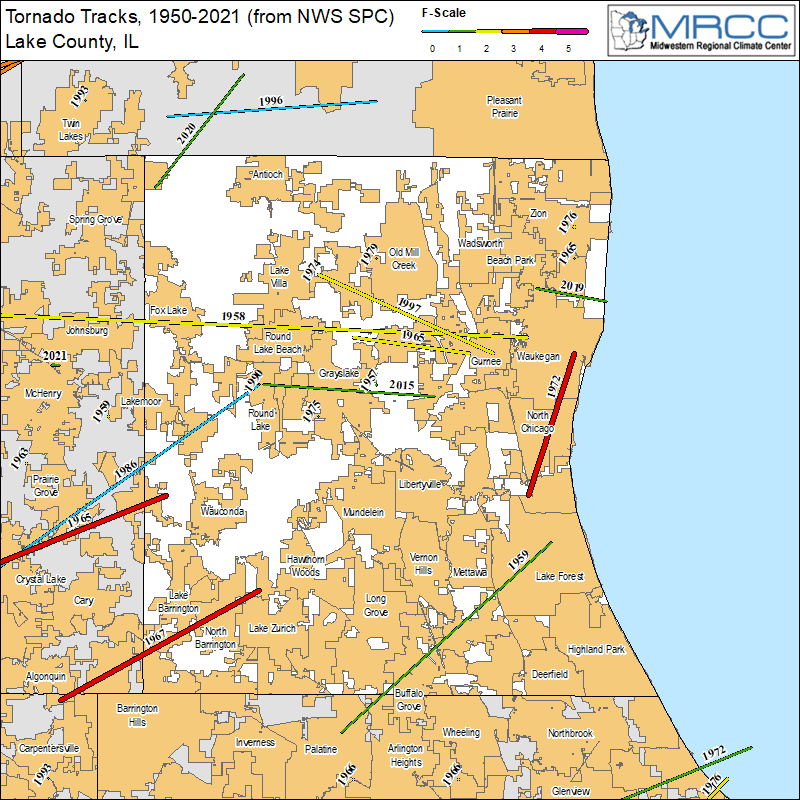
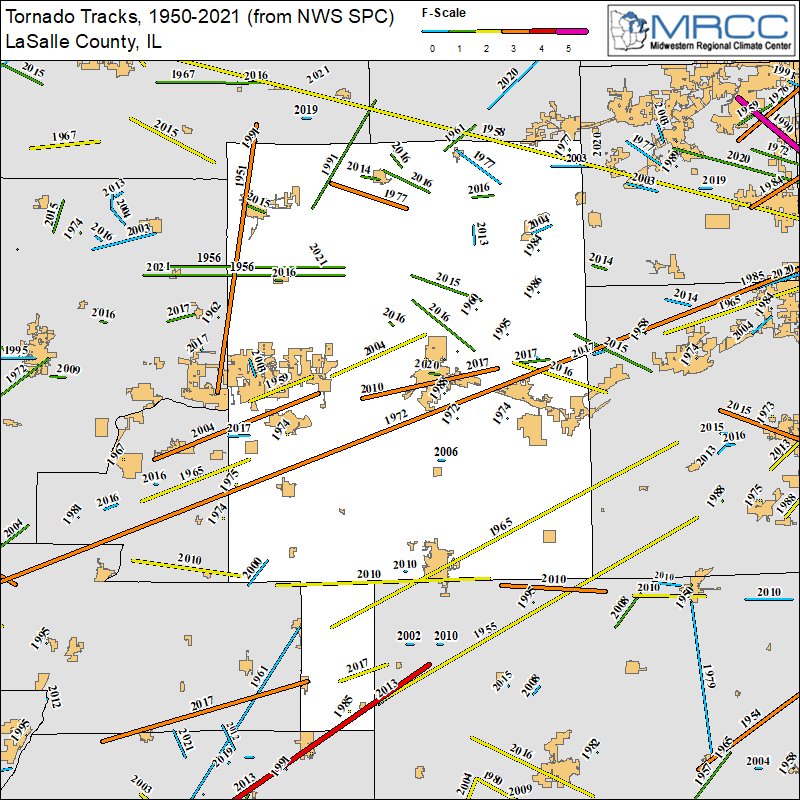
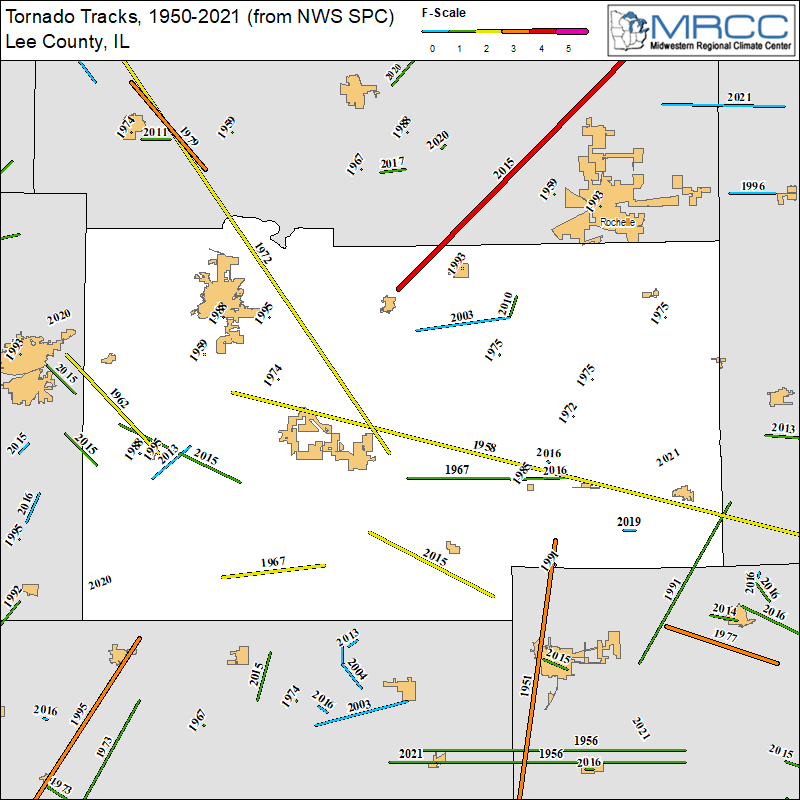
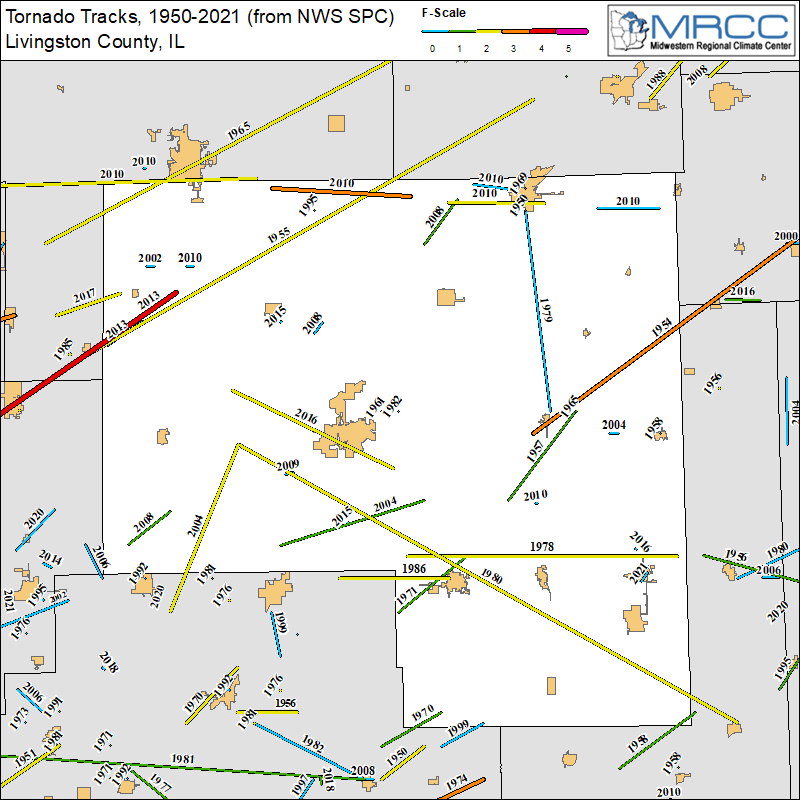
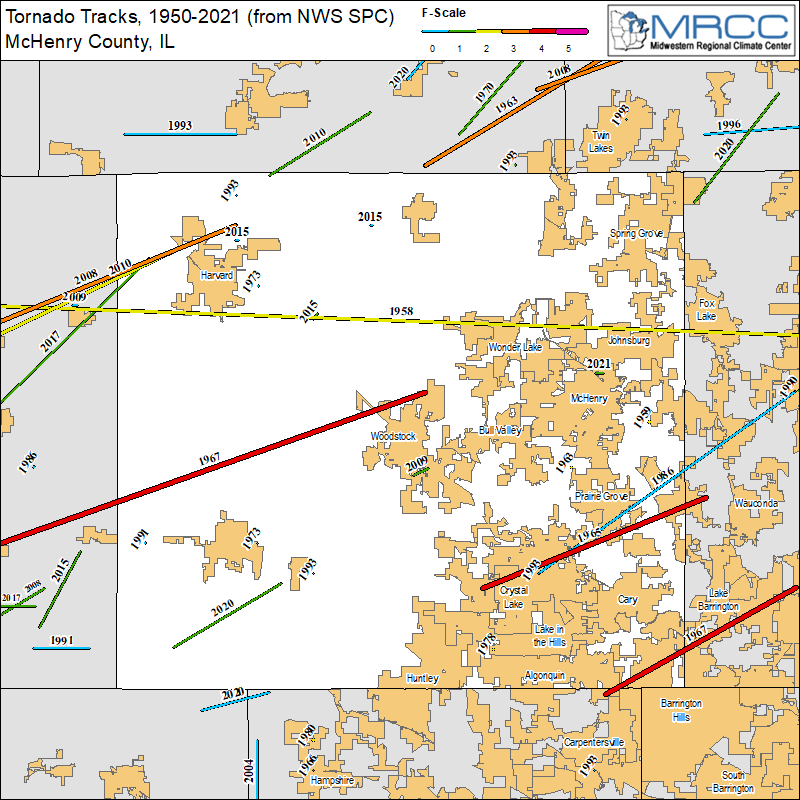
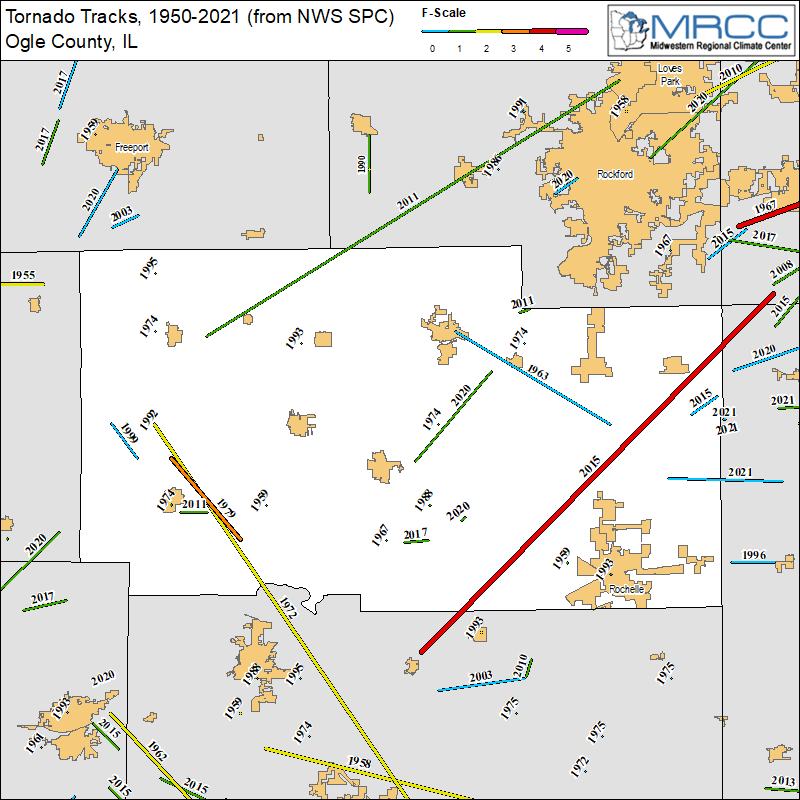
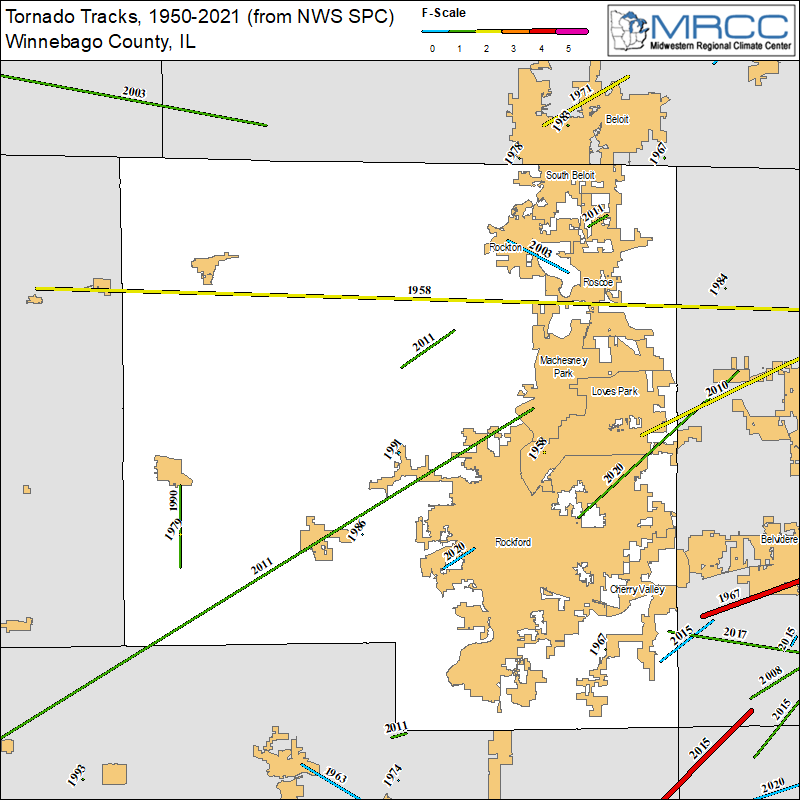
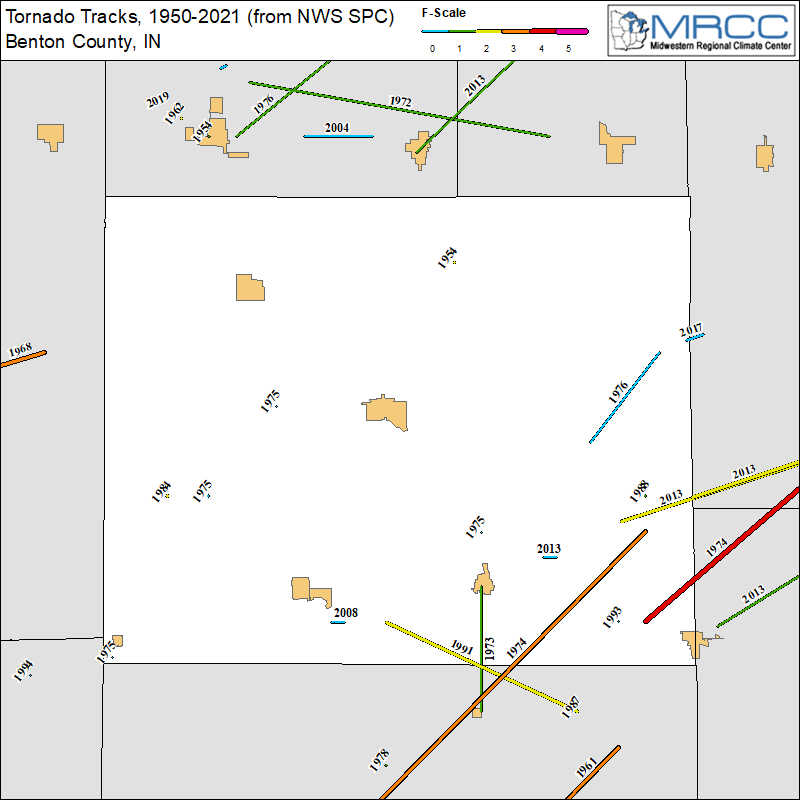
County Scale
For listings of the total number of tornadoes in Illinois by county from 1950-2019, see here. For the same but normalized by county area, see here. These numbers are courtesy of NWS Central Illinois.
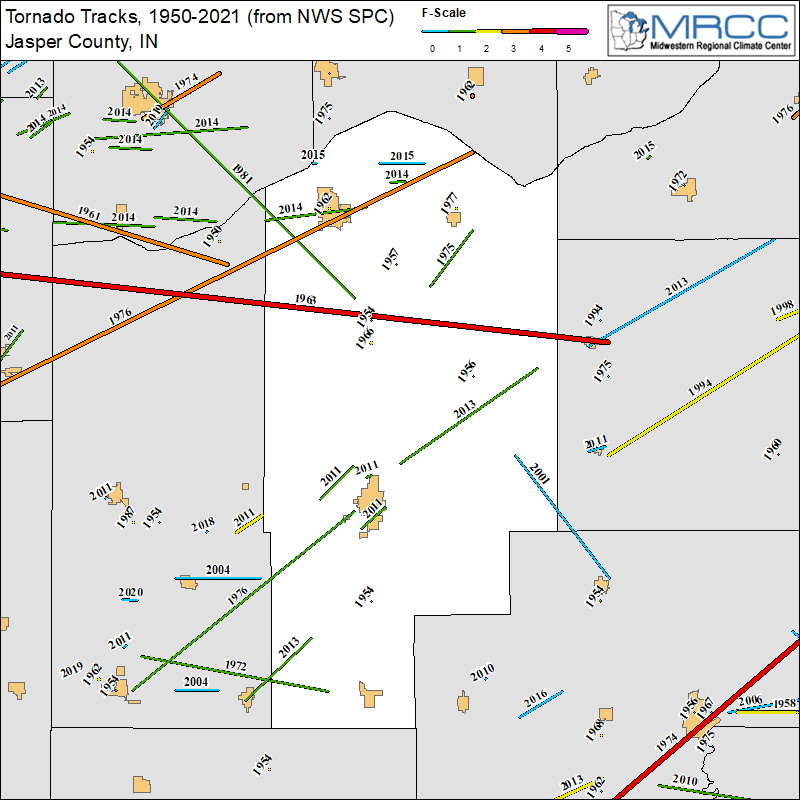
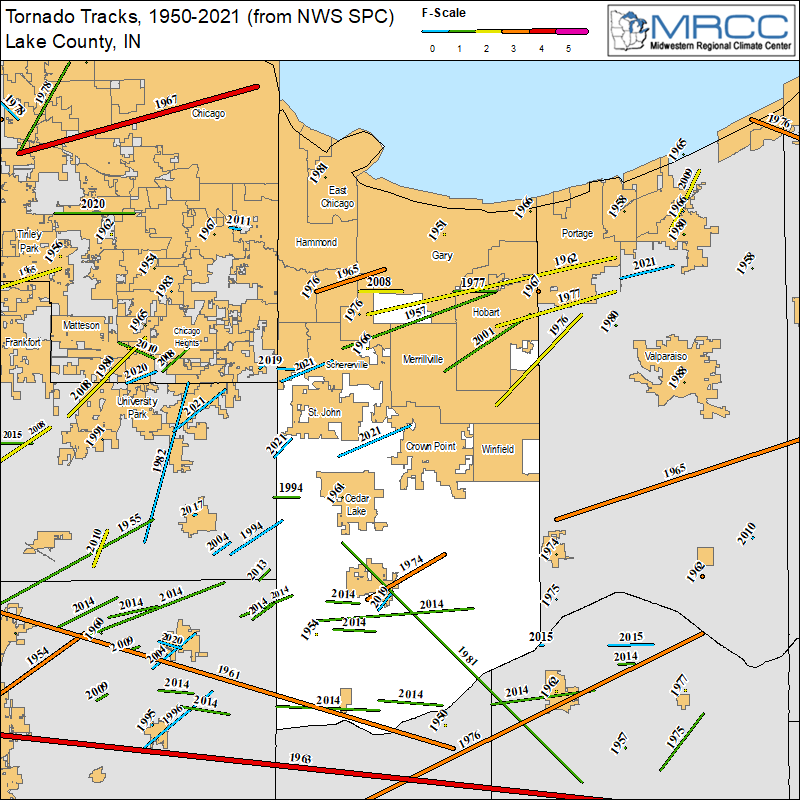
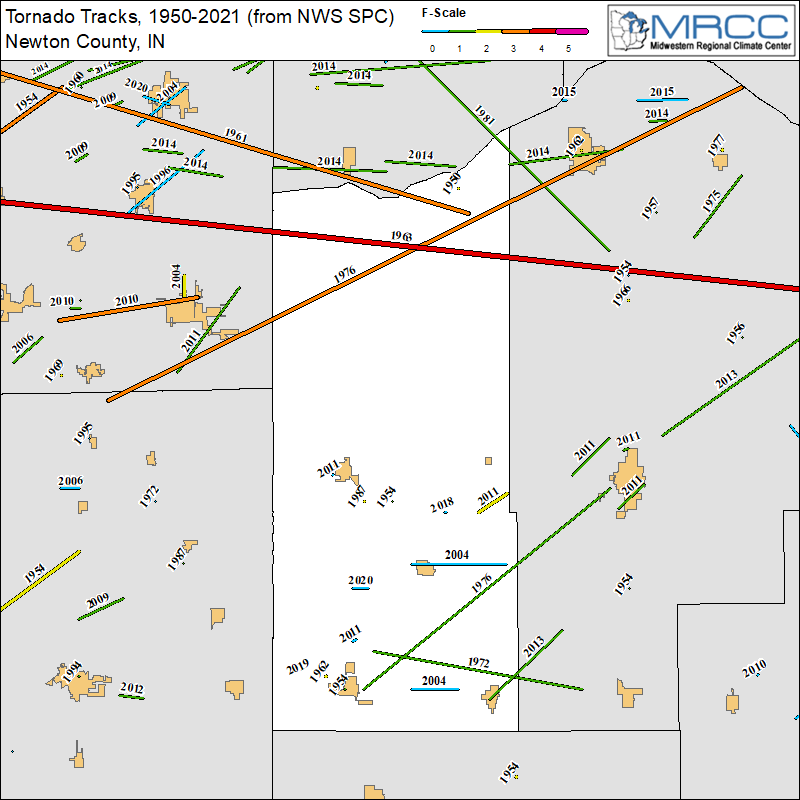
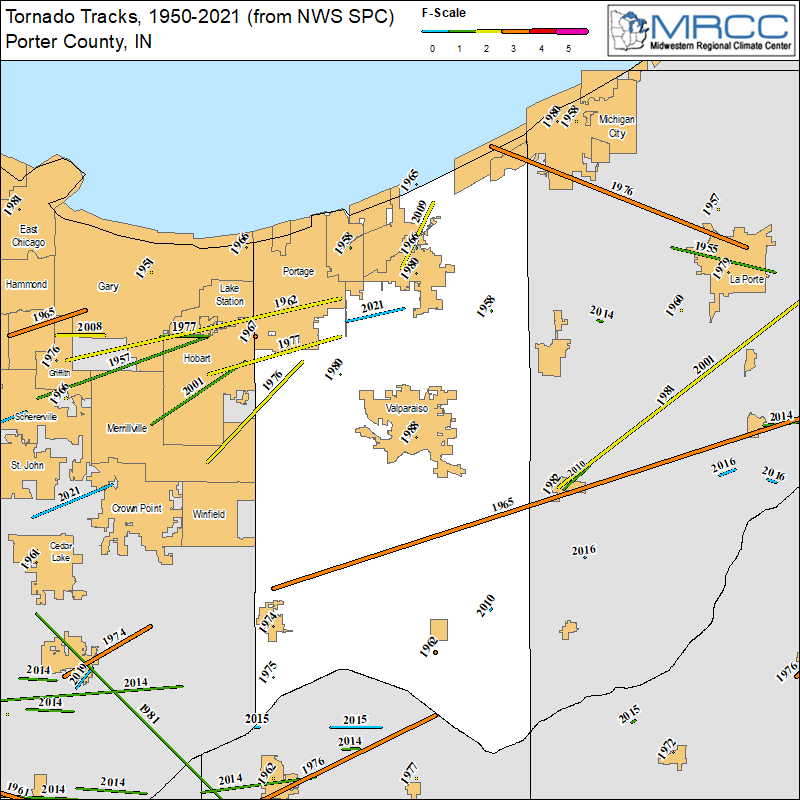
These maps are courtesy of the NOAA Midwestern Regional Climate Center (MRCC). An interactive tornado map from the MRCC is available here. Please note that these maps are created by the documented beginning and end points of the tornadoes. These plotted paths do not take into account the exact tornado tracks that often have subtle deviations. Thus these plotted paths are always straight lines. While these are really sound approximations of the historical tornado paths, they should not be considered exactly precise.
Illinois
| Boone | Cook | DeKalb | DuPage | Ford |
 |
 |
 |
 |
 |
| Grundy | Iroquois | Kane | Kankakee | Kendall |
 |
 |
 |
 |
 |
| Lake | LaSalle | Lee | Livingston | McHenry |
 |
 |
 |
 |
 |
| Ogle | Winnebago | Will |
 |
 |
 |
Indiana
| Benton | Jasper | Lake | Newton | Porter |
 |
 |
 |
 |
 |
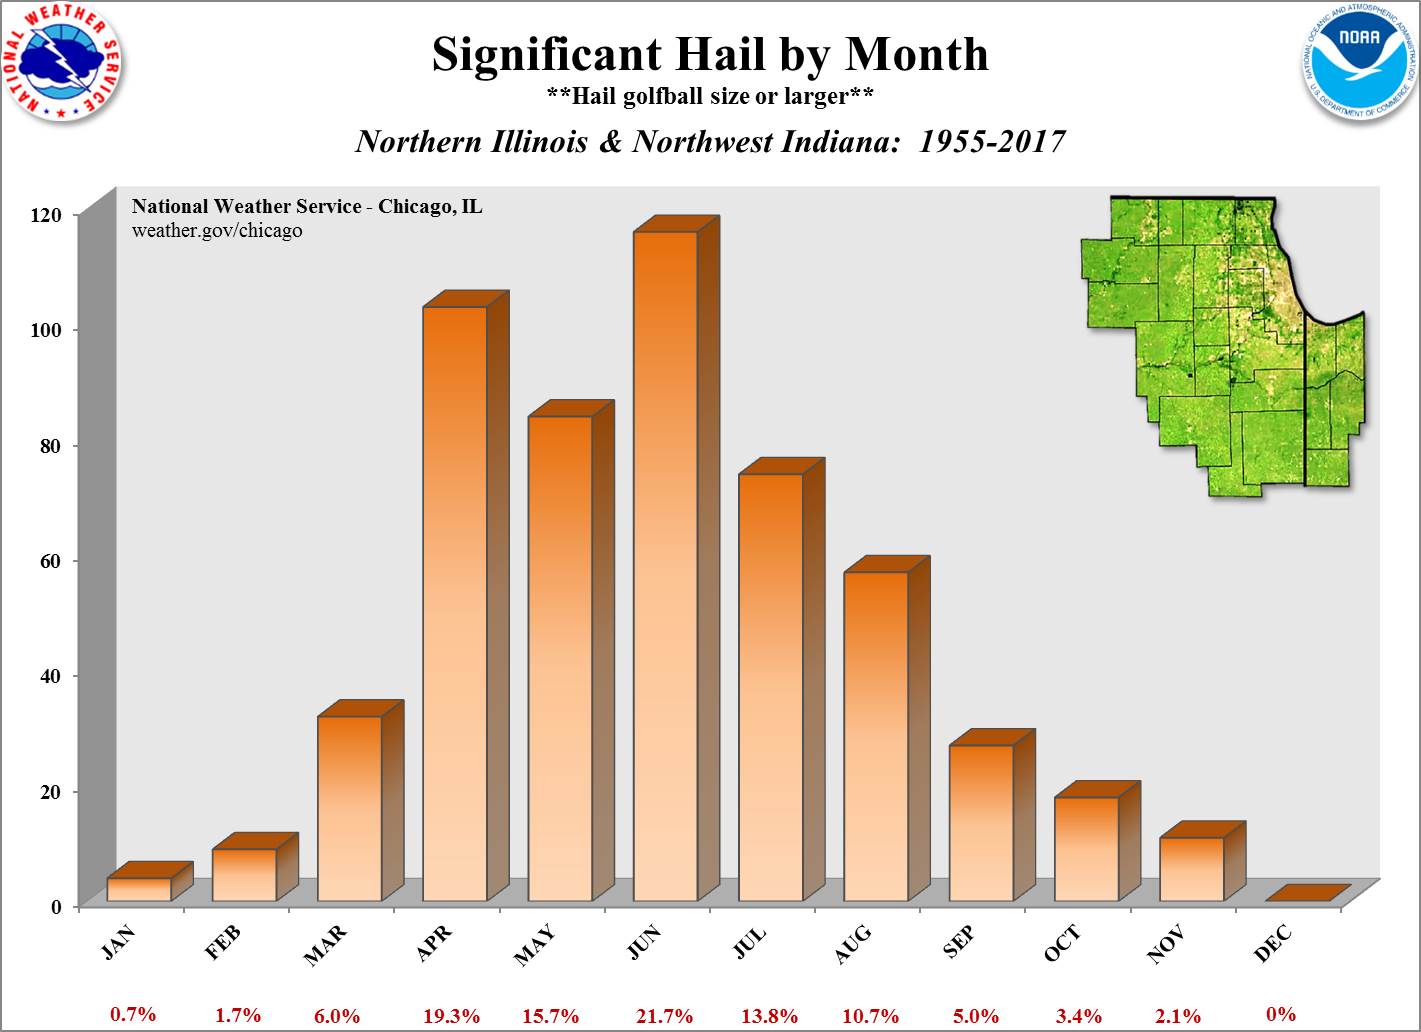
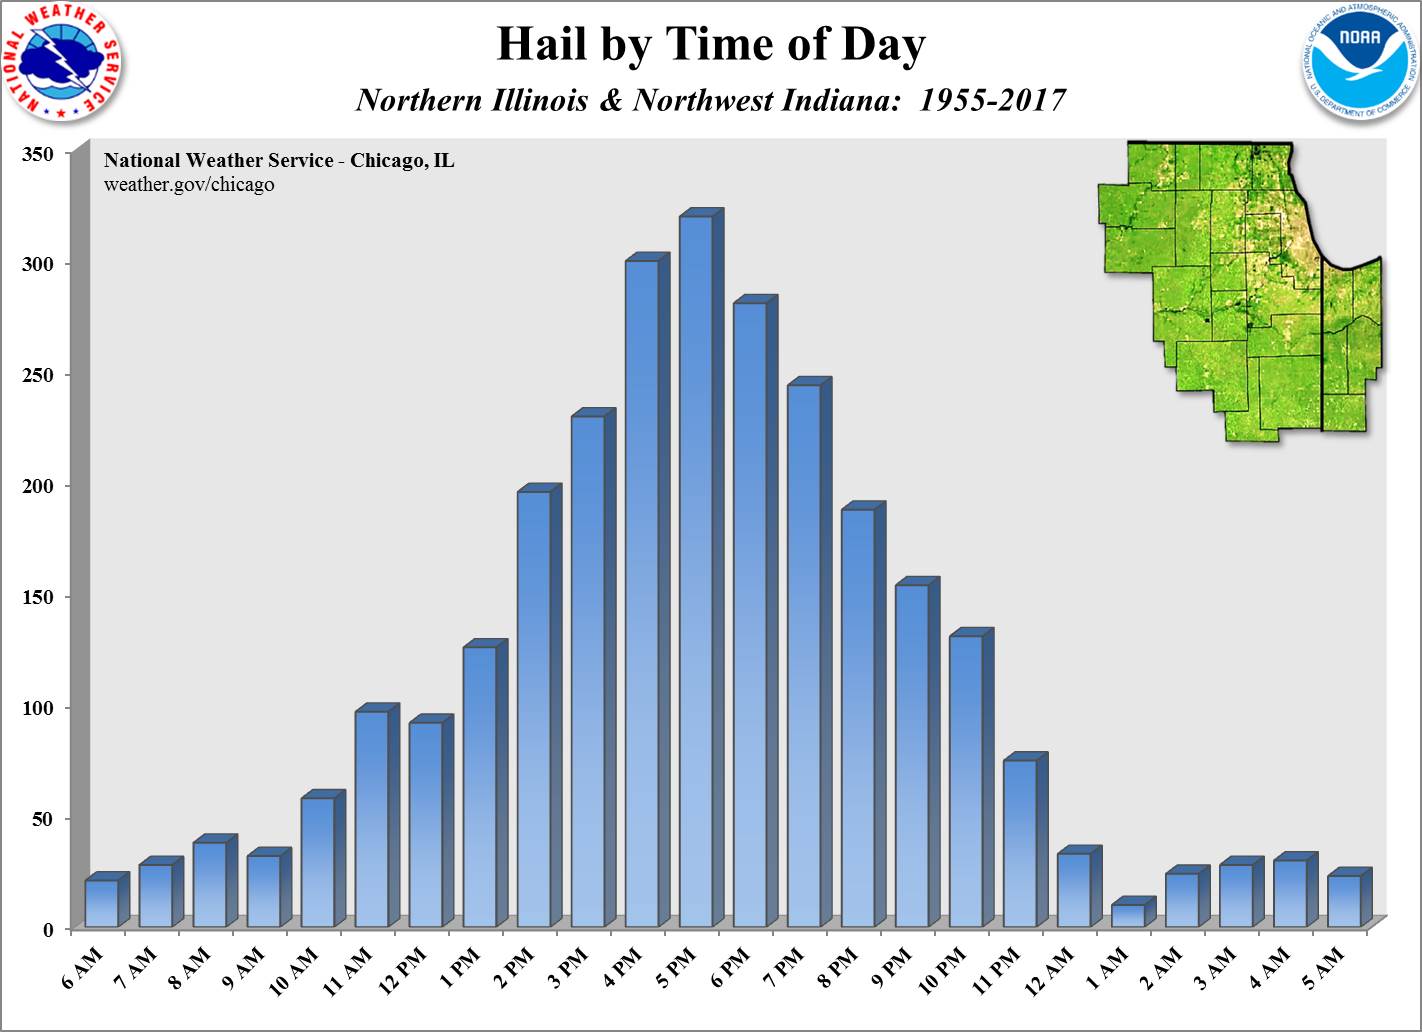
Severe Hail Climatology in Northern Illinois & Northwest Indiana
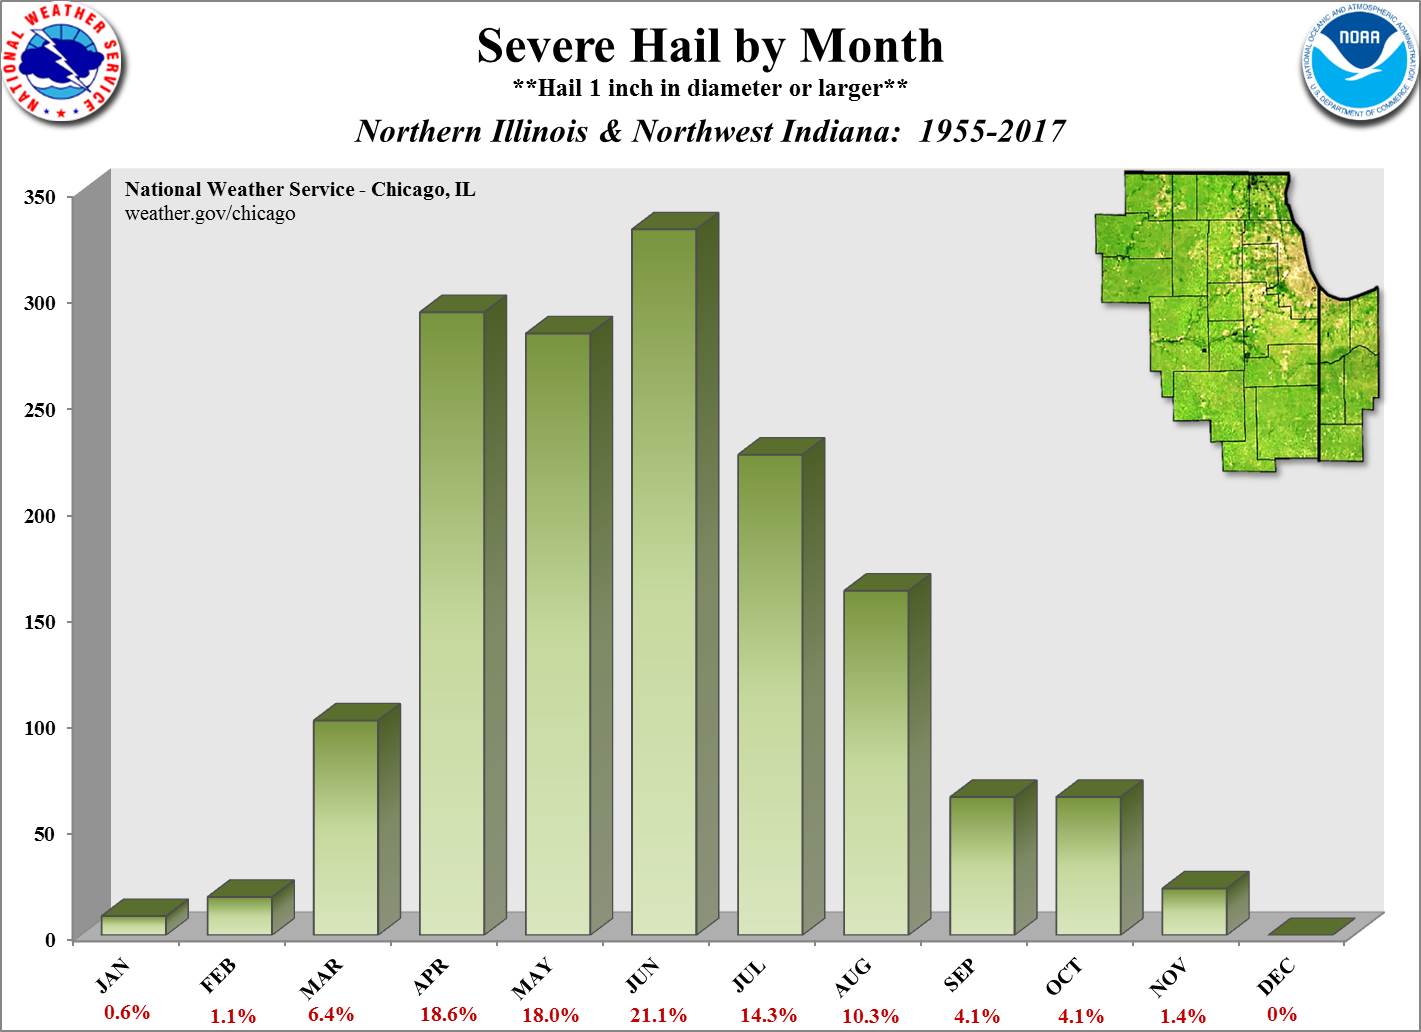
For a 15-day running mean graph of hail of any size across the local area, see here.
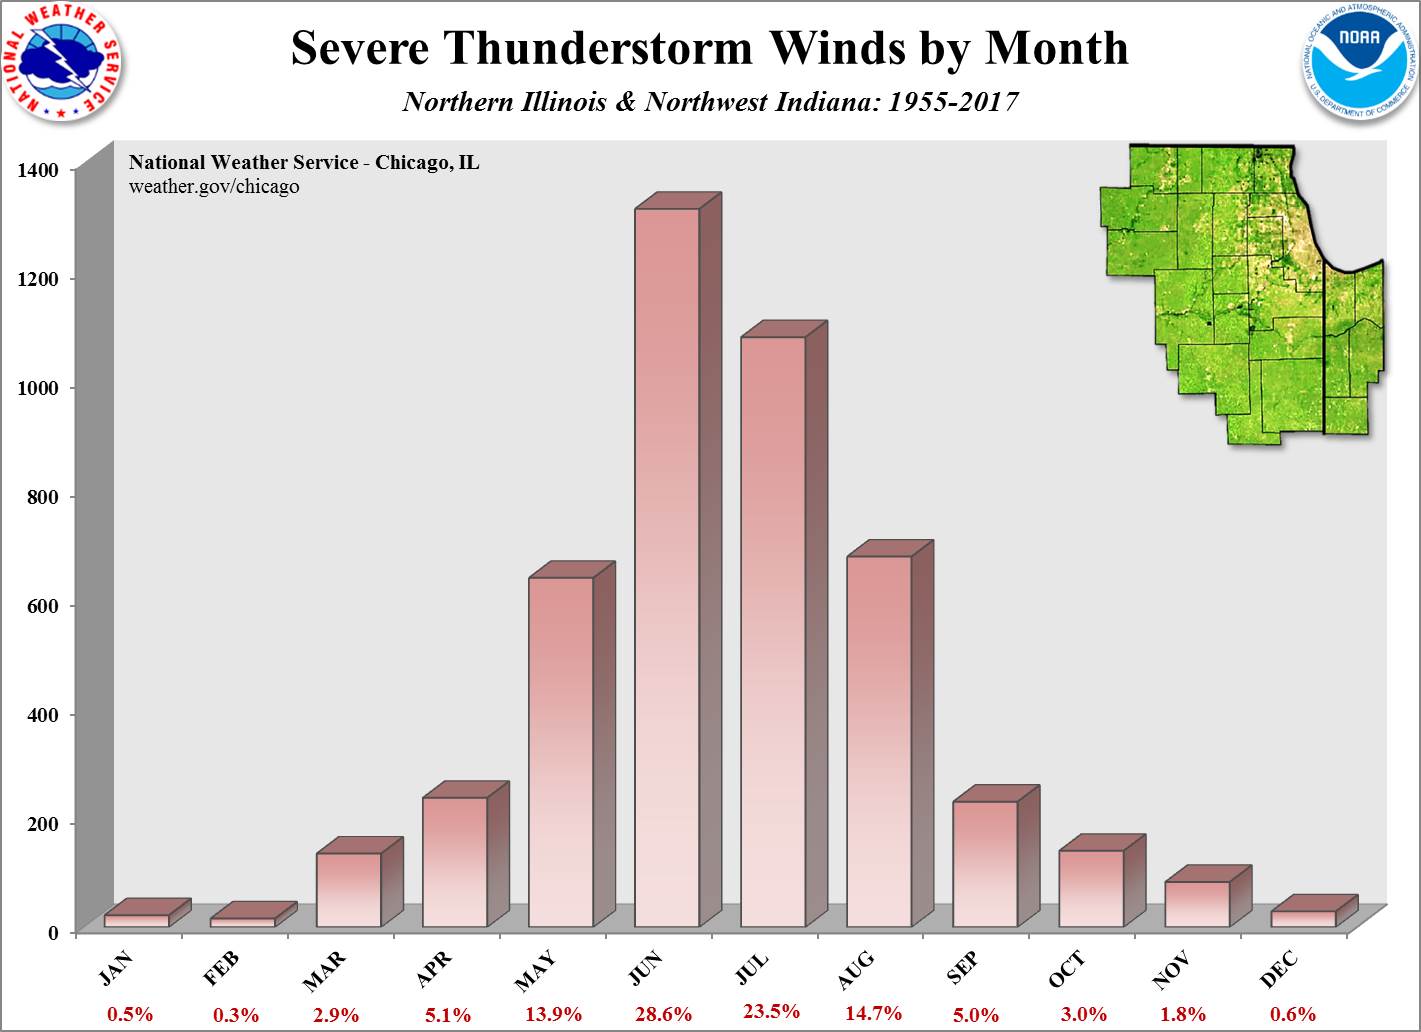
Severe Wind Climatology in Northern Illinois & Northwest Indiana
More Tornado and Severe Weather Information
Individual Tornadoes
Other Local Severe Weather & Tornado Information
Regional Tornado Climatology
National Tornado Databases and Info
Severe Weather & Tornado Preparedness
Lightning Climatology