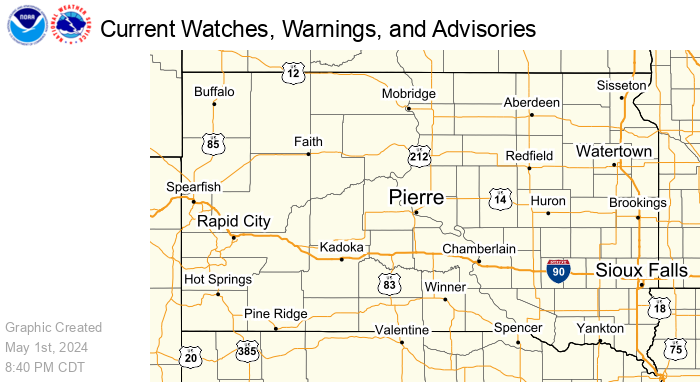
Interactive Hazard Map and Regional Radar
To view hazards legend: Stop the loop, step to the end, and use the alerts drop-down. View full radar page here.
Click here for a static hazards map.
Briefings
These show only if there are active briefings.
Rapid City
Aberdeen
Sioux Falls
Local Storm Reports


River Flooding
Open in New Tab
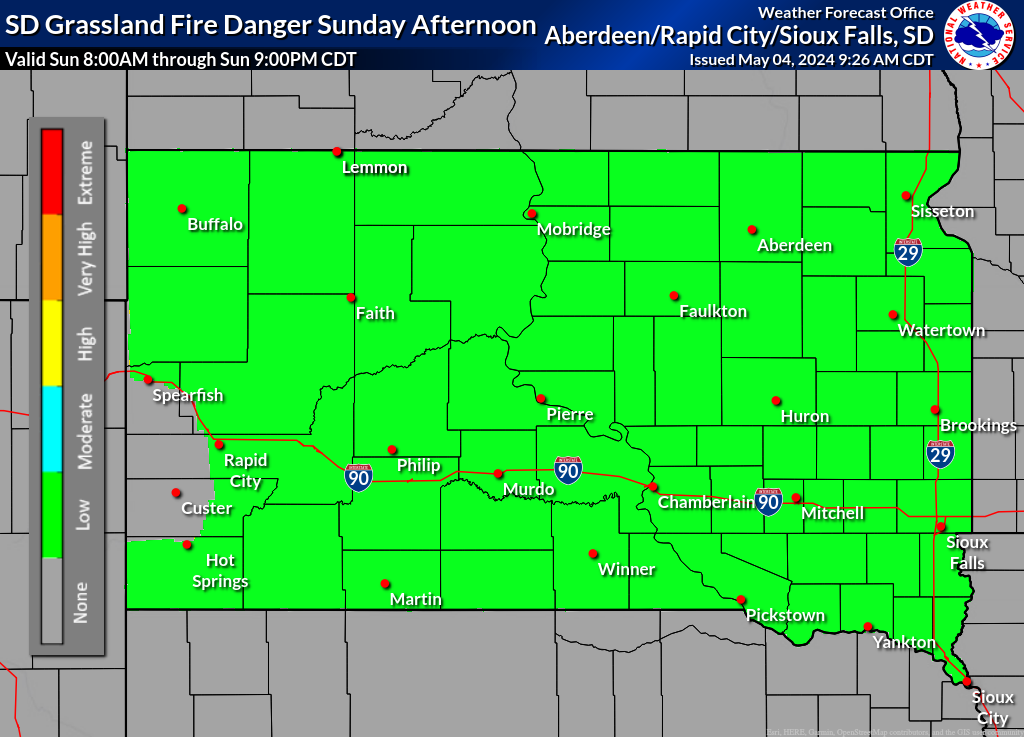
Grassland Fire Danger
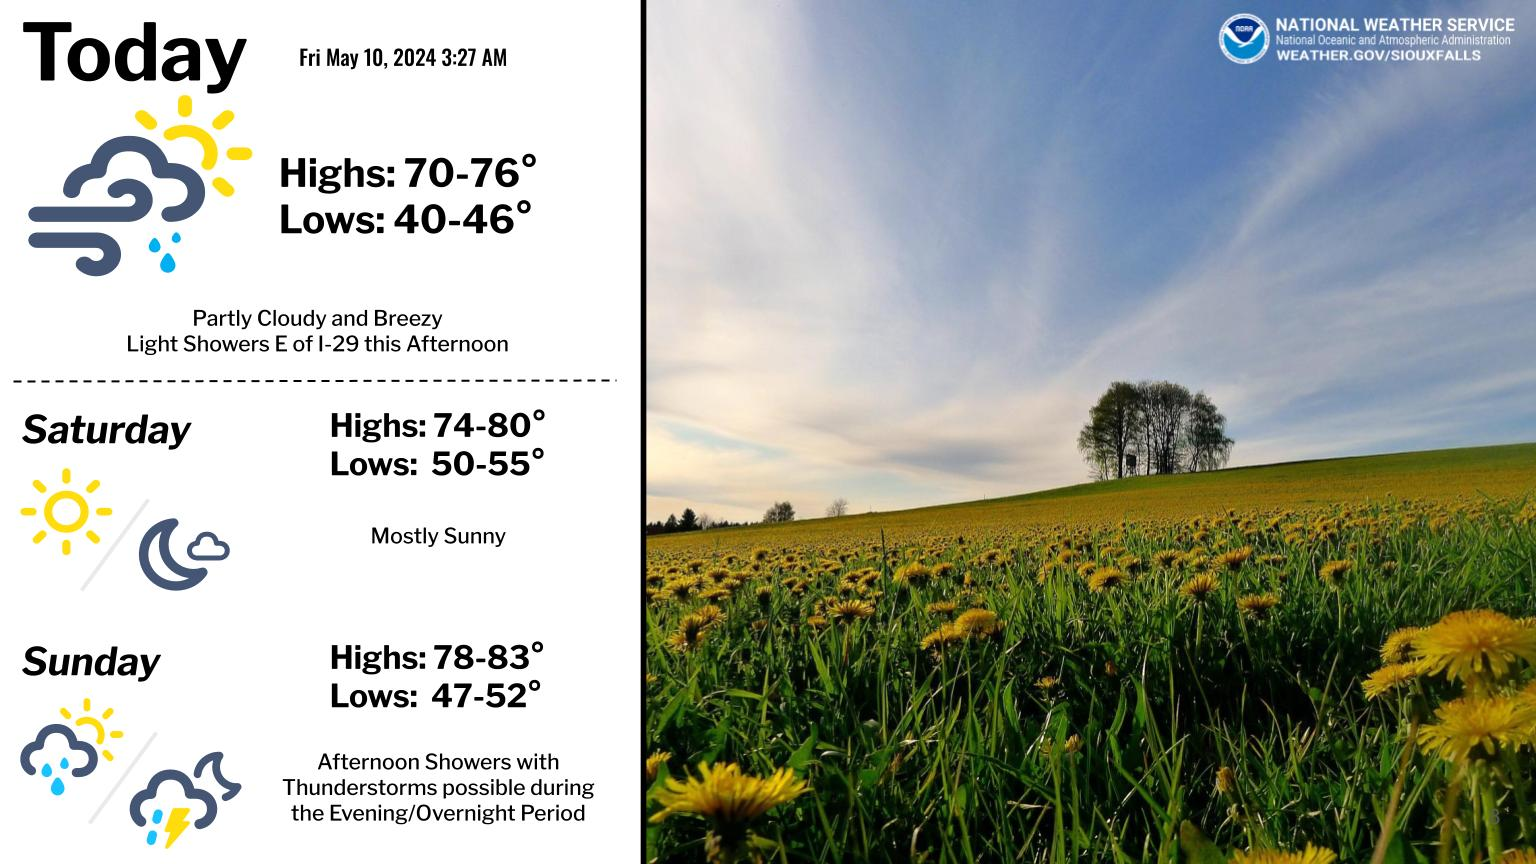
Today
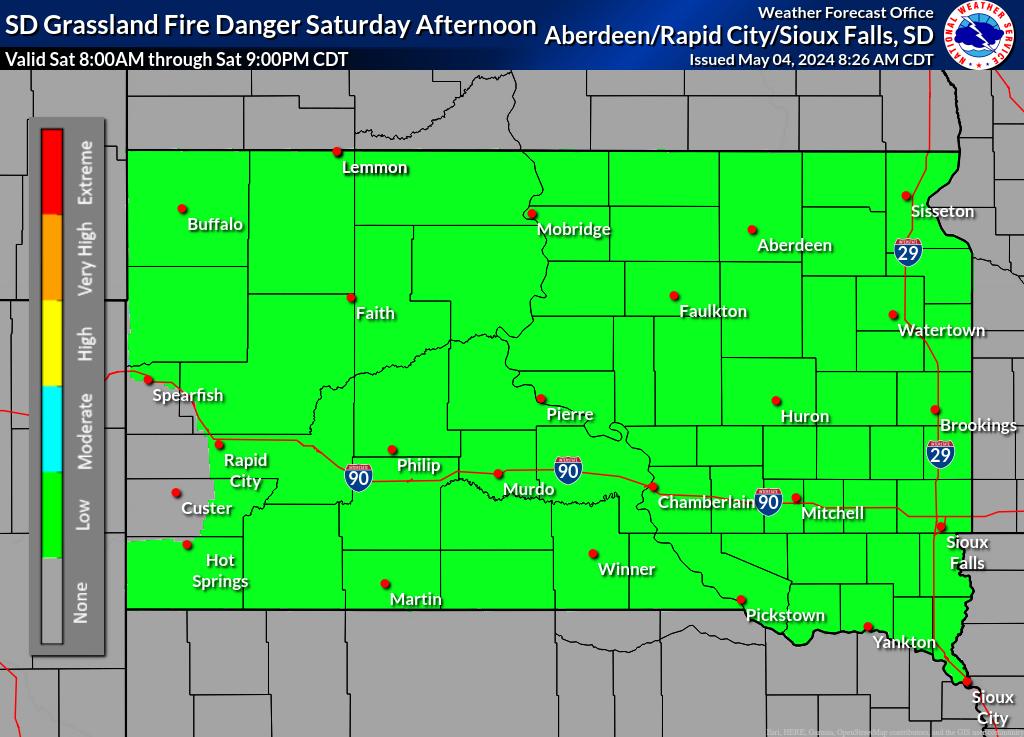
Tomorrow
Drought Monitor

Smoke and Air Quality
Hazard Mapping System Fire and Smoke Product
Northern Plains Air Quality
Local Air Quality from Airnow.gov
Precipitation Forecast
1-Day Rainfall

2-Day Rainfall

3-Day Rainfall

Range of 3-Day Precipitation Possibilities
Probability of Precipitation Amounts
Additional Weather Elements
(mouse over day or period to see map below)
| Max Temperature |
Day 1 |
Day 2 |
Day 3 |
Day 4 |
Day 5 |
|||||
| Min Temperature |
Day 1 |
Day 2 |
Day 3 |
Day 4 |
Day 5 |
|||||
| Min Rel Humidity |
Day 1 |
Day 2 |
Day 3 |
Day 4 |
Day 5 |
|||||
| Heat Index |
Period 1 |
Period 2 |
Period 3 |
Period 4 |
Period 5 |
Period 6 |
Period 7 |
Period 8 |
Period 9 |
|
| Max Wind Gust |
Period 1 |
Period 2 |
Period 3 |
Period 4 |
Period 5 |
Period 6 |
Period 7 |
Period 8 |
Period 9 |
|
| Chance of Precip |
Period 1 |
Period 2 |
Period 3 |
Period 4 |
Period 5 |
Period 6 |
Period 7 |
Period 8 |
Period 9 |
|
 |
||||||||||
Hourly Weather
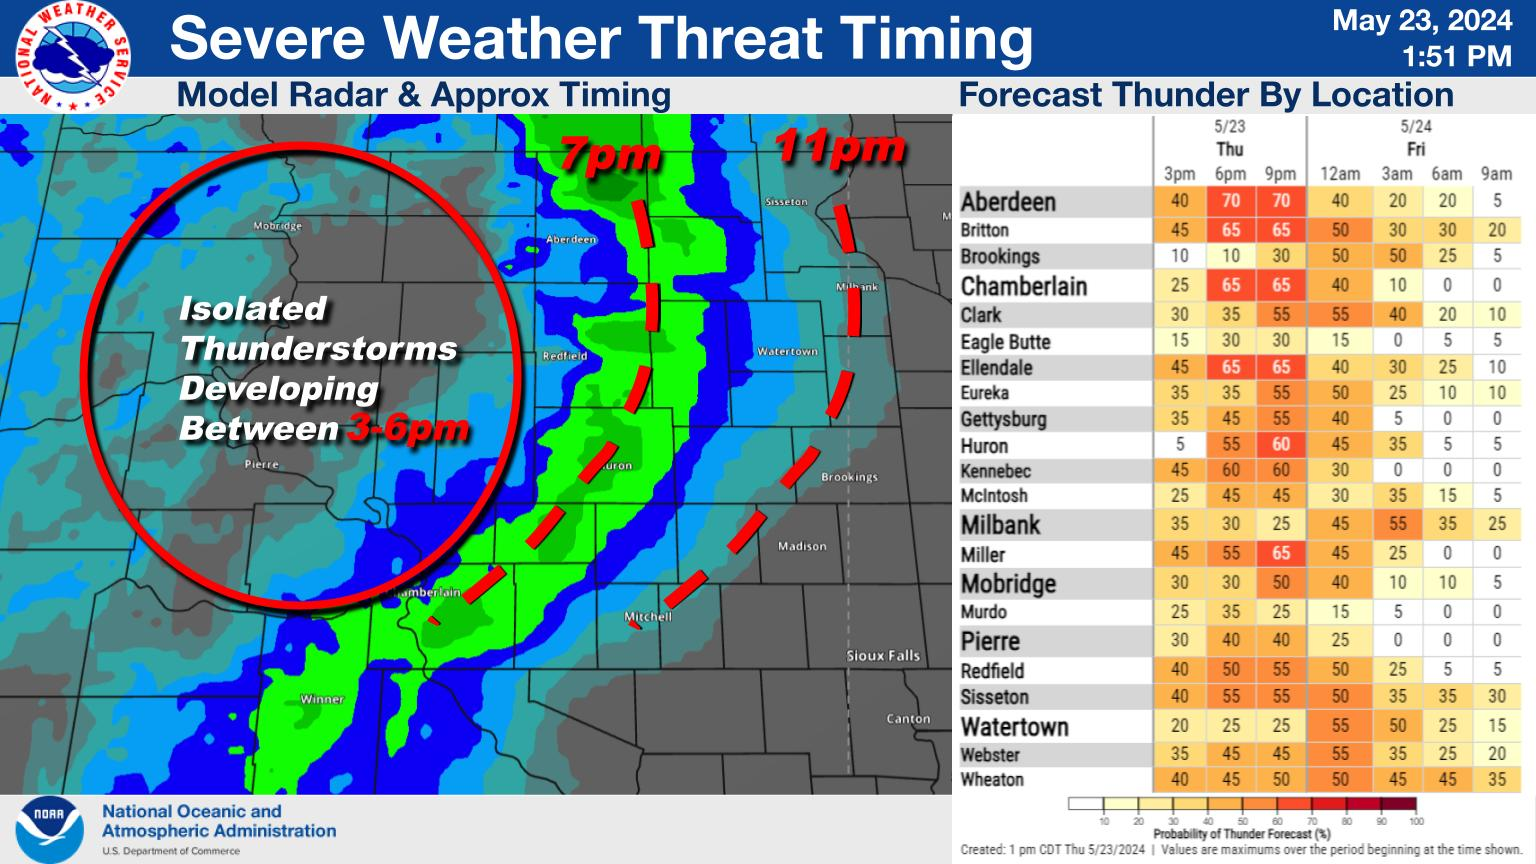
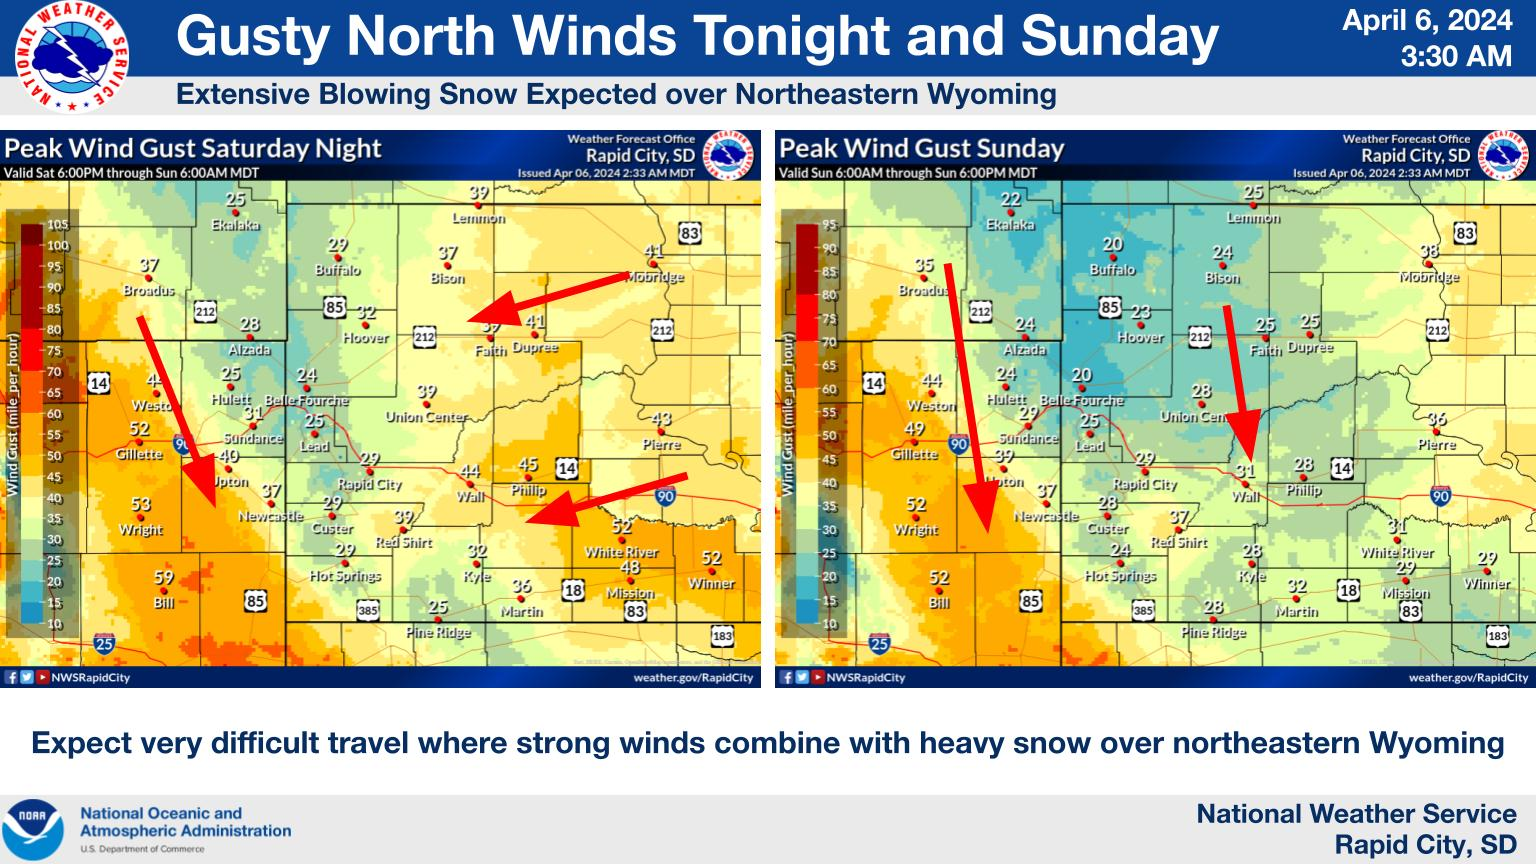
South Dakota Weather Stories
Northeast & Central
West
Southeast