Wildfires and poor air quality continue for the Pacific Northwest, Rockies and extended into the Plains. Severe thunderstorms possible for the northern Plains and upper Midwest on Monday along a frontal boundary. Another boundary will focus showers and thunderstorms for the eastern seaboard with localized heavy rainfall possible. For Alaska, a strong Bering Sea storm will bring winds and rainfall. Read More >
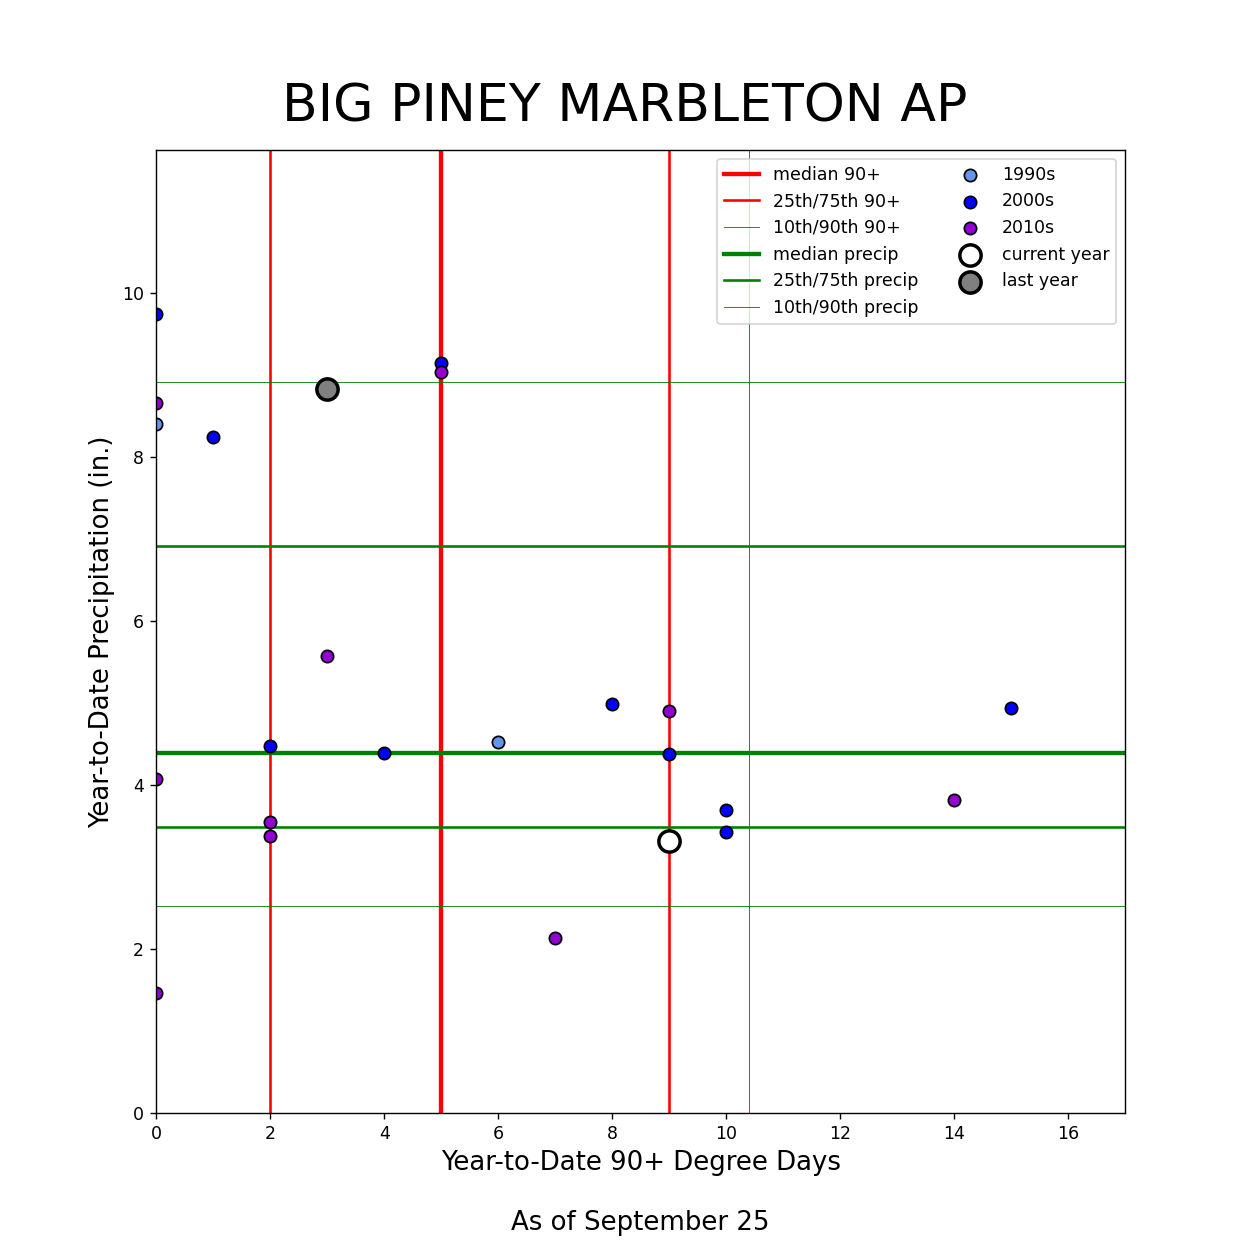
The following graphics depict the number of days that a given site has reached 90 degrees or more this year (on the x-axis) and the annual precipitation to date (on the y-axis). Also included are prior years, color coded by decade, and the 10th, 25th, 50th (i.e., median), 75th, and 90th percentiles for each variable. These graphics show us how hot and dry (or cool and wet) the current year is compared to the period of record and may be useful in drought monitoring.
Many of these sites are maintained by cooperative observers, a program which you can learn more about here. We are in the process of quality controlling past data, so some of these values are subject to change. To view the percentiles, hover over a location on the left after choosing the desired region of interest along the top of the page. Data courtesy of the Applied Climate Information System.