Scattered severe thunderstorms capable of damaging wind gusts are expected across the Mid-Atlantic vicinity this afternoon and evening. Additional strong to severe storms are expected across the upper Ohio Valley and Lower Great Lakes area. Excessive rainfall from heavy thunderstorms may produce areas of flash flooding from southern New Mexico into the western and northern Gulf Coast into Tuesday. Read More >
A question we are often asked is "By what date does my town typically get its first freeze?" The charts and maps below will help answer that question for a number of locations across western South Dakota.
The charts below show the percentage of past years in which the first frost (36º F) or freeze (32º F or below) occurred by a specific date. For example, in 90% of past years, Rapid City first reached 32º F by October 12. In half of the past years, Rapid City reached 28ºF by October 9th.
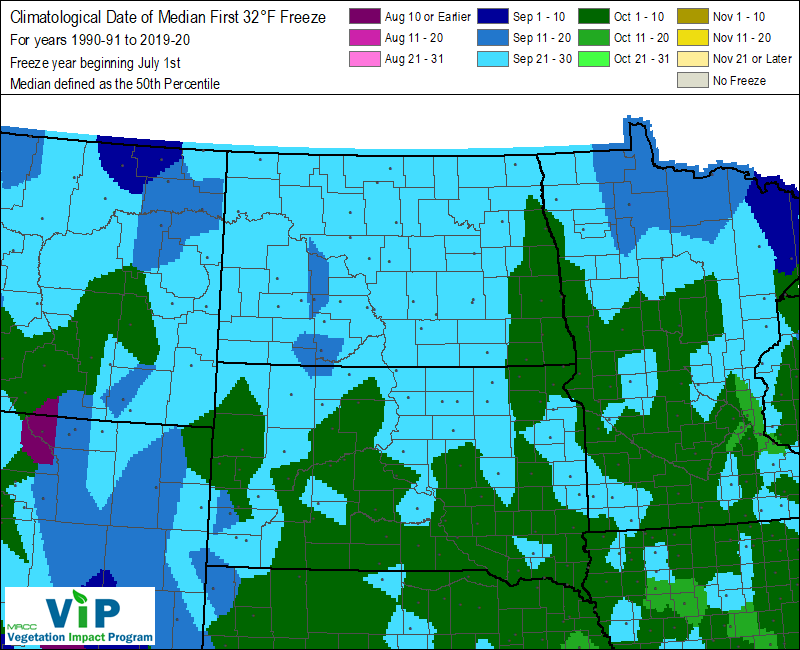
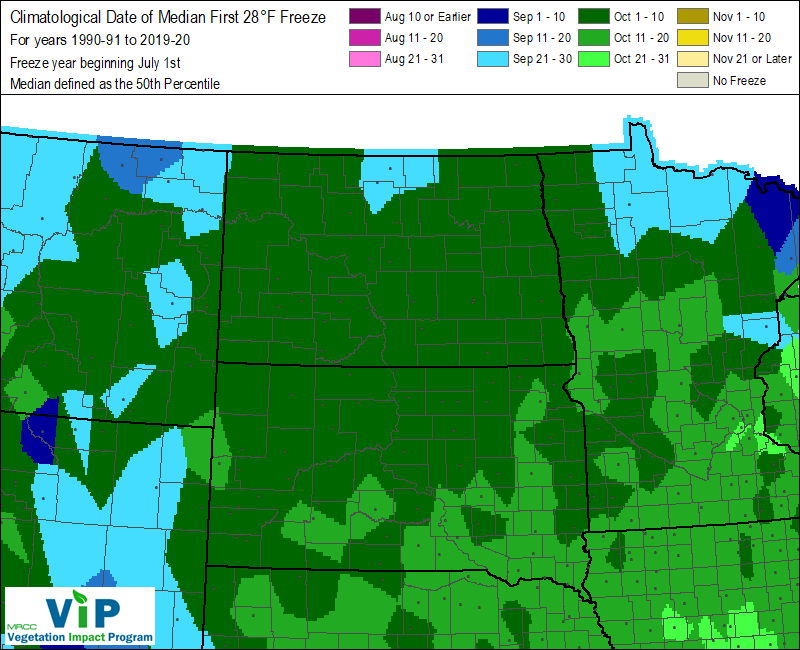
The regional maps farther down show the average date of the first freeze (32º F) and hard freeze (28º F).
A special thanks to the former South Dakota State Climatologist, Dennis Todey for the data in the charts. More percentiles and locations can be found at South Dakota State University's Climate Page.
| Rapid City | 36º F | 32º F | 28º F | 24º F |
| 90% | Sep 30 | Oct 12 | Oct 25 | Nov 8 |
| 50% | Sep 20 | Sep 26 | Oct 9 | Oct 18 |
| 10% | Sep 10 | Sep 13 | Sep 23 |
Sep 27 |
| Lead | 36º F | 32º F | 28º F | 24º F |
| 90% | Sep 22 | Oct 4 | Oct 22 | Oct 31 |
| 50% | Sep 12 | Sep 20 | Oct 1 | Oct 11 |
| 10% | Aug 22 | Sep 8 | Sep 14 |
Sep 24 |
| Custer | 36º F | 32º F | 28º F | 24º F |
| 90% | Sep 15 | Sep 22 | Oct 6 | Oct 18 |
| 50% | Aug 18 | Sep 9 | Sep 17 | Sep 28 |
| 10% | Jul 1 | Aug 8 | Sep 2 |
Sep 10 |
| Faith | 36º F | 32º F | 28º F | 24º F |
| 90% | Oct 2 | Oct 11 | Oct 24 | Nov 3 |
| 50% | Sep 21 | Sep 26 | Oct 7 | Oct 18 |
| 10% | Sep 9 | Sep 13 | Sep 23 |
Sep 26 |
| Camp Crook | 36º F | 32º F | 28º F | 24º F |
| 90% | Sep 18 | Sep 27 | Oct 7 | Oct 19 |
| 50% | Sep 3 | Sep 15 | Sep 23 | Oct 4 |
| 10% | Jul 28 | Sep 1 | Sep 10 |
Sep 16 |
A special thanks to the Midwestern Regional Climate Center for these maps.