Strong to severe thunderstorms will continue tonight across portions of the Ohio Valley into the Mid-Atlantic. Heavy rains may bring an isolated flash flooding threat over the central Appalachians, particularly in West Virginia. Moderate to heavy snow will continue over portions of northern Minnesota and the Upper Peninsula of Michigan through Tuesday morning. Read More >
|
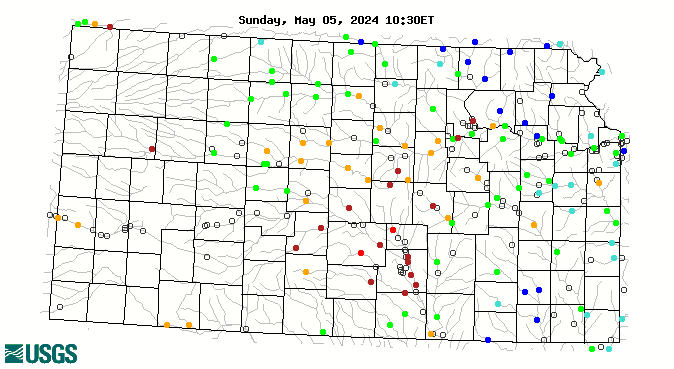
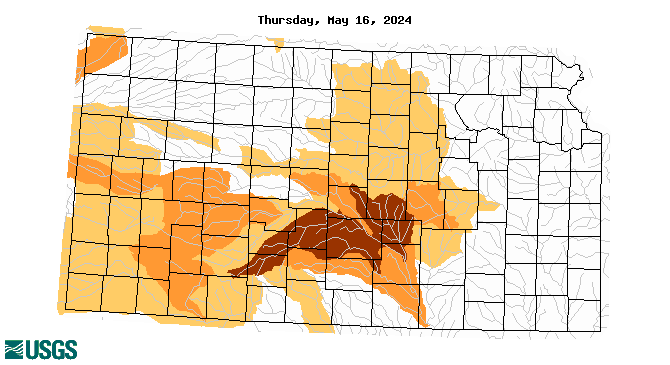
Kansas Drought Conditions (More Info) |
One Month Change in Drought Conditions |
U.S. Drought Monitor maps are updated every Thursday at 7:30 a.m. based on data through 6 a.m. the preceding Tuesday. Maps are based on measurements of climatic, hydrologic & soil conditions as well as reported impacts and observations from more than 350 contributors around the country.
|
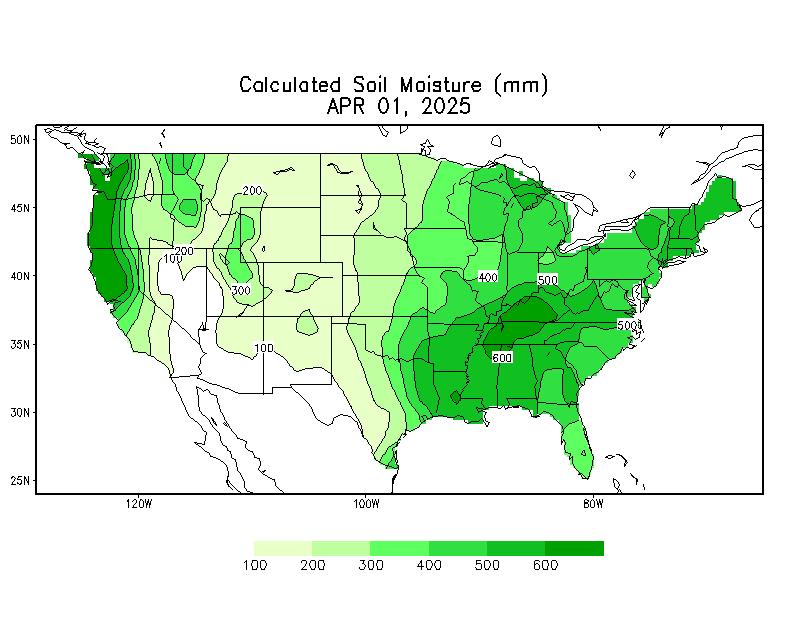
Soil Moisture (More Info) |
Soil Moisture Anomoly |
|
Crop Moisture Index - Depicts Short Term (<4 Week) Dry/Wet Anomolies |
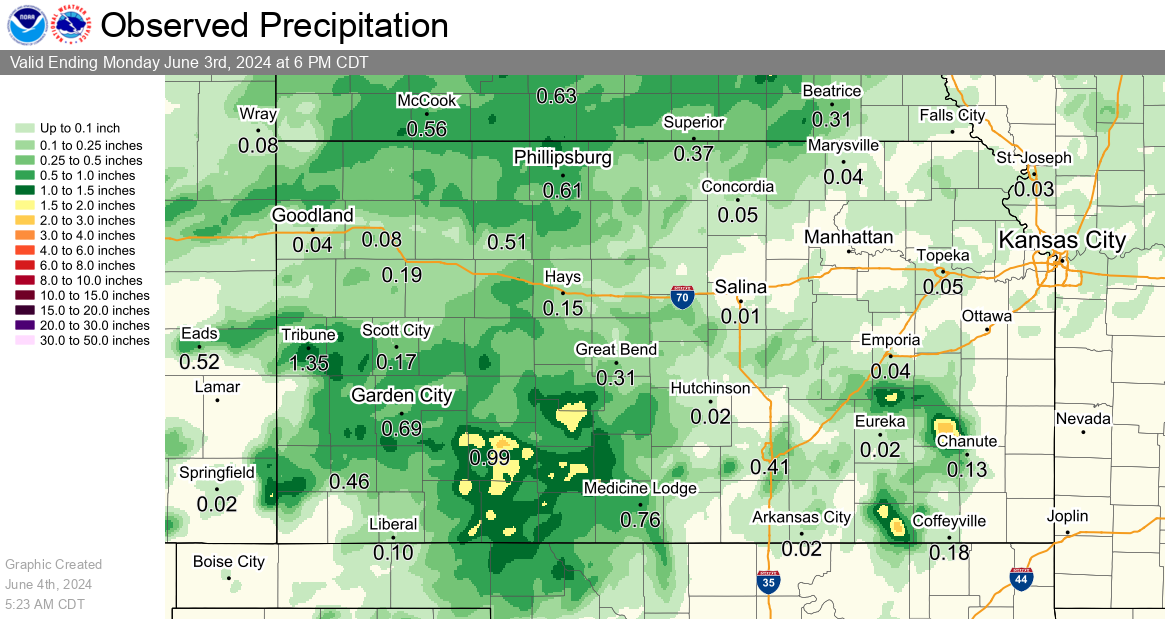
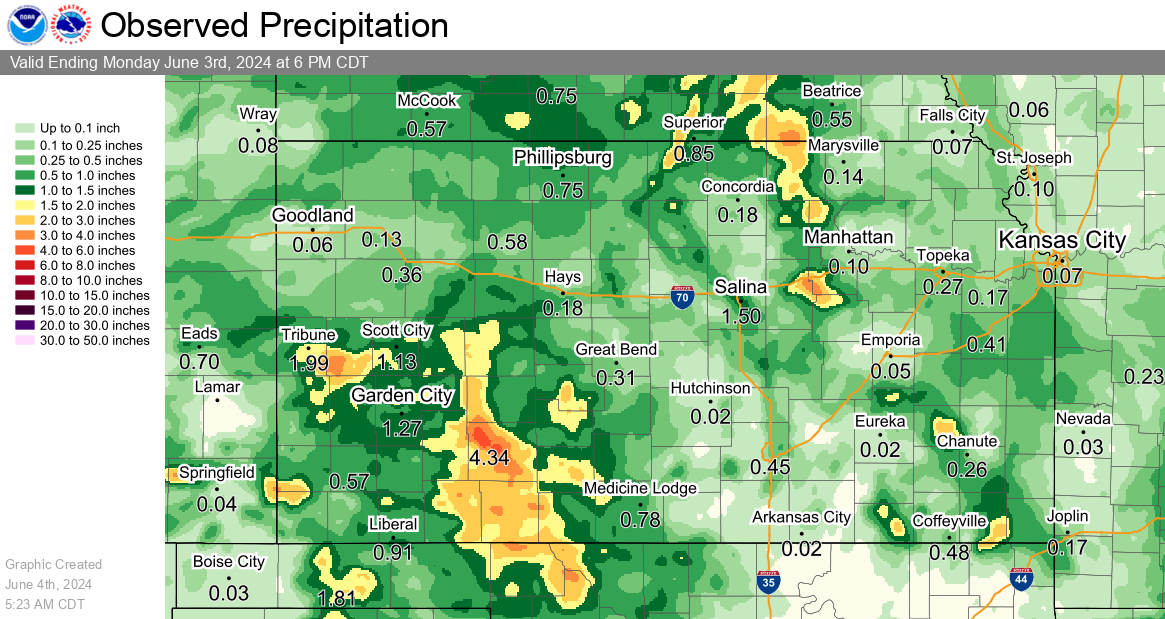
Observed Precipitation
|
Previous 24 Hours of Precipitation |
Previous 72 Hours of Precipitation |
Departure from Normal
The following images depict rainfall totals for various time ranges, in addition to the departure from normal and percentage of normal for that same time range. Images are courtesy of the High Plains Regional Climate Center.
 |
 |
 |
 |
 |
 |
||
| Month-to-Date | Year-to-Date | ||
 |
 |
 |
 |
 |
 |
||
| 14 Days | 30 Days | ||
 |
 |
 |
 |
 |
 |
||
| 3 Months (90 Days) | 6 Months (180 Days) | ||
 |
 |
 |
 |
 |
 |
||
| 1 Year (12 Months) | 3 Years (36 Months) | ||
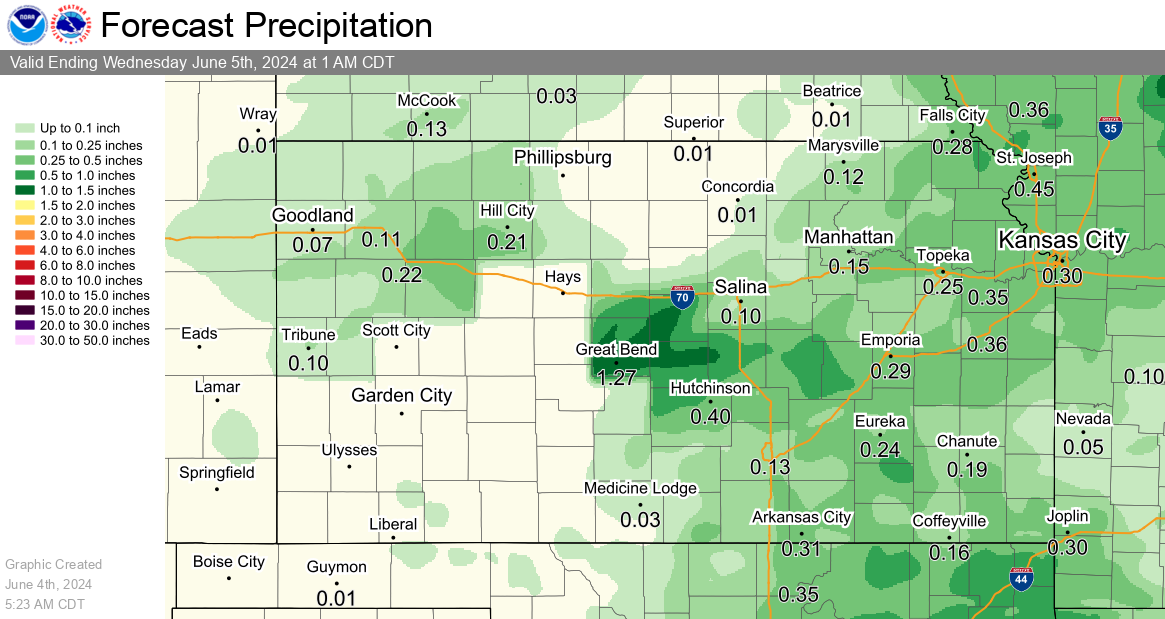
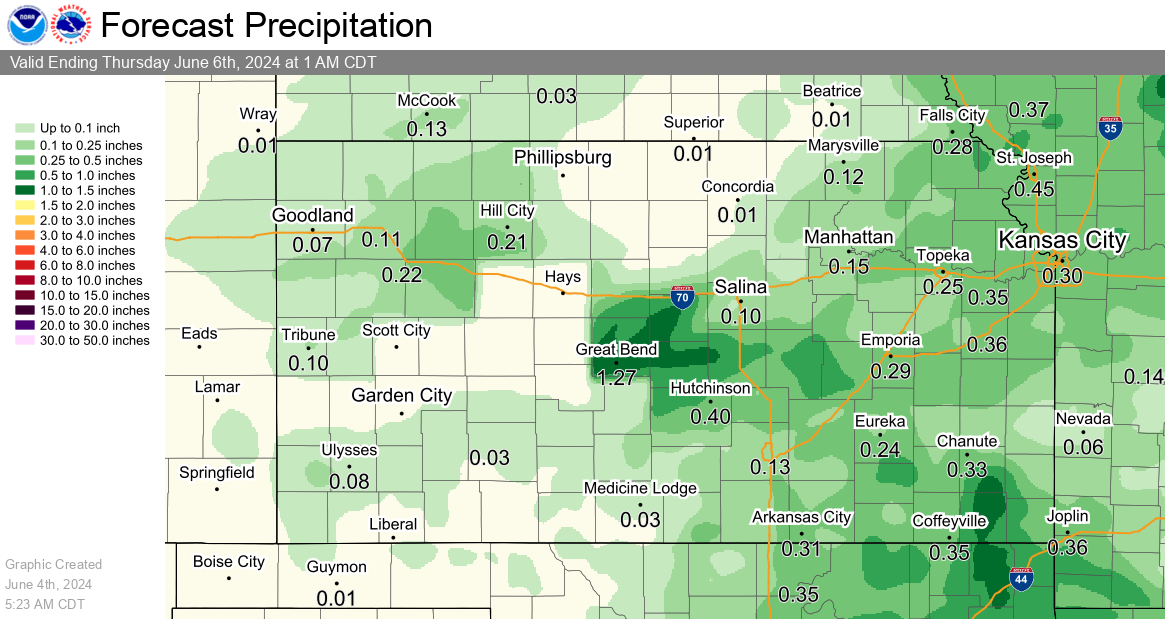
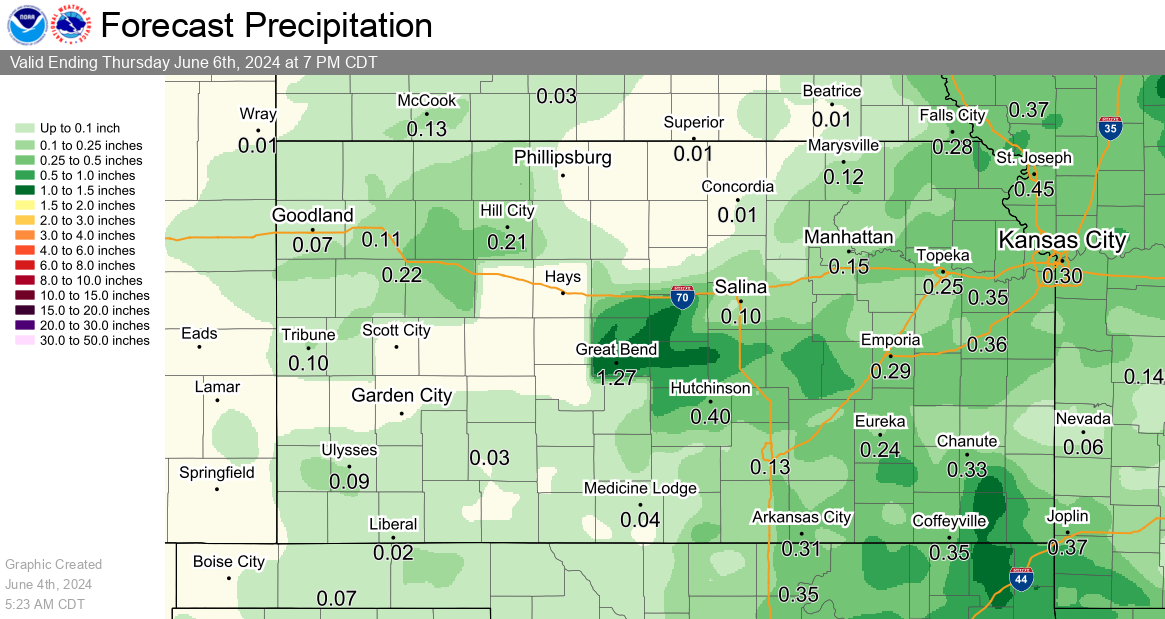
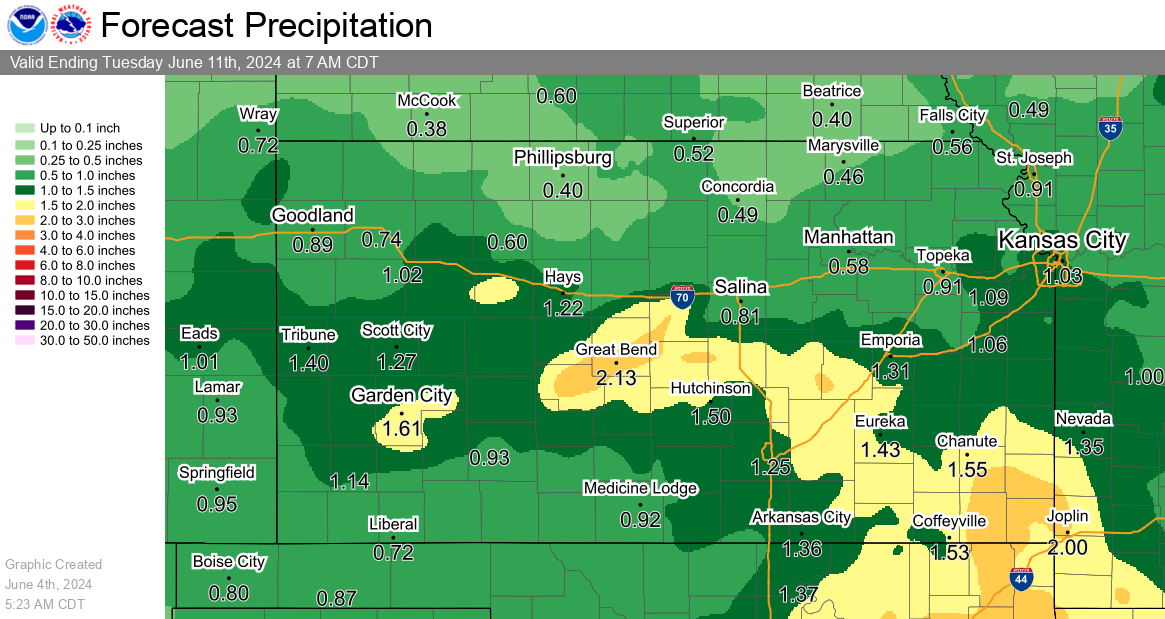
Rainfall Forecast
Precipitation accumulation measured in six hourly periods, starting at 12am, 6am, 12pm, and 6pm CST (+1 CDT).
|
24 Hour Rainfall Forecast |
2 Day Rainfall Forecast |
|
3 Day Rainfall Forecast |
7 Day Rainfall Forecast |
Drought Outlook
 |
 |
| Monthly Drought Outlook | Seasonal Drought Outlook |
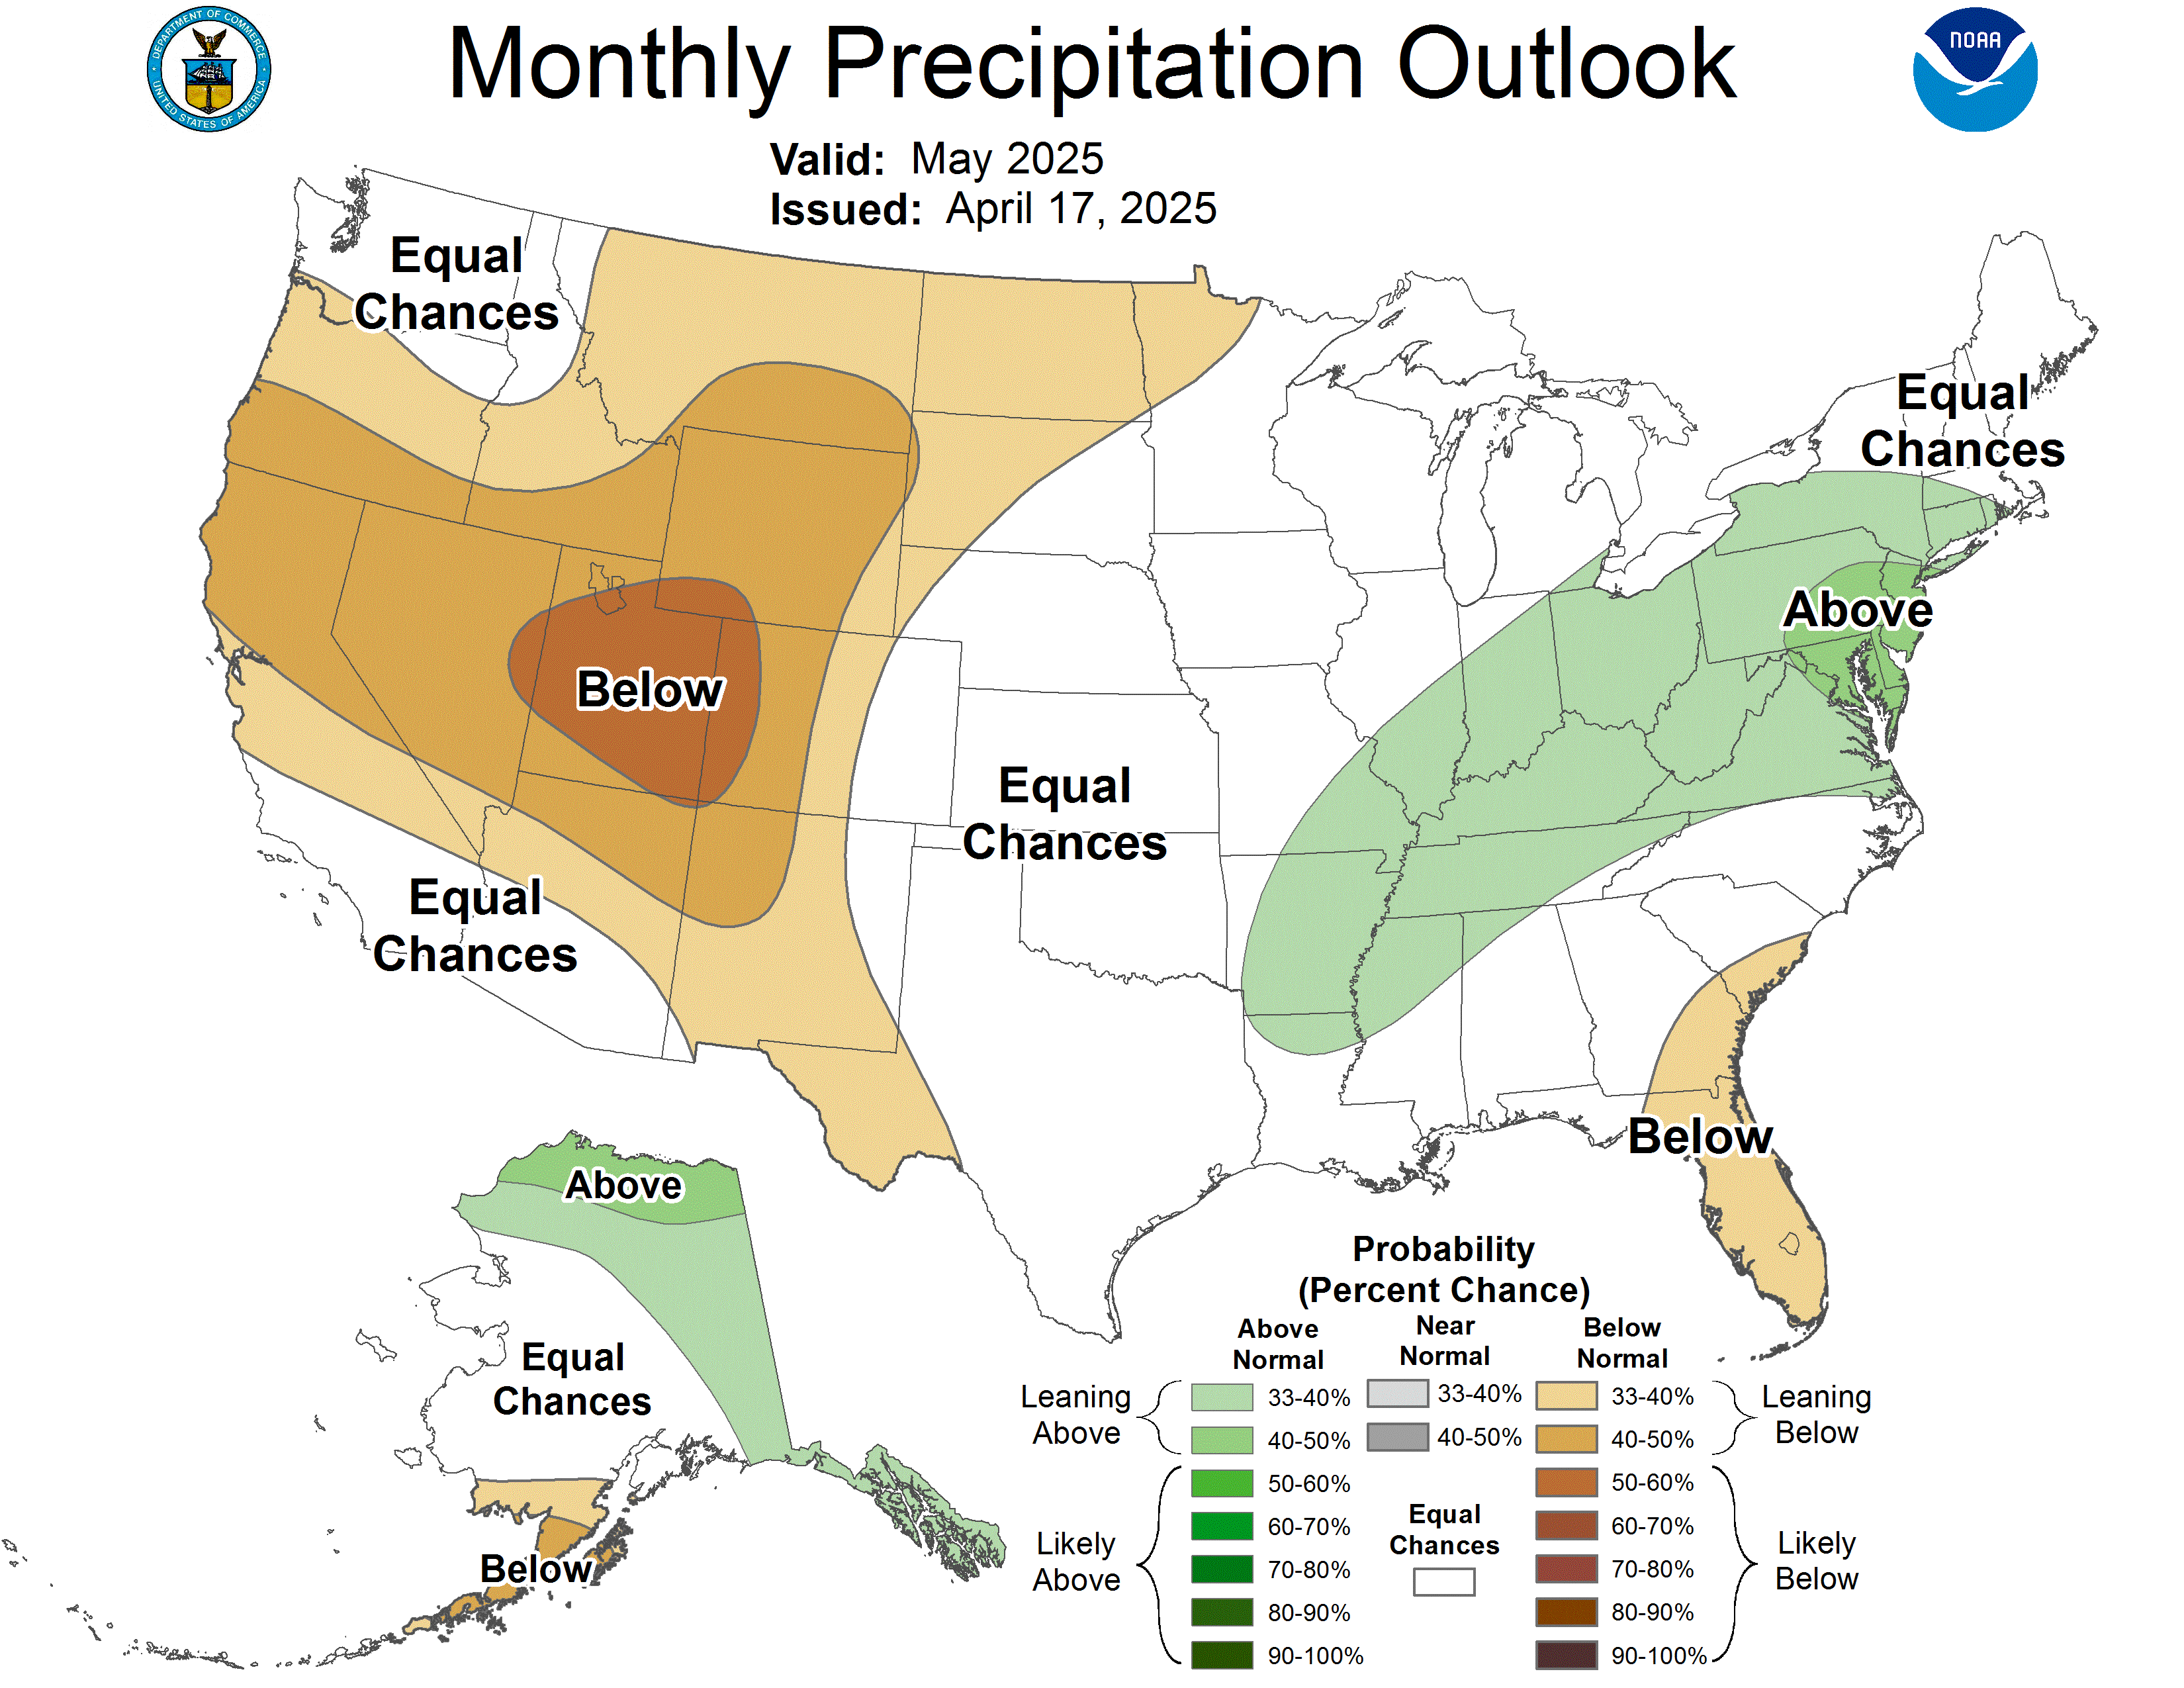
Temperature & Precipitation Outlooks
Long-range outlooks are courtesy of the Climate Prediction Center (CPC). They indicate probabilities of above, near, or below normal temperature and precipitation for the given time period. They do NOT represent the expected magnitude of warm/cool and/or wet/dry weather.
| 6-10 Day Outlook | 8-14 Day Outlook | ||
 |
 |
 |
 |
| Temperature | Precipitation | Temperature | Precipitation |
| One Month Outlook | 3 Month Outlook | ||
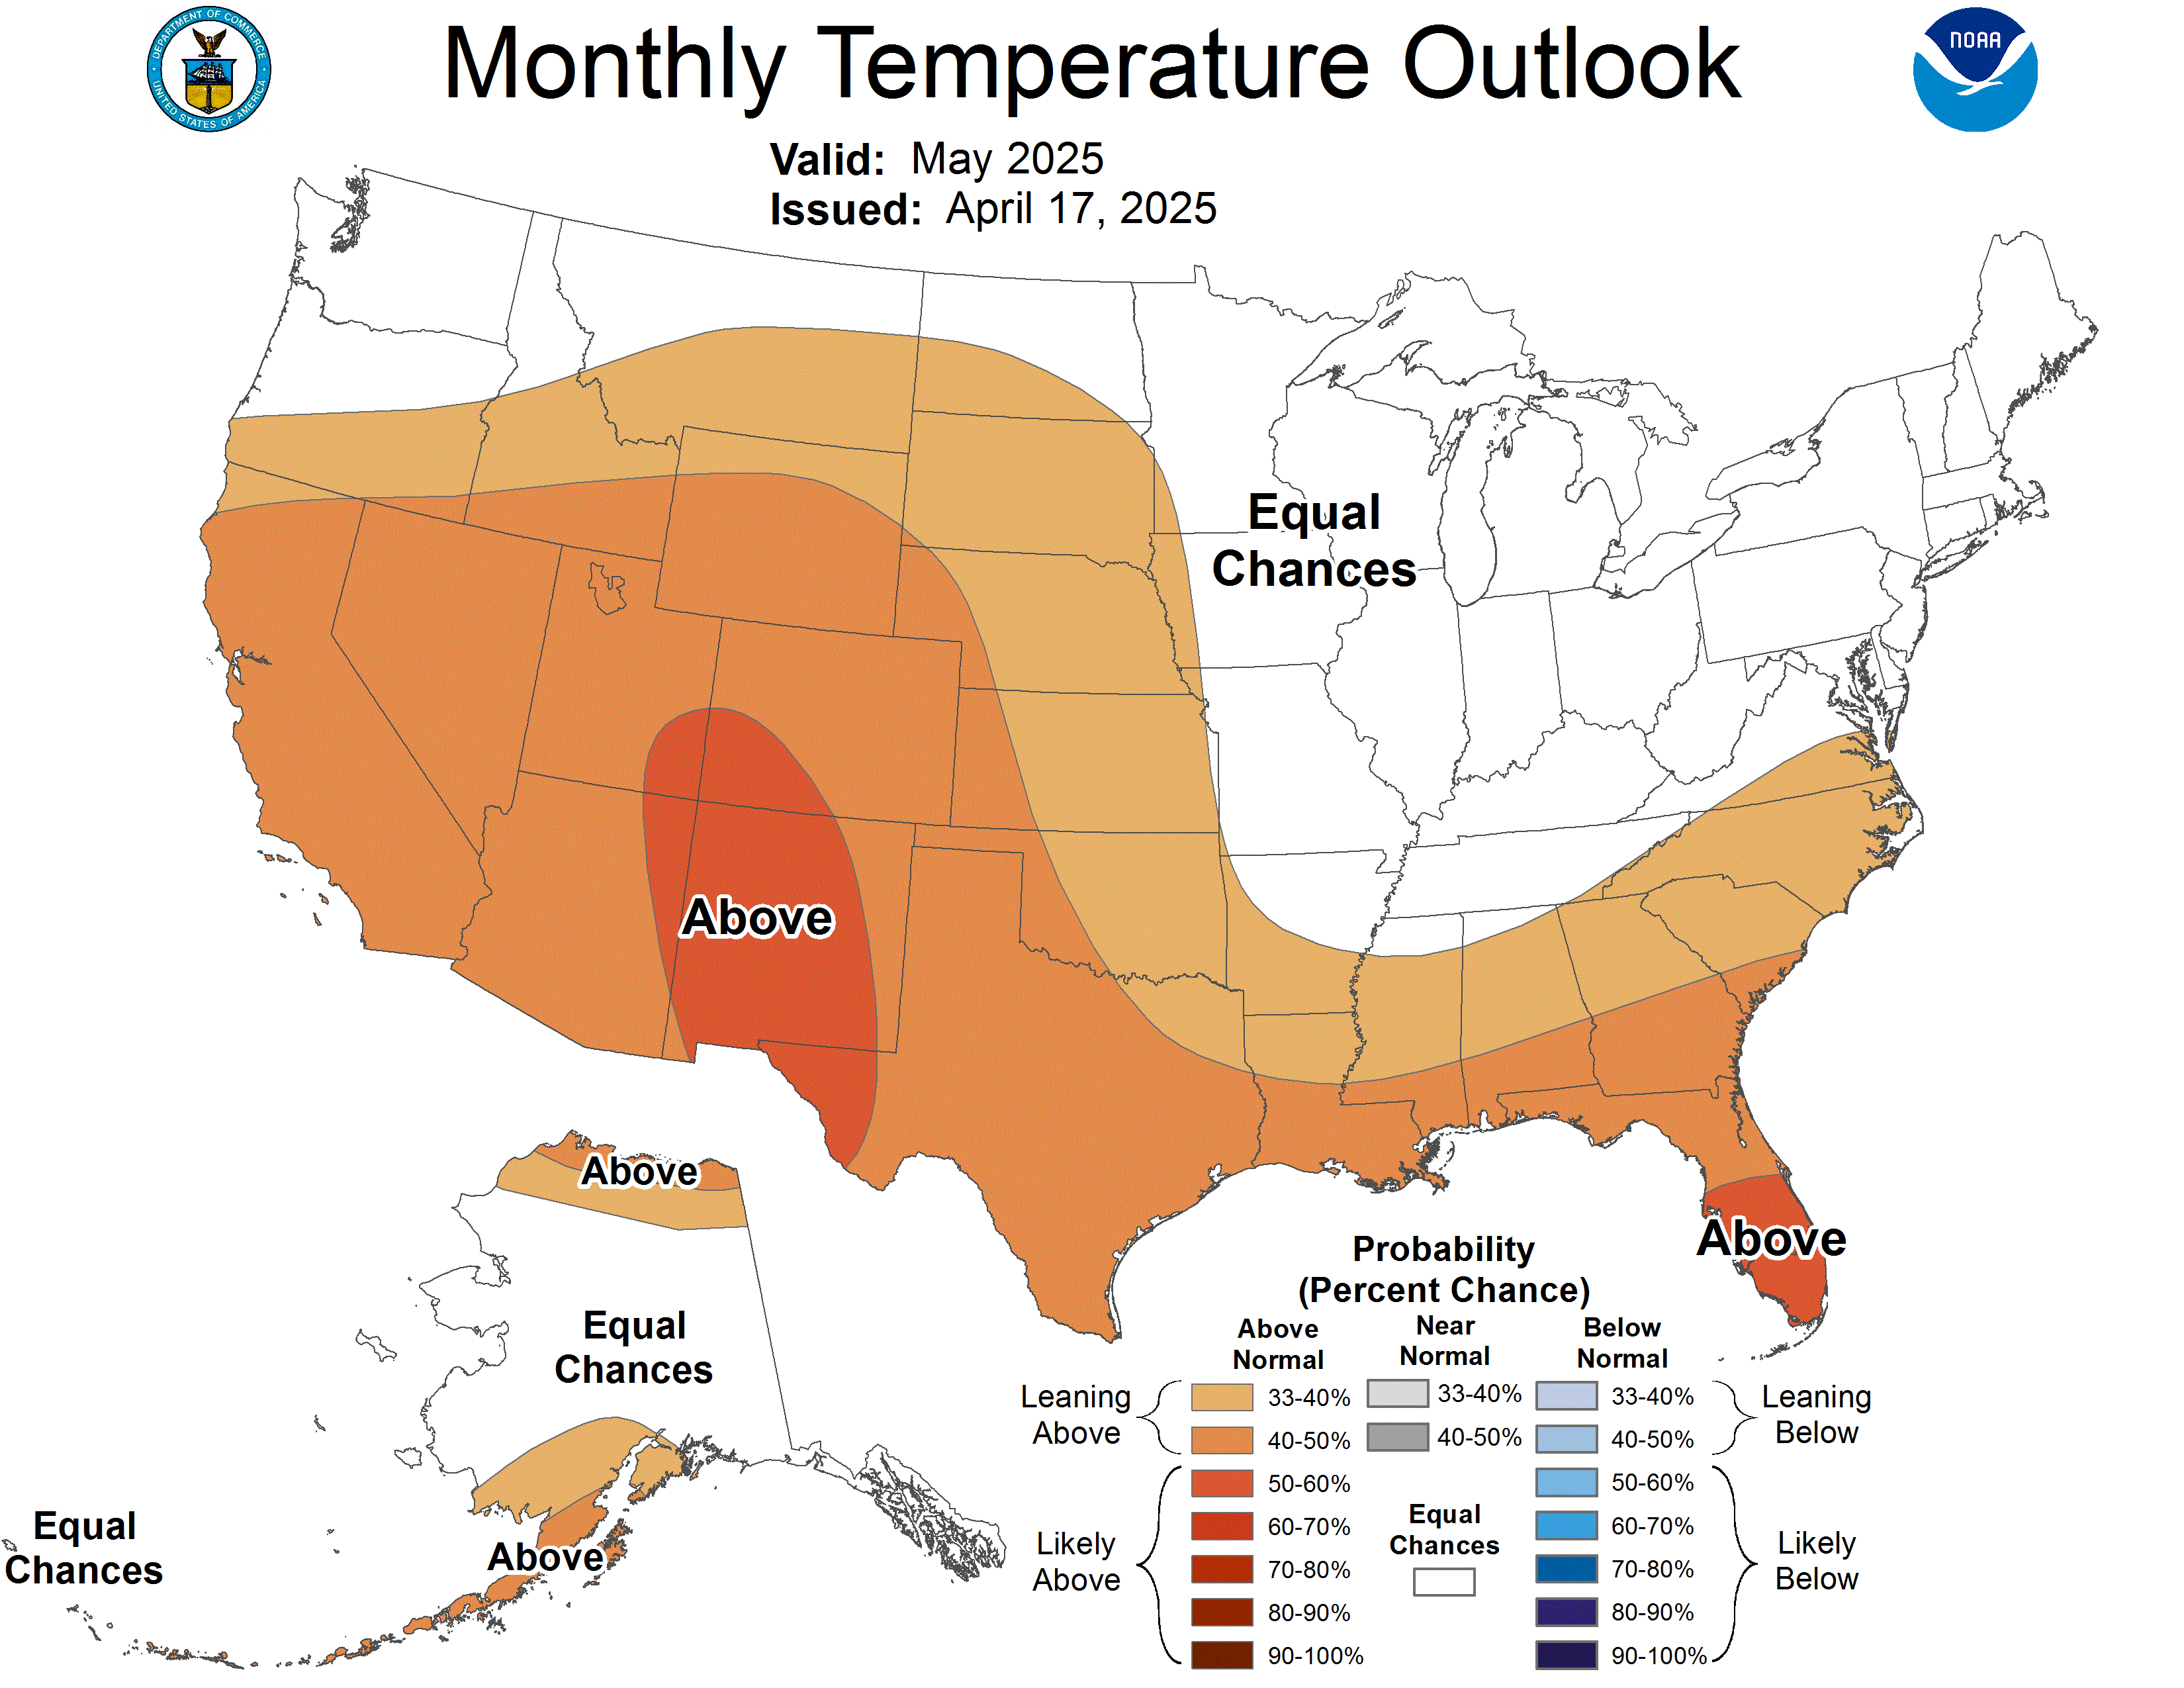 |
 |
 |
 |
| Temperature | Precipitation | Temperature | Precipitation |