Select a tutorial below or scroll down...
  • Air Pressure
  • Changes in Atmospheric Pressure
  • Assessing Atmospheric Pressure and Heights
  • Forces and Winds

  • Air Pressure

    Source: Unavailable

      I. Air exerts a force on surface of objects.
        A. Air pressure is force per unit area.
        B. It is cumulative force of a multitude of molecules.
        C. Pressure depends on:
          1. Mass of molecules
          2. Pull of gravity
          3. Kinetic energy of molecules
      II. Normally a pressure balance between air and objects.
      III. Pressure decreases with height.
        A. Max air density occurs at surface.
        B. Air becomes "thinner" with height.
        C. Affects on humans:
          1. Dizziness, headaches, shortness of breath in mountains
          2. "Ear-popping"
      IV. Horizontal variations in pressure
        A. Altitude dependent, but this is corrected to sea-level
        B. After corrections, still are variations because:
          1. Different air masses
          2. Air is compressible
          3. Air circulation
        C. Air mass - huge volume of air that is relatively uniform in temperature and water vapor.
          1. Pressure increases with warmer temperatures (in closed container)
          2. But atmosphere has no walls, so heated air expands, becomes less dense. Thus, net result is that pressure actually decreases when heated.
            a. Greater activity of the heated molecules increases the spacing between neighboring molecules and thus reduces air density. The decreasing air density then lowers the pressure exerted by the air. Warm air is thus lighter (less dense) than cold air and consequently exerts less pressure.
          3. Moist air is less dense than dry air!!
          4. Sinking air increases pressure at surface, and ascent decreases pressure at surface.
          5. In addition air pressure changes caused by variations of temperature and water vapor content, air pressure can also be influenced by the circulation pattern of air.
      V. There is pressure variations at all time scales.
        A. Long-term
        B. Diurnal (daily)
      VI. Circulations - definitions
        A. Divergence - net outlfow of air from a region or area.
          a. If more air diverges at the surface than descends from aloft, then the air density and air pressure decrease.
          b. Conversely, If less air diverges at the surface than descends from aloft, then the air density and air pressure increases.
        B. Convergence - net inflow of air into a region or area.
          a. If more air converges at the surface than ascends, then the air density and air pressure increases.
          b. Conversely, If less air converges at the surface than ascends, then the air density and air pressure decreases.
        C. High pressure (anticyclone) - Divergence at surface (with convergence aloft) corresponds with sinking motion. It is characterized by a maximum in the pressure field compared with the surrounding air in all directions.
        D. Low pressure (cyclone) - Convergence at surface (with divergence aloft) corresponds with ascending air. This is region of low pressure, or cyclone. It is characterized by a minimum in the pressure field compared with the surrounding air in all directions. Almost always there is a closed, circular isobar around the cyclone.
        E. Ridge - an elongated area of relatively high atmospheric pressure. A ridge is distinct by the "rise" in the pressure field, and can be thought of as a "ridge of atmospheric pressure". Opposite of trough
        F. Trough - an elongated area of relatively low atmospheric pressure. A trough is distinct by the "dip" in the pressure field, and can be thought of as a "valley of atmospheric pressure". Usually not associated with a closed circulation. Opposite of ridge.
        G. These circulation features usually dominate, but don't forget other features that affect pressure (e.g., temperature and water vapor content.)
      VII. Unit of pressure
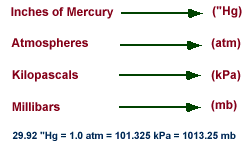
        A. The two most common units in the United States to measure the pressure are "Inches of Mercury" and "Millibars".
          1. Inches of mercury - refers to the height a column of mercury measured in hundredths of inches.
            a. This is what you will usually hear from the NOAA Weather Radio of from your favorite weather or news source. At sea level, standard air pressure in inches of mercury is 29.92.
          2. Millibars - comes from to the original term for pressure "bar".
            a. Bar is from the Greek "báros" meaning weight.
            b. A millibar is 1/1000th of a bar and is the amount of force it takes to move an object weighing a gram, one centimeter, in one second.
            c. Millibar values used in meteorology range from about 100 to 1050. At sea level, standard air pressure in millibars is 1013.2.
            d. Weather maps showing the pressure at the surface are drawn using millibars.
        B. The Pascal
          1. The scientific unit of pressure is the Pascal (Pa) named after after Blaise Pascal (1623-1662).
          2. One pascal equals 0.01 millibar or .00001 bar.
          3. Meteorology has used the millibar for air pressure since 1929.
          4. When the change to scientific unit occurred in the 1960's many meteorologists prefered to keep using the magnitude they are used to and use a prefix "hecto" (h), meaning 100.
          5. Thus, 1 hectopascal (hPa) equals 100 Pa which equals 1 millibar. 100,000 Pa equals 1000 hPa which equals 1000 millibars.
          6. The end result is although the units we refer to in meterology may be different, there value remains the same. For example the standerd pressure at sea-level is 1013.25 millibars and 1013.25 hPa.


    Click here for another tutorial on air pressure.


    TOP

    CHANGES IN ATMOSPHERIC PRESSURE

    METEOROLOGIST JEFF HABY
    theweatherprediction.com

    One of the earliest forecasting tools was the use of atmospheric pressure. Soon, after the invention of the barometer, it was found that there were natural fluctuations in air pressure even if the barometer was kept at the same elevation. During times of stormy weather the barometric pressure would tend to be lower. During fair weather, the barometric pressure was higher. If the pressure began to lower, that was a sign of approaching inclement weather. If the pressure began to rise, that was a sign of tranquil weather. There is also a small diurnal variation in pressure caused by the atmospheric tides. The barometric pressure can lower by several processes, they are:

    1. The approach of a low pressure trough

    2. The deepening of a low pressure trough

    3. A reduction of mass caused by upper level divergence (vorticity, jet streaks)

    4. Moisture advection (moist air is less dense than dry air)

    5. Warm air advection (warm air is less dense than cold air)

    6. Rising air (such as near a frontal boundary or any process that causes rising air)

    When the barometric pressure is lowering, it will be caused by 1, 2 or a combination of the 6 processes listed above. All the processes above deal either with decreasing the air density or causing the air to rise in order to lower the barometric pressure. When forecasting, try to figure out which physical processes in the atmosphere are causing the pressure to lower or rise over your forecast region. When looking at upper level charts, instead of looking for changes in barometric pressure you will be looking for height falls or height rises. Important: Barometric pressure is ONLY plotted on SURFACE CHARTS. Any upper level chart you examine will be taken on a constant pressure surface (e.g. 850, 700, 500, 300, 200). Because upper level charts use a constant pressure surface, height falls or height rises are used to determine if a trough/ridge is approaching and/or deepening. When heights fall it is due to a reduction in mass above the pressure level (i.e. if heights fall on an 850 mb chart, it is because the air is rising or low level cold air advection is occurring). On upper level charts you must consider what is happening above or below the pressure level of interest. If heights fall at 700 mb for example, it could be due to the fact that cold air advection is occurring in the PBL, therefore decreasing the overall height of the troposphere and decreasing the 700 mb height. Just to give you some complexity, barometric pressure can fall at the surface but heights can rise over the same region on upper level charts or vice versa. An example would be a large magnitude of warm air advection in the PBL. The warm air is less dense than the air it is replacing, therefore the surface pressure will fall. However, since warm air expands the height of the troposphere (because it is less dense and takes up more space) the heights aloft will rise. When I start throwing in vorticity, jet streaks, and topography this discussion will become even more complicated.

    The more you learn about meteorology and forecasting the more you will realize the pure complexity of the atmosphere, the interaction of many physical processes at the same time and that learning about meteorology and forecasting lasts a lifetime. For the most part, you can interpret height falls and rises the same way as surface barometric rises or falls. Increment weather is associated with height falls and lowering barometric pressure and fair weather is associated with height rises and rising barometric pressure. Other tips:

    1. Low pressure troughs tend to move toward the region of greatest height falls

    2. Ridges build most strongly into regions with the greatest height rises


    TOP

    ASSESSING ATMOSPHERIC PRESSURES AND HEIGHTS

    METEOROLOGIST JEFF HABY
    theweatherprediction.com

    The average pressure at the surface is 1013 millibars. There is no "top" of the atmosphere by strict definition. The atmosphere merges into outer space. There are 5 slices of the troposphere that meteorologists monitor most frequently. They are the surface, 850 mb, 700 mb, 500 mb, and 300 mb (or 200 mb). Why are these slices monitored and not others more frequently? Why not have a 600 mb and a 400 mb chart? Each of the primary 5 levels have a reason they are studied over other slices of the troposphere (sort of).

    The surface is obviously important because it gives information on the weather that we are feeling and experiencing right where we live.

    The 850 mb level represents the top of the planetary boundary layer (for low elevation regions). This is near the boundary between where the troposphere is ageostrophic due to friction and the free atmosphere (where friction is small). For low elevation regions the 850 mb level is the best level to assess pure thermal advection.

    The 500 mb level is important because it is very near the level of non- divergence. This allows for an efficient analysis of vorticity. Actually the level of non-divergence averages closer to the 550 mb level, but 500 mb is a more "round" number as compared to 550 mb so it was used. The 500 millibar level also represents the level where about one half of the atmosphere's mass is below it and half is above it.

    A level is needed to depict the jet stream. The polar jet stream has a vertical thickness of at least 200 millibars with the core of the jet averaging at about 250 millibars. Either the 200 or 300 mb chart can be used to assess the jet stream / jet streaks. In winter, the 300 mb chart works best and in the summer the 200 mb chart works best for analyzing the core of the jet. The jet stream is at a higher pressure level (closer to the surface) in the winter because colder air is more dense and hugs closer to the earth's surface.

    It is important to have an understanding of the average height of each of these important levels. 1000 mb is near the surface (sea level), 850 mb is near 1,500 meters (5,000 ft), 700 mb is near 3,000 meters (10,000 ft), 500 mb is near 5,500 meters (18,000 ft), 300 mb is near 9,300 meters (30,000 ft). All of these values are in geopotential meters; Zero geopotential meters is near sea level. The height of these pressure levels on any given day depends on the average temperature of the air and whether the air is rising or sinking (caused by convergence / divergence). If a cold air mass is present, heights will be lower since cold air is denser than warm air. Denser air takes up a smaller volume, thus heights lower toward the surface. Rising air also decreases heights. This is because rising air cools. Rising air could be the result of upper level divergence. Upper level divergence lowers pressures and heights because some mass is removed in the upper troposphere from that region. This causes the air to rise from the lower troposphere and results in a cooling of the air. If the average temperature of a vertical column of air lowers, the heights will lower (trough).


    TOP

    FORCES AND WINDS

    Excerpts from University of Illinois (WW2010)

    The weight of the air above an object exerts a force per unit area upon that object and this force is called pressure. Variations in pressure lead to the development of winds, which in turn influence our daily weather. The purpose of this module is to introduce pressure, how it changes with height and the importance of high and low pressure systems. In addition, this module introduces the pressure gradient and Coriolis forces and their role in generating wind. Local wind systems such as land breezes and sea breezes will also be introduced. The Forces and Winds module has been organized into the following sections:

    * Pressure
    * Pressure Gradient Force
    * Coriolis Force
    * Geostrophic Wind
    * Friction and Boundary Layer Wind
    * Centrifugal Force and Gradient Wind

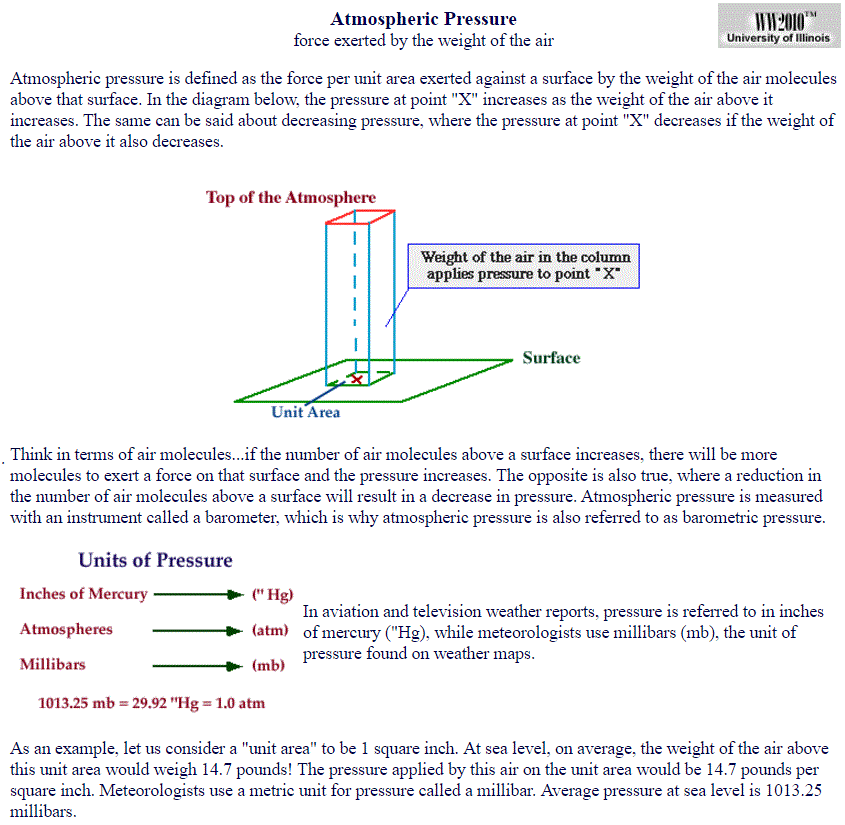
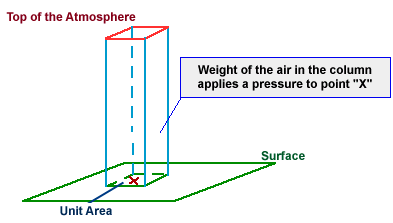
    Atmospheric pressure is defined as the force per unit area exerted against a surface by the weight of the air above that surface. In the diagram below, the pressure at point "X" increases as the weight of the air above it increases. The same can be said about decreasing pressure, where the pressure at point "X" decreases if the weight of the air above it also decreases.

    Thinking in terms of air molecules, if the number of air molecules above a surface increases, there are more molecules to exert a force on that surface and consequently, the pressure increases. The opposite is also true, where a reduction in the number of air molecules above a surface will result in a decrease in pressure. Atmospheric pressure is measured with an instrument called a "barometer", which is why atmospheric pressure is also referred to as barometric pressure.

    In aviation and television weather reports, pressure is given in inches of mercury ("Hg), while meteorologists use millibars (mb), the unit of pressure found on weather maps.

    As an example, consider a "unit area" of 1 square inch. At sea level, the weight of the air above this unit area would (on average) weigh 14.7 pounds! That means pressure applied by this air on the unit area would be 14.7 pounds per square inch. Meteorologists use a metric unit for pressure called a millibar and the average pressure at sea level is 1013.25 millibars.

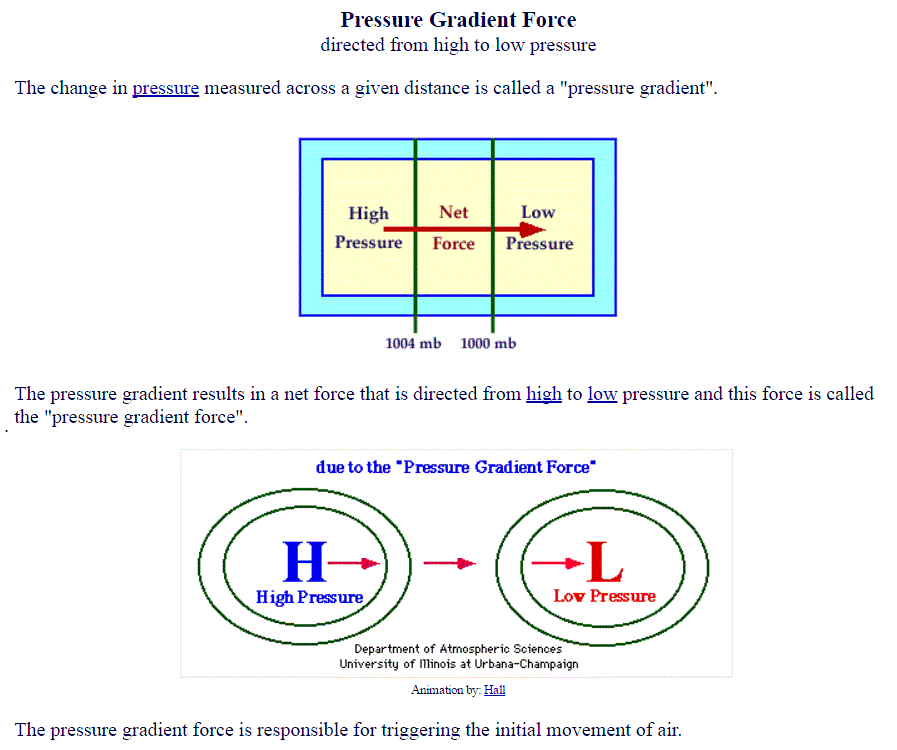
      I. Pressure Gradient (PGF) - A change in pressure per unit distance.
        A. It is always directed from higher toward lower pressure.
        B. Air would accelerate along the pressure gradient toward the lower pressure if this were the only force acting on the air.


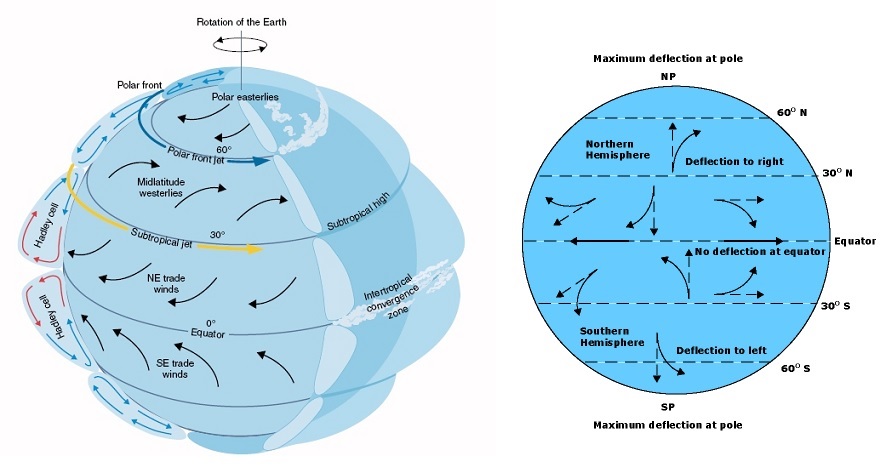
      II. Coriolis Force (CF) - Occurs because of rotation of earth.
        A. Any moving object in the Northern Hemisphere will experience an acceleration to the right of their path of motion.
        B. This apparent deflection occurs because of our frame of reference has been shifted as the earth rotates.
        C. Coriolis force dependent on two factors:
          1. Latitude - Increases poleward; Coriolis force greatest at poles, zero at equator.
            a. Reason - "Twisting" of frame of reference enhanced near pole.
          2. Velocity - The faster the wind, the stronger the Coriolis Force.
            a. Reason - In a given period of time, faster air parcels cover greater distances.
            b. From our viewpoint - longer trajectories have greater deflections than shorter trajectories.
        D. Coriolis force is length scale dependent. It is negligible at short distances.


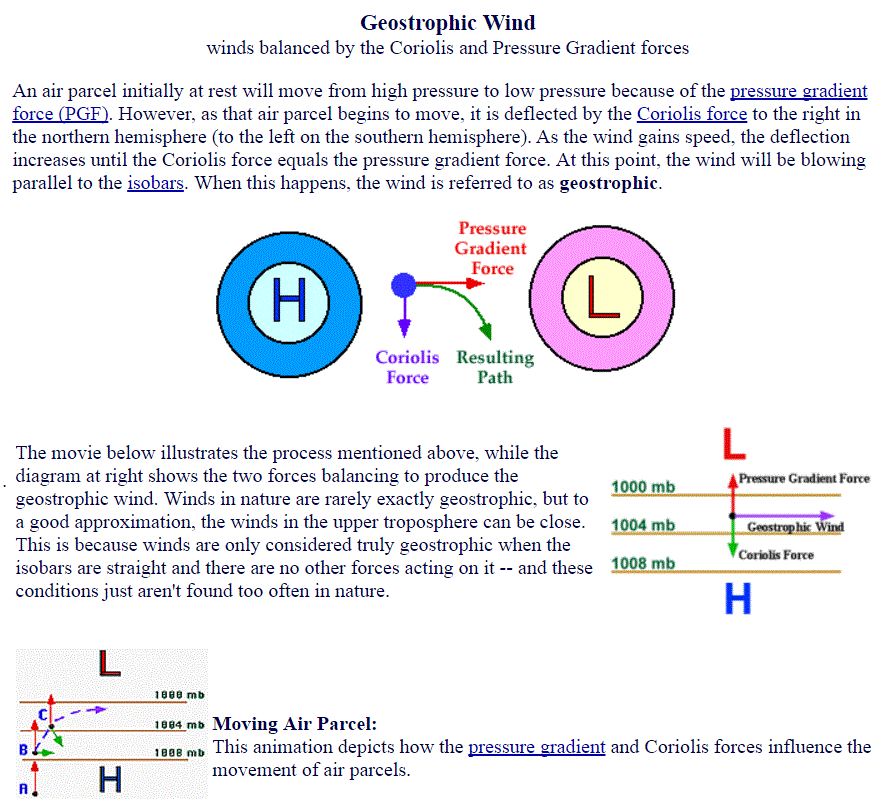
      III. Geostrophic Wind approximation (Vg) - represents a balance between the CF and PGF.
        A. Assumptions:
          1. Straight isobars.
          2. No friction from viscosity or the ground; valid above 1 km.
        B. Comments on geostrophic wind:
          1. Wind flows in a straight path, parallel to isobars.
          2. The stronger the PGF (the closer the isobar spacing), the faster the wind.
          3. The less dense the air, the faster the wind (there is an inverse proportionality between wind and air density).


      IV. Friction and Boundary Layer Winds - important in "friction layer" below 1 km.
        A. Reduces wind speed.
        B. Since CF proportional to wind speed (V), the magnitude of CF is reduced.
        C. Consequently, CF no longer balanced PGF, and wind blows across isobars toward lower pressure ("cross-isobaric flow").

        Click here for an in-depth explanation on friction
        Click here for an in-depth explanation on boundary layer winds


      V. Centrifugal Force and Gradient Wind - occurs with curved flow.
        A. An object in motion tends to move in a straight lines unless acted upon by an outside force.
        B. This tendency is the centrifugal force (analogy - driving around a corner).
        C. It is directed outwards from curved flow.
        D. Implications on air flow:
          1. Wind is subgeostrophic V < Vg in trough.
          2. Wind is supergeostrophic V > Vg in ridge.
        E. Minor influence, except in tornadoes and hurricanes.

        Click here for an in-depth explanation (including animations) of gradient wind


    TOP