SEVERE WEATHER CLIMATOLOGY FOR THE SPRINGFIELD, MO. NWSO COUNTY WARNING AREA
by
Fred E. Hatch III
NWSO Springfield, Missouri
July 1996
1. Introduction
This is a study of the Springfield, Missouri, County Warning Area (CWA) severe weather events from 1961 to 1995. The study was done to provide a climatological view of the severe weather in this area to include tornadoes, hail, damaging winds, and heavy rain events. This study encompasses a thirty five year period for southwest Missouri and extreme southeast Kansas. The information provided in this study can be used as a general aid for the office forecasters in understanding the characteristics and trends of severe weather in the Springfield CWA.
The National Weather Service Office (NWSO) Springfield has warning responsibility for 37 counties in the central plains area that includes parts of Missouri and Kansas ( Figure 1 ). With the increase in population and tourism in the area, forecasters need to have an understanding of the severe weather climatology in their area of responsibility. This information is needed in order to more effectively provide forecasts and warnings of tornadoes and severe thunderstorms.
2. Data
Data used in this study was obtained from the National Climatic Data Center's (NCDC)
computer net data access page as well as the SVR-PLOT program (Hart, 1992) from the National Severe Storms Forecast Center (NSSFC). Data was also supplemented by station records, Storm Data publications from NOAA and by Grazulis (1993). Data for wind and hail reports from1972 were supplimented by the Storm Data publications, since reports were not available from the SVR-PLOT program. Some limitations that may skew the gathered data include population density, time of day, lack of spotter networks, lack of proper measuring devices, and apathy or misunderstanding of the events by the public. Other factors to be considered include urbanization, highway distribution, and level of education of the local population.
Another limitation is a tornado being counted more than once if it crossed a county line. This is obviously a flaw in the data set used, but the errors were corrected when noticed by the author. In general, the data are still viable in assessing the trends of tornadoes over the CWA since most multi-county tornadoes are the stronger, long-lived type which occure less frequently.
Also, the data used in the preparation of the heavy rain events were obtained for only the Springfield NWSO and is not a representation of the CWA. In other words, at the time of the creation of this paper the data was not readily available for inclusion.
3. Tornado Climatology
a) Yearly Distribution
From 1961 to 1995, 367 tornadoes were reported in the NWSO Springfield CWA with an average of 10.5 occurring each year (Figure 2). Fatalities from these tornadoes numbered 22, or less than one each year. Tornadoes occurred in the CWA during every month of the year and at every hour of the day. A county by county analysis (Figure1) shows that Jasper, Newton, and Howell counties had the highest number of reported tornadoes. This may be due to the fact that these are fairly populous counties, which also supports the number of reports in Greene and Crawford counties. The exceptions to this are Texas and Miller counties. Each reported a large number of tornadoes yet are not very populated counties. The Miller county number may be explained by its proximity to Jefferson City, MO. In Texas county, the number of reports could be due to the fact that Highways 60 and 63 both run through the county, and also the county's proximity to the city of West Plains in Howell county.
b) Monthly Distribution
The month with the greatest number of tornadoes (Figure 3) in the NWSO Springfield CWA is April with the peak season extending from March to June and a secondary season of September to November. This is close to the normal trend of most central states with the peak seasons being from March to May and November to December. The major difference was the second season starting two months earlier than the average regional second season.
The graph shows a large number of reported tornadoes during the month of December. This is due to two occurrences during December of 1982. These occurrences, on 2 and 24 December, produced 18 tornadoes and give the December data a more ominous look.
The longest tornado occurring within the NWSO Springfield CWA was an F3 tornado that passed through 6 counties, from Crawford county, KS, to Benton county, MO. on March 15, 1982. This tornado left a 70 mile long track that stretched from the Pittsburg, KS, area across southwestern Benton county in Missouri leaving 4 people dead.
The two months with the least amount of tornado activity were January and August, counting for only 5 of the total number of tornadoes in the NWSO Springfield CWA. It is interesting to note that the only tornado occurrence in January was of F2 strength, giving rise to the question that cool month tornadoes are of stronger intensity. This is supported by the graph of monthly tornado reports which show that F2-F3 tornadoes have a higher percentage of the total occurrences during the cooler months, averaging near 50% between October and March versus 21% from April to September.
c) Hourly Distribution
Tornadoes have occurred at all hours of the day (Figure 4) in the NWSO Springfield CWA, but have occurred most frequently between 3:00 p.m. and 8:00 p.m. CST, which coincides with the maximum diurnal heating of the earth's surface. This same trend is also noticeable in the number of strong tornadoes, which are greatest between 6:00 p.m. and 9:00 p.m. Also of note are the exclusive F2 and F3 tornadoes at 4:00 a.m. in the CWA. These tornadoes occurred throughout the study period. However, it is interesting to note that 90% of the early morning tornadoes occurred in the cool months of October thru December.
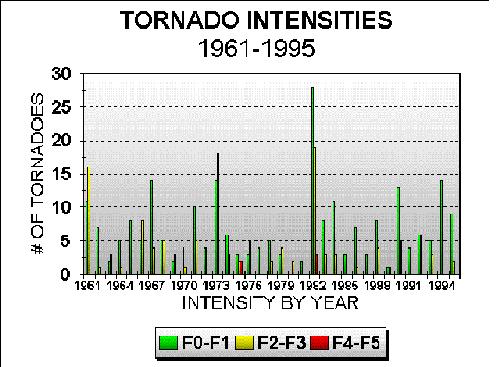
d) Intensity
Tornadoes are classified by the Fujita scale (1971a) according to the amount of damage they do. The scale starts at F0 (weak tornado) and goes to F5 (violent tornado). This study uses the individual ratings to discuss the data gathered.
Of the 367 tornadoes in the Springfield CWA (Figure 5), 19% (71) were F0, 46%(167) were F1, 27%(99) were F2, 7%(25) were F3, and only 1%(5) were of F4 intensity with no F5 tornadoes reported. National statistics show that 2% of all tornadoes fall into the F4-F5 category, 30% are F2-F3, and 68% are F0-F1(Grazulis, 1993). The numbers for the Springfield CWA show percentages that are very close to the national averages.
By looking at the monthly distribution (Figure 3), it can be seen that the peak months for weak tornadoes are April and May, and the peak month for violent (F4) tornadoes is April. This indicates April as the most active and dangerous tornado month. It is also interesting to note that the number of deaths that occurred due to F1 tornadoes is proportionally small compared to the total number of F1 tornadoes, while with F3-F4 tornadoes the proportion is closer to 1:1 (Figure 6).
4. Hail Climatology
a) Yearly Distribution
The National Weather Service (NWS) classifies a thunderstorm as severe if it produces hail 0.75 inches in diameter or greater. Because of this, this study only covers severe hail events. The graph of hail events by year (Figure 7) indicates a dramatic increase in the number of hail reports after 1982. This indicates an increased awareness of the public to severe weather and greater verification efforts on the part of the NWS.
b) Monthly Distribution
The monthly hail event graph (Figure 8) indicates that April and May are the two most active hail months in the Springfield CWA. There is also evidence of a minor secondary peak in September.
The monthly hail reports in this study were divided into four groups based on the size of hail reported and were classified as:
Large: 0.75-0.88 in.
Very Large: 1.00-1.75 in.
Giant: 2.00-3.50 in.
Enormous: 4.00 + in. diameter
As the monthly hail graph shows, the greatest number of giant and enormous hail reports happen in the months of April, May and June with the largest report being 5.25 inches in diameter in Lawrence county on April 26, 1994.
c) Hourly Distribution
The hourly hail event graph (Figure 9) shows that hail reports are the greatest between the hours of 2:00 p.m. and 9:00 p.m. with the peak hour being 4:00 p.m. This is concurrent with the national average between 3:00 p.m. and 7:00 p.m. This suggests that the strongest storms in the Springfield CWA occur during the evening hours mainly between 3:00 p.m. and 6:00 p.m.
5. Damaging Wind Climatology
a) Yearly Distribution
Damaging winds are defined by the NWS as convective wind gusts that reach or exceed 50 knots (58 mph). It can be seen from the graph of yearly wind events (Figure10) that the number of reports has generally increased into the 1990's. This increase can be attributed to the improvement of spotter networks and a more weather educated populace in the Springfield CWA. The large number of injuries in 1972 occured in one incident when a commercial bus was blown into a highway guard rail by a strong gust injuring nine people.
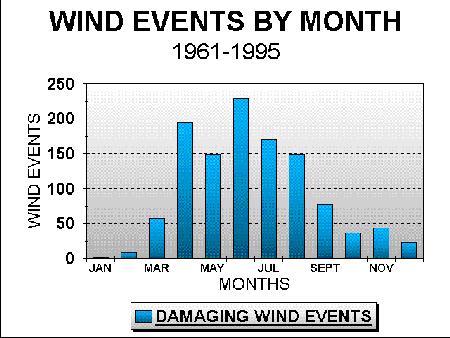
b) Monthly Distribution
The graph of the monthly distribution of damaging wind events (Figure 11) shows that June is the most active month with April a close second. In general, though, the most active period for damaging wind events occurs from April to August. The highest reported wind in the NWSO Springfield CWA reached 90 mph and occurred in Jasper county on May 11, 1973.
c) Hourly Distribution
It can be seen in the hourly distribution graph (Figure 12) that the most active hours for wind damage runs between 3:00 p.m. and 9:00 p.m. with peaks occurring at 3:00, 5:00 and 9:00 p.m. respectively. This does show a correspondence with the normal times that thunderstorms occur, namely between 3:00 p.m. and 7:00 p.m., and is a result of convection due to diurnal heating.
6. Heavy Rainfall Climatology for the Springfield NWSO
a) Total Distribution
The NWS defines heavy rainfall as greater than .30 inches of rain in one hour or .03 inches in 6 minutes. This study uses the hourly rate to describe a heavy rainfall event. The graph of yearly heavy rainfall events (Figure 13), shows an average of 29 heavy rain events per year. These corespond to the most active thunderstorm periods of the CWA.
The graph of the heavy rain events by the hour (Figure 15) shows that the most consistent times of heavy rainfall occurred in the early morning hours around 1:00 a.m. to 5:00 a.m. and is the result of the diurnal rainfall cycle. The CWA has experienced a total of 14 events exceeding 1.50 inches in one hour while the greatest hourly rainfall for the Springfield NWSO was 3.62 inches occurring on June 9, 1975.
Monthly heavy rainfall events (Figure 14) peak in September but the most continuous period is from April to June coresponding to the greater number of severe storms in the spring. There is however, a period of rainfall recharge from heavy rainfall events in September as well. The graph also indicates that the month with the most heavy rainfall (1.50 in. +) events is June.
7. Conclusion
The final analysis of the Springfield CWA severe weather statistics shows that April is the peak tornado and hail month, June is the peak wind event month and September is the peak rainfall month. The graph that sums all the severe weather reports (Figure 16) shows April to be the month with the greatest number of severe events. Also, the severe weather season is shown to begin in April and continue into June while the traditional severe weather season runs March thru May.
The hourly distribution of severe events (Figure 17) occurs between 3:00 p.m. and 7:00 p.m. which is concurrent with the traditional severe weather time period.
Tornadoes were found to occur with a frequency of 10 each year and are a significant threat to the Springfield CWA when the severe weather season begins. The majority of these tornadoes are weak, but the occurrence of strong and violent storms is always a possibility and cannot be discounted.
It is hoped that after examining this study the forecasters of the Springfield CWA will have a good working knowledge of the severe weather climatology of their forecast area and will be able to use this knowledge in the future.
Acknowledgments
I would like to thank Mike Sutton, Dan Riddle and Steve Runnels for their help in gathering the large amount of data required to do this study and their helpful suggestions in the production and review of this study.
References
Grazulis, Thomas P., Significant Tornadoes 1680-1991. Copyright July, 1993, Environmental Films, St. Johnsbury, Vermont.
National Oceanic and Atmospheric Administration, 1994-1995: Storm Data. 36,37; Nos. 1-12, National Climatic Data Center, Asheville, NC.
National Climatic Data Center, On line data access via World Wide Web(Internet).
Hart, John A., SVRPLOT version 1.00: SELS Severe Weather Archive Display Program. NSSFC, December, 1992.
Fujita, T.T., 1971a: Proposed characterization of tornadoes and hurricanes be area and intensity. SMRP No. 91, University of Chicago.


 Weather Story
 Weather Map
 Local Radar